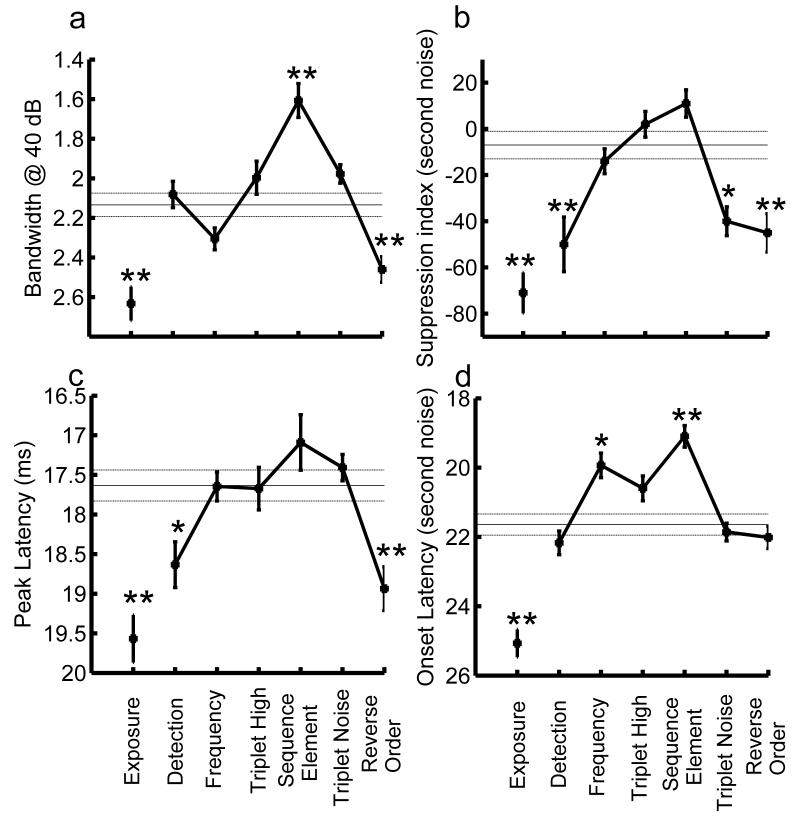
Figure 4.
Mean receptive field size, paired pulse depression and latency, for A1 recordings from each group compared to naïve controls (horizontal solid and dashed lines, mean ± s.e.m) (a) Frequency bandwidth: Training on the reverse order task increased bandwidth at 40 db above threshold while training on the sequence element task decreased bandwidth compared to controls. (b) Paired pulse suppression: Responses to the second of two noise bursts separated by 100 ms were strongly suppressed in rats trained on the easy task (detection) and the two most difficult tasks. (c) The time to peak response to tones was significantly lengthened compared to controls in rats trained on the easy (detection) and difficult (reverse order) task. (d) Onset latencies in response to the second element of two noise bursts (separated by 100 ms) were shorter for the sequence element task but not significantly different from controls for the easy and difficult tasks. The exposure group had significantly greater frequency bandwidth, paired pulse depression and longer latencies compared to naïve and trained rats. Symbols denote significant differences (ANOVA with post-hoc Tukey, * p < 0.05, ** p < 0.01) compared to naïve rats. Error bars represent standard error of the mean (s.e.m). The y-axes in panels a, c and d are reversed so that improvements in frequency selectivity and response latency are represented at the top of the figure. For clarity, the groups are ordered along the x axis by task difficulty.

