Abstract
Human serum albumin is the most abundant protein in the body and is an important biomarker used for disease-related diagnosis. Although the traditional enzyme-linked immunosorbent assay (ELISA) approach can precisely measure the concentration of human serum albumin, the multi-step procedure and time-consuming preparations of ELISA limit its diagnostic applications, preventing accurate point-of-care testing, for example. Herein, we report the recent development of an antibody-based albumin sensor that allows for a homogeneous measurement of albumin concentrations in saliva, urine and serum, in which this type of sensor is validated for the first time. The assay only requires simple mixing, and relies on time-resolved (TR) fluorescence resonance energy transfer (FRET) to produce robust, sensitive signals. The whole process, from sample preparation to final read-out, is expected to take less than one hour and requires only a standard plate-reader, thus making the sensor a convenient and cost-effective tool for albumin analysis.
Keywords: Human serum albumin (HSA), enzyme-linked immunosorbent assay (ELISA), time-resolved fluorescence energy transfer (TR-FRET), sensor
1. Introduction
Human serum albumin (HSA) is a negatively charged, non-glycosylated globular protein with a molecular weight of 67 kDa [1]. Reported to be the most abundant protein in the body, HSA accounts for 60% of the total proteins in plasma [2], and is synthesized exclusively in the liver, primarily in the polysomes of hepatocytes [1]. Possessing several low- and high-affinity ligand binding sites, HSA is able to bind ligands such as metal ions, pharmaceutical compounds, fatty acids, as well as metabolites [1, 3]. Besides serving as a carrier, HSA displays a variety of properties such as antioxidation, reactive oxygen/nitrogen species (ROS/RNS) scavenging and anti-inflammation [1].
Clinically, albumin was used in past decades to maintain vascular volume in patients with cirrhosis due to its regulation of oncotic pressure [1, 4]. Today, combined with other therapeutic approaches, the volume-expanding properties of albumin are still believed to be beneficial for patients with cirrhosis [1]. Further, administration of albumin has been shown in small studies to help resuscitate patients from hemorrhagic shock [5], treat intradialytic hypotensions [6], and prevent ovarian hyperstimulation syndrome [7].
Besides its applications in therapy, HSA is regarded as a standard biomarker, with its levels in serum, urine and saliva serving as diagnostic and prognostic criteria [2]. The normal concentration of HSA in blood serum is 35 – 50 g/L [2, 8]. In diseased conditions, however, low levels of albumin in serum (hypoalbuminemia, < 30 g/L) may reveal malnutrition, liver disease, nephrosis, gastrointestinal protein loss, shock, edema and cardiovascular disease [2]. On the other hand, high serum levels of albumin (hyperalbuminemia, > 55 g/L) are accompanied by dehydration and increasing body weight or body fat [2]. The reference range of albumin in urine is 2.2 – 25 mg/L [2, 9]. Albumin higher than 25 mg/L in urine is normally filtered through the glomerulus, and reabsorbed or catabolized by the proximal tubules. However, albumin loss increases once the renal glomeruli become more permeable due to diabetes or renal damage [2]. The severe leakage of the glomerular filtration mechanism can lead to either micro-albuminuria or macro-albuminuria, depending on the amount of albumin lost (detectable by a simple urine test) [10]. While the normal concentration of HSA in saliva is less than 0.5 g/L [2], a higher concentration of saliva albumin usually indicates type-2 diabetes mellitus [11], or, for some cancer therapy patients, the potential for stomatitis [12].
Currently the most common method used to determine albumin levels is the enzyme-linked immunosorbent assay (ELISA), which is accurate but time-consuming. Heyduk et al. previously reported a novel antibody-based sensor technology that allows homogenous detection of target proteins based on simple fluorescence [13, 14]. With this platform, a series of homogenous sensors have been developed. They include sensors for cardiac troponin I [15], C-reactive protein [15], insulin [16], C-peptide [16], and pathogenic bacteria [17]. Herein, we describe a similar sensor design that can be adapted to rapidly determine albumin concentrations in biological samples. Using simple time-resolved fluorescence (TRF), the in vitro detection of human serum albumin can reach 3.9 – 1000 ng/mL. Most importantly, we demonstrate here for the first time the validation of this type of sensor in saliva, urine and serum, with the measured concentrations matching the results obtained with the traditional ELISA method. This validation confirms the sensor as a sensitive, reliable and convenient tool for albumin analysis.
2. Materials and Methods
2.1. Sensor Design
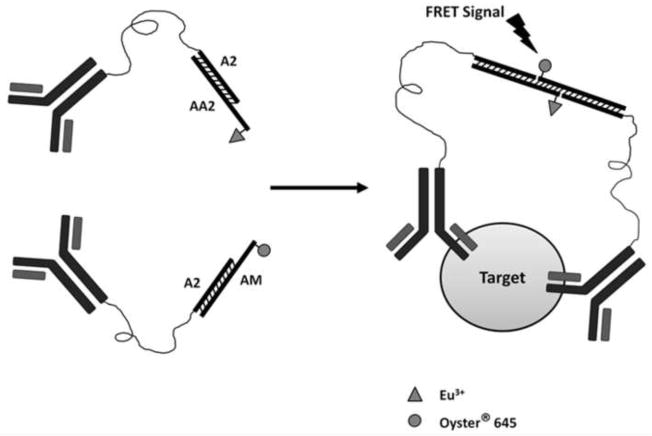
This assay consists of two human albumin-specific antibodies which recognize different epitopes of human albumin (Fig. 1). Each antibody is conjugated with short duplex DNA with overhangs complementary to each other. In the presence of human albumin, the two overhangs associate to form a duplex. Time-resolved fluorescence resonance energy transfer (TR-FRET) is initiated between the two fluorophores (labeled at the end of the two oligonucleotides) once they are brought into close proximity. The intensity of the FRET signal is proportional to the concentration of human albumin in the samples.
Fig 1. Mechanism of the sensor.
A pair of antibodies that recognize the target antigen is labeled with oligos that have complementary oligonucleotides at the ends. Both oligonucleotides are labeled with fluorophores that can be paired as donor and receptor. The presence of the target is expected to drive the annealing of the probe-labeled DNA, bringing the donor and receptor in close enough proximity to generate FRET signals.
2.2. Materials
The Traut’s reagent, NHS-(PEG)12-maleimide, protein bicinchoninic acid (BCA) test kit, and human IgG (catalog number: 31154) were from Pierce, Thermo Scientific (Rockford, IL). Ethanol, glycogen, Tris (hydroxymethyl) aminomethane, sodium chloride, pH 7.4 PBS pouch, as well as human insulin (catalog number: I0908) and bovine serum albumin (catalog number: B6917), were all purchased from Sigma Aldrich (St Louis, MO). The human albumin standard (catalog number: J80310072), albumin antibodies (monoclonals, catalog numbers: 6501-100063, 6502-100064), and human C-reactive protein (catalog number: J81610) were obtained from Biospacific (Emeryville, CA). The 384-well low-volume black microplates were from Corning (Lowell, MA). The Synergy plate reader (Synergy 4, BioTek Instruments, Winooski, VT), was equipped with a TR-FRET function and a 330 nm excitation filter (40 nm band pass), as well as a 620 nm (20 nm band pass) and a 665 nm (8 nm band pass) emission filters. The albumin sandwich ELISA kit was purchased from Assaypro (St Louis, MO) and the ELISA assay was conducted exactly according to the instructions.
All oligonucleotides were synthesized and purified by Integrated DNA Technologies (Coralville, Iowa). The following oligonucleotides were used in the sensor experiments:
A2 : 5’-amino-GCAGCCGATTCGACTTGC-3’
AA2: 5’-GCTCAT-GCAAGXCGAATCGGCTGC-3’ (X = T modified with Europium at the C6 position)
AM: 5’-AYGAGCG-GCAAGTCGAATCGGCTGC-3’ (Y = T modified with Oyster645 dye at the C6 position)
AA2 and AM contain the 5’-overhang sequences (italicized) that are expected to anneal to each other and generate TR-FRET signals in the presence of the antigen (human albumin).
2.3. Antibody modifications
The antibody modification and purifications were based on previously published procedures [15, 16]. For a detailed description of experimental procedures, please see section S1.1 in supplementary material.
2.4. Human sample collections
Untimed urine and saliva samples were randomly collected from apparently healthy personnel (including males and females) and stored at −20° C, which were later on thawed only once before the immediate measurements. The human serum samples were collected by Innovative Research (Novi, MI), from people between the ages of 18 and 65 under FDA regulations. Due to the limited number of serum samples, they were randomly processed after purchasing, by either concentrating or diluting to make their albumin concentrations in a diverse range. The processed serum samples were then stored at −20° C, and thawed only once before the immediate measurements. Since it is not for the clinical applications, the collection of these human samples was not under the IRB approval.
2.5. The assay and validation procedures
The assay of albumin concentration with the standard curve as well as data analysis was similar to the previously published procedures [15, 16]. A detailed description of experimental procedures is available at section S1.2 and S1.5 of supplementary material.
2.6. Time course study, cross-reactivity assay, intra- and inter- assay
The methods to characterize sensor kinetics, specificity, and accuracy were summarized in section S1.3, S1.4, and S1.6 of supplementary material.
3. Results and Discussions
3.1. Development of the albumin sensor
Earlier, the most dominant methods for albumin detection used chromogenic dyes such as bromocresol green (BCG) and bromocresol purple (BCP) that colorimetrically detected albumin concentrations of 10 g/L or higher in plasma and pleural or peritoneal fluids [2]. Later, however, false high backgrounds were found for both dyes [2]. BCG reacted with heparins and some globulins, especially lipoproteins. Though BCP was not reactive with BCG-targeted proteins, it could still be bound by δ-bilirubin [2]. In the quest for a more specific assay, immunochemical procedures utilizing antibodies were gradually accepted [8, 18] and replaced the dye-binding method when high sensitivity was required to detect the albumin on a mg/L scale. The initial strategy made use of a competition reaction, where albumin in the sample displaced the added antibody-bound albumin derivative. The released albumin derivative was then detected by fluorescence, radiation, scintillation or colorimetrics [8, 9, 18–22]. The most sensitive detection, however, was achieved with the sandwich ELISA technique, in which a pair of antibodies are used in combination with a peroxidase conjugate to detect urinary albumin in concentrations of 3 – 1000 μg/L [23]. Even the simplified ELISA, with only one antibody, can still detect urinary albumin at concentrations as low as 15 μg/L [24]. Despite its high sensitivity, the ELISA technique requires a considerable length of time and multiple operational steps from sample preparation to data acquisition. Even the modern commercially available ELISA kit, which uses a plate pre-coated with antibodies, still needs at least three hours to produce results.
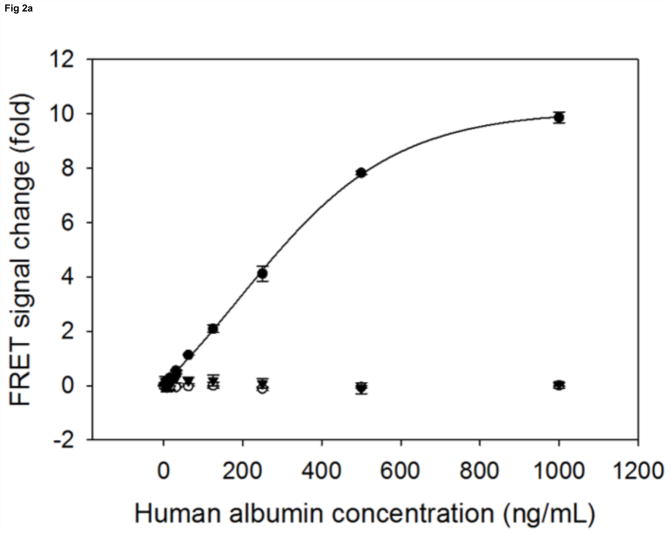
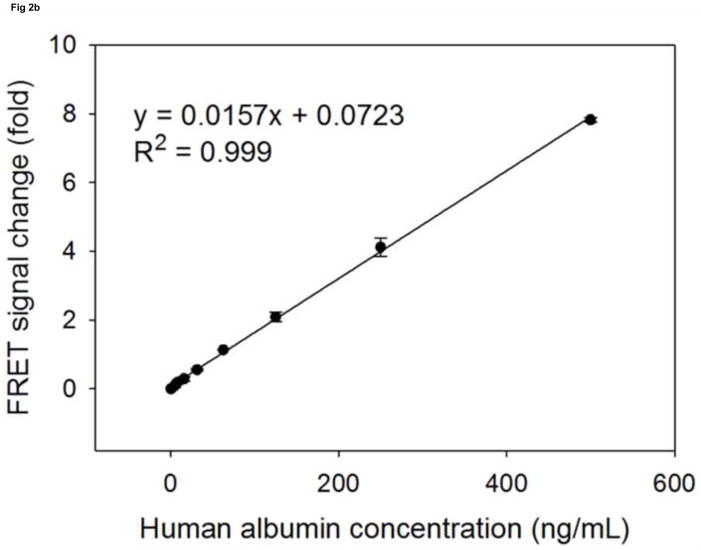
Compared to regular FRET, TR-FRET using lanthanides, especially europium (III), can significantly reduce the endogenous background fluorescence and thus achieve improved sensitivity [25]. Since the binding affinity of antibodies is key to the performance of biosensors [16], we chose a pair of antibodies that, to our knowledge, have the highest affinity for albumin, with a Ka of 109 M−1(L/mol). To prepare the human serum albumin sensor, we first modified the pair of albumin antibodies with the donor (Europium, excitation at 330nm, emission around 620nm) labeled oligonucleotide and the acceptor (Oyster645, excitation around 645nm, emission at 665nm) labeled oligonucleotide, respectively. When the pair of modified antibodies was mixed with buffer only, the background TR-FRET intensity was around 2000 (excitation at 330nm, emission monitored at 665nm). In the presence of increasing amounts of human albumin, we observed a stable and reproducible TR-FRET signal that was proportional to the concentration of albumin in the samples. The maximum intensity of TR-FRET can reach around 20000, when sensor was incubated with 1000 ng/mL albumin. The TR-FRET signal change relative to the background level was then used to plot against the concentrations of human serum albumin, with the generated standard curves shown in Fig 2a. As expected for the negative controls, mixtures of both antibodies functionalized with the DNA A2, but only one antibody labeled with either the donor (Europium) or the acceptor (Oyster645), failed to generate TR-FRET signals proportional to the increasing concentration of albumin samples (Fig. 2a). In fact, when excited at 330nm, the mixture with only one antibody labeled by the donor dye had a TRF reading around 2000 at 665nm, whose intensity is similar to the background of the sensor. On the other hand, the mixture of antibodies with only one of them labeled by the acceptor dye emitted the TRF only at an intensity around 200–300 at 665nm. This observation indicates that the background TR-FRET of the biosensor is mainly caused by the TRF of the donor dye–Europium. Taken together, in the regular TBS containing buffer, this biosensor can detect standard human serum albumin in concentrations from 3.9 ng/mL to 1000 ng/mL, with a coefficient of variation (CV) less than 3% (Fig. 2a). Within this broad detectable scope, the linear range is from 3.9 ng/mL to 500 ng/mL (Fig. 2b). The sensitivity of the sensor is comparable to most ELISA kits that are currently on the market. Although antibody 6501 was labeled by the acceptor dye and antibody 6502 was labeled with the donor dye here, as illustrated in Figure 2 and all through this paper, it is noteworthy that a switched modification (antibody 6501 labeled by the donor dye and antibody 6502 modified with the acceptor dye) would also result in the same sensor performance.
Fig 2. The standard curves of human albumin measured by sensor.
The signal change in fold (sensor’s response) is plotted against the albumin concentrations. (a): the detectable range of albumin by sensor (●) is from 3.9 to 1000 ng/mL. As negative controls, the A2 modified antibody 6502 labelled by Europium is mixed with the A2 modified antibody 6501 (○), and the A2 modified antibody 6502 is mixed with the A2 modified antibody 6501 labelled by Oyster (▼). Both mixtures are not able to generate proportional signal changes upon their incubation with increasing concentrations of albumins. (b): the linear detection range of albumin by sensor (●) is from 3.9 to 500 ng/mL.
3.2. Kinetic studies of the albumin sensor
To demonstrate this homogenous biosensor’s capability for rapid and convenient measurements, we next measured the kinetic characteristics by showing the time-dependence of signal changes in response to the amount of human albumin added (Fig. S1 in supplementary material). An increased incubation time was required to achieve either half or full signal responses when increasing amounts of antigens were added, presumably to allow the sensor mix to fully recognize the antigens present in the system and to reach an equilibrium. Full signal responses were usually achieved 40 minutes after addition of the antigens, with the only exception that when the maximum detectable amount of albumin was added, the system took around 50 minutes to reach full signal response. The repeated FRET measurements at different time-points may cause the photo-bleaching of probes, which, in our case, resulted in a slight decrease in signal response compared to the results of one-time measurement after 40 minutes. In all cases, a time length within 20 minutes after adding the albumin samples was needed to reach 50% of the maximum signal response. The full signal responses remained stable for 100 minutes (Fig. S1 in supplementary material) and even up to several hours after addition of the sample. In general, this assay is simple and fast, needing only one step of mixing and an incubation time of 40 minutes to produce results.
3.3. Specificity of the albumin sensor
To determine whether this sensor is specific to human serum albumin, we tested its cross-reactivities with human insulin, human CRP, and human IgG, which are proteins commonly existing in serum (Table S1 in supplementary material). While increasing TR-FRET was observed for human albumin at increasing concentrations from 0.06 nM to 15 nM (equaling 3.9 ng/mL to 1 μg/mL), no positive signals were detected for any other proteins at concentrations up to 1 μM. Normal insulin levels in plasma are 20–350 pM, and could be up to 100 nM in inflammed or other abnormal status. The level of human CRP in serum is usually less than 10 mg/L, but can be up to 200 mg/L (8 μM) in diseased samples. Human IgG has a concentration in blood of 4 –16 mg/mL (around 0.1 mM in maximum). Since the normal albumin level in human plasma is 35–50 g/L, a serum sample would need to be diluted at least 18000 fold for albumin determination by our sensor. Likewise, the concentrations of insulin, hCRP and IgG should be much lower than 100 nM in the samples diluted for albumin analysis, thereby presenting no interference with the performance of the albumin sensor. To see whether this sensor is reactive to albumin from different species, we tested its response to BSA, to find no positive readings for BSA at concentrations up to 1 μM (Table S1 in supplementary data). In fact, no cross-reactivity was observed even when the concentration of BSA was increased to 10 mg/mL (142.8 μM) (data not shown). Taking these results together, this simple, homogeneous assay exhibits high specificity towards human serum albumin.
3.4. Validation of the albumin sensor with the traditional ELISA method
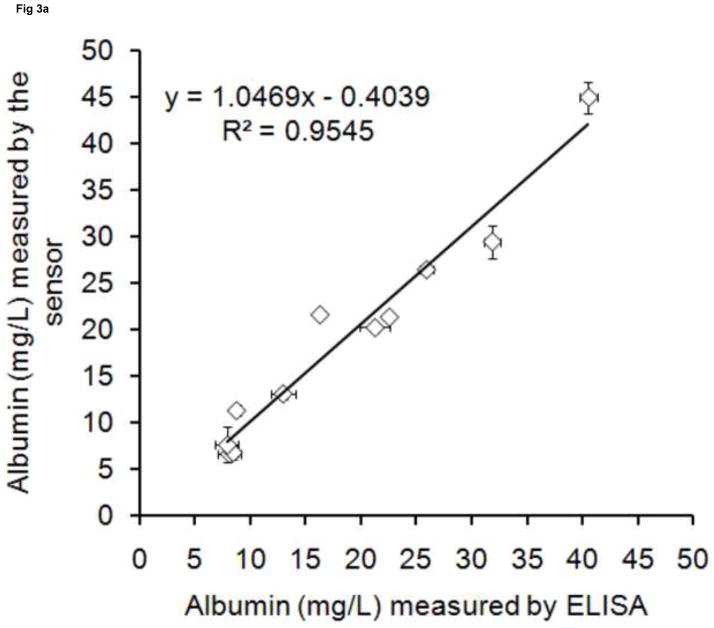
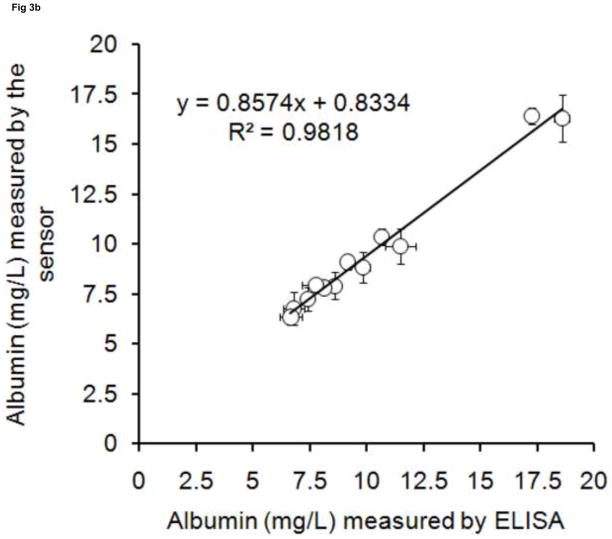
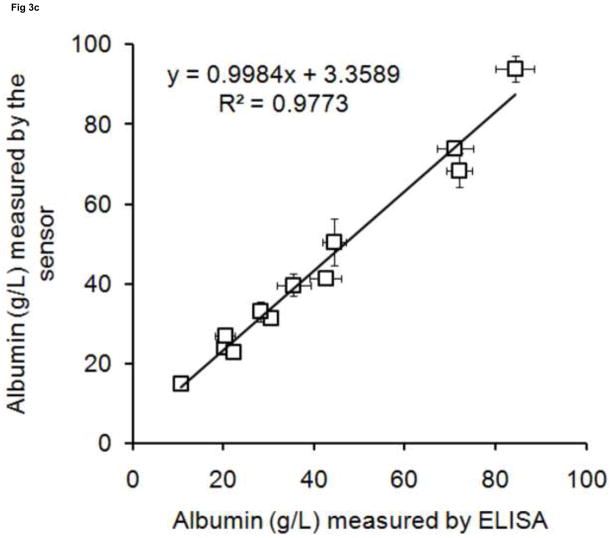
To validate this albumin sensor’s quantitative determination of albumin levels in saliva, urine and serum, we compared the results of the sensor with the results from a commercial ELISA kit performed under standard procedures. Twelve randomly collected saliva and urine samples and twelve randomly processed serum samples were assayed using both the sensor and the ELISA method. The results obtained from both methodologies are plotted in Fig. 3. There are high correlations between ELISA and the albumin sensor (R2 = 0.9545 for saliva, R2 = 0.9818 for urine, R2 = 0.9773 for serum), demonstrating that the sensor technology is feasible for quantitative determination of human albumin levels in biofluids such as saliva, urine and serum. Based on the measured values, human albumin exists in a wide range of concentrations in the saliva (5 – 45 mg/L) and urine (6 – 20 mg/L) of healthy people. Both results are within the range reported in the literature [2, 9].
Fig 3. The validation of sensor with ELISA.
Albumin concentrations were measured in (a) saliva(◇), (b) urine(○), (c) serum(□).
3.5. Intra- and Inter- CV of the albumin sensor
To examine the accuracy and consistency of albumin measurements in specimens, samples randomly chosen from saliva, urine and serum were subjected to between-assay precision and inter-assay precision studies (Table S2 and S3 in supplementary material). For an assay to be useful, the intra-assay CVs should be less than 10% and the inter-assay CVs should be less than 15% [26–28]. The intra-assay CVs of our albumin sensor were all less than 10%, with most less than 5% (Table S2 in supplementary material). Inter-assay CVs were also mostly less than 10% (Table S3 in supplementary material). Both the intra- and inter-assay CVs for most measurement of saliva were lower than those for urine and serum, while the CVs appear to be the highest for inter-assay measurements of serum. Overall, the albumin sensor is highly accurate with the precisions required for diagnostic and research applications.
4. Conclusion
We have developed a homogenous sensor that can rapidly detect human albumin in serum, saliva and urine with high specificity and sensitivity. The assay only requires simple operations, needing only one step of mixing and 30–40 minutes of waiting for the result. The signal generated is robust and stable, and does not require any sophisticated or expensive instruments. The homogenous sensor has a similar sensitivity and accuracy to the traditional ELISA method, but requires fewer operational steps and less assay time. It is therefore conceivable that this sensor can be a promising tool for future diagnostic and prognostic applications. For future work, it would be of interest to apply this sensor to real measurements in a diverse group of patient samples, and to confirm the clinical results with ELISA validation.
Supplementary Material
Highlights.
An antibody-based fluorescent sensor was developed for human serum albumin.
This sensor was demonstrated effective in measuring human samples such as saliva, urine and serum.
This sensor was validated for the first time by traditional ELISA method.
The whole assay takes less than one hour and requires only a standard plate reader.
Acknowledgments
This work was partially supported by STTR grants from National Institutes of Health (GM079891, GM079891-02S1).
Footnotes
Publisher's Disclaimer: This is a PDF file of an unedited manuscript that has been accepted for publication. As a service to our customers we are providing this early version of the manuscript. The manuscript will undergo copyediting, typesetting, and review of the resulting proof before it is published in its final citable form. Please note that during the production process errors may be discovered which could affect the content, and all legal disclaimers that apply to the journal pertain.
References
- 1.Quinlan GJ, Martin GS, Evans TW. Albumin: biochemical properties and therapeutic potential. Hepatology. 2005;41:1211–1219. doi: 10.1002/hep.20720. [DOI] [PubMed] [Google Scholar]
- 2.Peters T. All about albumin : biochemistry, genetics, and medical applications. Academic Press; San Diego, Calif: 1996. [Google Scholar]
- 3.Strand TA, Adhikari RK, Chandyo RK, Sharma PR, Sommerfelt H. Predictors of plasma zinc concentrations in children with acute diarrhea. Am J Clin Nutr. 2004;79:451–456. doi: 10.1093/ajcn/79.3.451. [DOI] [PubMed] [Google Scholar]
- 4.Schindler C, Ramadori G. Albumin substitution improves urinary sodium excretion and diuresis in patients with liver cirrhosis and refractory ascites. J Hepatol. 1999;31:1132. doi: 10.1016/s0168-8278(99)80329-8. [DOI] [PubMed] [Google Scholar]
- 5.Wettstein R, Cabrales P, Erni D, Tsai AG, Winslow RM, Intaglietta M. Resuscitation from hemorrhagic shock with MalPEG-albumin: comparison with MalPEG-hemoglobin. Shock. 2004;22:351–357. doi: 10.1097/01.shk.0000135253.14076.d9. [DOI] [PubMed] [Google Scholar]
- 6.Fortin PM, Bassett K, Musini VM. Human albumin for intradialytic hypotension in haemodialysis patients. Cochrane Database Syst Rev. 2010:CD006758. doi: 10.1002/14651858.CD006758.pub2. [DOI] [PubMed] [Google Scholar]
- 7.Cohen BM. Role of human albumin in ovarian hyperstimulation syndrome. Fertil Steril. 2008;89:1845–1846. doi: 10.1016/j.fertnstert.2008.04.004. [DOI] [PubMed] [Google Scholar]
- 8.Choi S, Choi EY, Kim DJ, Kim JH, Kim TS, Oh SW. A rapid, simple measurement of human albumin in whole blood using a fluorescence immunoassay (I) Clin Chim Acta. 2004;339:147–156. doi: 10.1016/j.cccn.2003.10.002. [DOI] [PubMed] [Google Scholar]
- 9.Akman S, Kurt I, Gultepe M, Dibirdik I, Kilinc C, Kutluay T, Karaca L, Bingol NK. The development and validation of a competitive, microtiter plate enzymeimmunoassay for human albumin in urine. J Immunoassay. 1995;16:279–296. doi: 10.1080/15321819508013563. [DOI] [PubMed] [Google Scholar]
- 10.Hemmelder MH, de Zeeuw D, de Jong PE. Measurement of glomerular charge selectivity in non-diabetic renal disease. Nephrol Dial Transplant. 1997;12(Suppl 2):57–62. [PubMed] [Google Scholar]
- 11.Vaziri PB, Vahedi M, Abdollahzadeh SH, Abdolsamadi HR, Hajilooi M, Kasraee SH. Evaluation of salivary albumin in diabetic patients. Iran J Public Health. 2009;38:54–59. [Google Scholar]
- 12.Izutsu KT, Truelove EL, Bleyer WA, Anderson WM, Schubert MM, Rice JC. Whole saliva albumin as an indicator of stomatitis in cancer-therapy patients. Cancer. 1981;48:1450–1454. doi: 10.1002/1097-0142(19810915)48:6<1450::aid-cncr2820480629>3.0.co;2-m. [DOI] [PubMed] [Google Scholar]
- 13.Heyduk E, Knoll E, Heyduk T. Molecular beacons for detecting DNA binding proteins: mechanism of action. Anal Biochem. 2003;316:1–10. doi: 10.1016/s0003-2697(03)00004-6. [DOI] [PubMed] [Google Scholar]
- 14.Heyduk T, Heyduk E. Molecular beacons for detecting DNA binding proteins. Nat Biotechnol. 2002;20:171–176. doi: 10.1038/nbt0202-171. [DOI] [PubMed] [Google Scholar]
- 15.Heyduk E, Dummit B, Chang YH, Heyduk T. Molecular pincers: antibody-based homogeneous protein sensors. Anal Chem. 2008;80:5152–5159. doi: 10.1021/ac8004154. [DOI] [PMC free article] [PubMed] [Google Scholar]
- 16.Heyduk E, Moxley MM, Salvatori A, Corbett JA, Heyduk T. Homogeneous insulin and C-Peptide sensors for rapid assessment of insulin and C-peptide secretion by the islets. Diabetes. 2010;59:2360–2365. doi: 10.2337/db10-0088. [DOI] [PMC free article] [PubMed] [Google Scholar]
- 17.Heyduk E, Heyduk T. Fluorescent homogeneous immunosensors for detecting pathogenic bacteria. Anal Biochem. 2010;396:298–303. doi: 10.1016/j.ab.2009.09.039. [DOI] [PMC free article] [PubMed] [Google Scholar]
- 18.Nargessi RD, Landon J, Pourfarzaneh M, Smith DS. Solid-phase fluoroimmunoassay of human albumin in biological fluids. Clin Chim Acta. 1978;89:455–460. doi: 10.1016/0009-8981(78)90409-6. [DOI] [PubMed] [Google Scholar]
- 19.Hart HE, Greenwald EB. Scintillation proximity assay (SPA)--a new method of immunoassay. Direct and inhibition mode detection with human albumin and rabbit antihuman albumin. Mol Immunol. 1979;16:265–267. doi: 10.1016/0161-5890(79)90065-8. [DOI] [PubMed] [Google Scholar]
- 20.Miles DW, Mogensen CE, Gundersen HJ. Radioimmunoassay for urinary albumin using a single antibody. Scand J Clin Lab Invest. 1970;26:5–11. doi: 10.3109/00365517009049206. [DOI] [PubMed] [Google Scholar]
- 21.Silver A, Dawnay A, Landon J, Cattell WR. Immunoassays for low concentrations of albumin in urine. Clin Chem. 1986;32:1303–1306. [PubMed] [Google Scholar]
- 22.Woo J, Floyd M, Cannon DC, Kahan B. Radioimmunoassay for urinary albumin. Clin Chem. 1978;24:1464–1467. [PubMed] [Google Scholar]
- 23.Fielding BA, Price DA, Houlton CA. Enzyme immunoassay for urinary albumin. Clin Chem. 1983;29:355–357. [PubMed] [Google Scholar]
- 24.Torffvit O, Wieslander J. A simplified enzyme-linked immunosorbent assay for urinary albumin. Scand J Clin Lab Invest. 1986;46:545–548. doi: 10.3109/00365518609083711. [DOI] [PubMed] [Google Scholar]
- 25.Hemmila I, Dakubu S, Mukkala VM, Siitari H, Lovgren T. Europium as a label in time-resolved immunofluorometric assays. Anal Biochem. 1984;137:335–343. doi: 10.1016/0003-2697(84)90095-2. [DOI] [PubMed] [Google Scholar]
- 26.Bansal S, DeStefano A. Key elements of bioanalytical method validation for small molecules. Aaps J. 2007;9:E109–114. doi: 10.1208/aapsj0901011. [DOI] [PMC free article] [PubMed] [Google Scholar]
- 27.Mori T, Sakatani M, Yamagishi F, Takashima T, Kawabe Y, Nagao K, Shigeto E, Harada N, Mitarai S, Okada M, Suzuki K, Inoue Y, Tsuyuguchi K, Sasaki Y, Mazurek GH, Tsuyuguchi I. Specific detection of tuberculosis infection: an interferon-gamma-based assay using new antigens. Am J Respir Crit Care Med. 2004;170:59–64. doi: 10.1164/rccm.200402-179OC. [DOI] [PubMed] [Google Scholar]
- 28.Damen CW, Rosing H, Schellens JH, Beijnen JH. Application of dried blood spots combined with high-performance liquid chromatography coupled with electrospray ionisation tandem mass spectrometry for simultaneous quantification of vincristine and actinomycin-D. Anal Bioanal Chem. 2009;394:1171–1182. doi: 10.1007/s00216-009-2775-z. [DOI] [PubMed] [Google Scholar]
Associated Data
This section collects any data citations, data availability statements, or supplementary materials included in this article.


