Abstract
Objective
To fabricate and characterize dental composites reinforced with various amounts of zirconia-silica (ZS) or zirconia-yttria-silica (ZYS) ceramic nanofibers.
Methods
Control composites (70 wt% glass particle filler, no nanofibers) and experimental composites (2.5, 5.0, and 7.5 wt% ZS or ZYS nanofibers replacing glass particle filler) were prepared by blending 29 wt% dental resin monomers, 70 wt% filler, and 1.0 wt% initiator, and polymerized by either heat or dental curing light. Flexural strength (FS), flexural modulus (FM), energy at break (EAB), and fracture toughness (FT) were tested after the specimens were stored in 37 °C deionized water for 24 h, 3 months, or 6 months. Degree of conversion (DC) of monomers in composites was measured using Fourier transformed near-infrared (FT-NIR) spectroscopy. Fractured surfaces were observed by field-emission scanning electron microscope (FE-SEM). The data were analyzed using ANOVA with Tukey’s Honestly Significant Differences test used for post hoc analysis.
Results
Reinforcement of dental composites with ZS or ZYS nanofibers (2.5% or 5.0%) can significantly increase the FS, FM and EAB of dental composites over the control. Further increase the content of ZS nanofiber (7.5%), however, decreases these properties (although they are still higher than those of the control). Addition of nanofibers did not decrease the long-term mechanical properties of these composites. All ZS reinforced composites (containing 2.5%, 5.0% and 7.5% ZS nanofibers) exhibit significantly higher fracture toughness than the control. The DC of the composites decreases with ZS nanofiber content.
Significance
Incorporation of ceramic nanofibers in dental composites can significantly improve their mechanical properties and fracture toughness and thus may extend their service life.
Keywords: reinforcement, zirconia, ceramic nanofiber, dental composites, mechanical properties, flexural strength, fracture toughness
1. Introduction
Resin-based dental composites are widely used in dentistry for the restoration of carious teeth. They have been used to replace dental amalgam restorations because of the esthetic (tooth-colored) property of composites and the safety concern for mercury in amalgam. But resin composites may have a shorter life than amalgams due to secondary (recurrent) caries and bulk fracture [1,2]. To reduce secondary caries, a number of fluoride-releasing dental composites have been developed and made commercially available. However, nearly all of the commercial fluoride-releasing dental composites have very low fluoride release and recharge capabilities,, and therefore, possess minimal caries-inhibiting effects [3–6]. In the past two decades, extensive research efforts have been directed towards the development of dental composites that release a higher amount of anti-caries agents (F−, Ca2+ and PO43− ions) [7–17]. However, dental composites reinforced with particulate fillers, particularly composites that release anti-caries agents, still demonstrate inadequate mechanical properties and fracture toughness (FT).
To reduce bulk fracture and increase mechanical properties, various high-strength, high-modulus fibers have been used to improve flexural strength (FS) and FT of composites. Such fibrillar materials include organic polymer fibers [18–22], silica and glass fibers [23–29], ceramic (SiC and Si3N4) whiskers [30–33] and carbon nanotubes [34]. Incorporation of those fibers can significantly increase stiffness, FS, FT and fatigue resistance of the composites, but the chemical stability, esthetics and handling properties of these materials are unsatisfactory. Fabrication of composite restorations reinforced by long polyethylene or glass fibers is technique-sensitive and time-consuming. Composites reinforced with glass fibers exhibit decreased mechanical properties after prolonged storage in water. For example, FS and flexural modulus (FM) of a commercial dental composite, DC-Tell (DCS Dental, Allschwil, Switzerland), which contains 38% short glass fibers, decreased 66% and 60% respectively after storage in water for 3 months. The flexural strength after dehydration did not recover to the same level of the dry-group [27]. On the other hand, ceramic materials usually have excellent mechanical properties, as well as superior chemical resistance, thermal stability and good biocompatibility. It was reported that impregnation of extremely strong SiC and Si3N4 ceramic whiskers could lead to a two-fold increase in strength and toughness in heat-cured composites [30–33]. However, such composites cannot be light cured, which limits its application, because the mismatch of the refractive indices between the whiskers (SiC 2.65 and Si3N4 2.2) and polymer resin (1.53) causes high opacity (light scattering effect) of the whisker-reinforced composites. Therefore, alternative reinforcing elements are needed for tooth-colored, light-curable fiber-reinforced dental composites.
Recently we have prepared dense zirconia-yttria (ZY), zirconia-silicia (ZS) and zirconia-yttria-silica (ZYS) ceramic nanofibers by a reactive electrospinning sol-gel method and subsequent calcinations [35]. These dense ceramic nanofibers with diameters of 100–300 nm have a tetragonal zirconia crystalline phase. In particular, ZS and ZYS nanofibers have smooth surfaces and an amorphous silica phase. They can be good candidates for reinforcement elements of dental composites.
The objective of this research is to study the reinforcement effects of dense ceramic ZS or ZYS nanofibers on dental composites, including the effects on the mechanical properties FS, FM, energy at break (EAB), and FT, and degree of conversion (DC) of monomers in the composites. The rationale for using ZS or ZYS ceramic nanofibers to reinforce dental composites is as follows: (1) zirconia-based ceramics have high toughness, good chemical stability and biocompatibility; (2) nanofibers (diameter <200 nm) may reduce light scattering as well as improve mechanical properties and polishability.
2. Materials and Methods
2.1 Materials
Camphorquinone (CQ), ethyl 4-dimethylaminobenzoate (4E), phenyl bis(2,4,6-trimethyl benzoyl)phosphine oxide (PO), benzoyl peroxide (BPO), 3-methacryloxypropyltrimethoxysilane (MPTMS) and propylamine were purchased from Aldrich. 2,2-Bis[4-(2-hydroxy-3-methacryloyloxypropoxy)phenyl]-propane (BisGMA) was purchased from Polysciences. Ethoxylated bisphenol A dimethacrylate (EBPADMA), 1,6-hexanediol dimethacrylate (HDDMA) were provided by Esstech Inc. (Essington, PA, USA). Silanized ultrafine glass filler particles (mean diameter 0.8 μm) were provided by Caulk/Dentsply. The ceramic ZS and ZYS nanofibers used in this study (mean diameter 190 nm) were prepared by sol-gel processing and reactive electrospinning following by calcination at 1200 °C as previously reported [35]. The molar ratios of Zr/Si or Zr/Y/Si are shown in Table 1.
Table 1.
Compositions of ZS and ZYS nanofibers
| Nanofibers | Zr/Y/Si (Molar ratios) |
|---|---|
| ZS1 | 90/0/10 |
| ZS2 | 80/0/20 |
| ZYS | 76.8/3.2/20 |
2.2 Preparation of nanofiber-reinforced dental composites
2.2.1 Silanization of nanofibers and dispersion of nanofibers in particulate glass filler
Ceramic ZS or ZYS nanofibers (1 g), silane coupling agent MPTMS (100 mg) and propylamine (50 mg, as a catalyst) were added to cyclohexane (200 ml), and the mixture was stirred at 70 °C for 2 hours. Solvent was then removed with a rotary evaporator. The solid was dried overnight at 110 °C in an oven, then washed with methanol and dried again at 110 °C for 2 hours. Silanized ZS or ZYS nanofibers and glass fillers (weight ratio: 2.5/67.5, 5/65 or 7.5/62.5) were added to ethanol (5 g solid in 100 ml ethanol). The mixture was sonicated for 3 min and then stirred at room temperature for 2 hours. The mixtures of ZS and glass particles or ZYS and glass particles were collected by filtration and dried at 60 °C overnight.
2.2.2 Formulation and fabrication of composites
The formulations of the control and experimental composites are listed in Table 2. All percentages listed in this paper are weight percentages. All composites were formulated with the same (29%) monomer mixture (11.6% BisGMA, 11.6% EBPADMA and 5.8% HDDMA), 70% filler mixtures, and 1% initiators (BPO for the heat-cured composites, or photoinitiator mixture for the light cured composites). Although the experimental composites with 75% or higher content of glass particles could be fabricated, the composite with 75% mixed fillers of ceramic nanofibers (2.5% or more) and glass particles had an unacceptably high viscosity and poor mechanical properties. Therefore, 70% total filler mixtures has been selected based on the formulation of several commercial products and our previous studies [11,16,17]. The composites were fabricated by mixing the monomer mixture, filler mixtures and initiators for 5 min using a SpeedMixer™ (mode DAC 150 FVZ, FlackTek, Inc.). Specimens (n = 10 for each composite) for tests of FS, FM and EAB were prepared by either heat-cure (110 °C for 2 hours in an oven) or light-cure (6×80 s on both sides with an Optilux 501 curing light, (Kerr Corp. Orange, CA) in 2×2×25 mm stainless steel molds. Specimens (n = 10) for FT tests were prepared by light-cure (6×80 s on both sides) in copper molds of 2.5×5×25 mm with a 2.41 mm notch. All specimens (for both FS and FT tests) were polished with 600 grit SiC abrasive paper.
Table 2.
Formulation of control and experimental composites.
| Composites | Composition
|
||||
|---|---|---|---|---|---|
| Monomer mixture* (%) | Glass filler (%) | Nanofibers (%) | Initiator (%)
|
||
| BPO | CQ/4E/PO** | ||||
| H-Ctr | 29 | 70.0 | 0 | 1 | |
| H1-2.5 | 29 | 67.5 | 2.5 (ZS1) | 1 | |
| H1-5.0 | 29 | 65.0 | 5.0 (ZS1) | 1 | |
| H2-2.5 | 29 | 67.5 | 2.5 (ZS2) | 1 | |
| L-Ctr | 29 | 70.0 | 0 | 1 | |
| L1-2.5 | 29 | 67.5 | 2.5 (ZS1) | 1 | |
| L1-5.0 | 29 | 65.0 | 5.0 (ZS1) | 1 | |
| L2-2.5 | 29 | 67.5 | 2.5 (ZS2) | 1 | |
| L2-5.0 | 29 | 65.0 | 5.0 (ZS2) | 1 | |
| L2-7.5 | 29 | 62.5 | 7.5 (ZS2) | 1 | |
| L-ZYS-2.5 | 29 | 67.5 | 2.5 (ZYS) | 1 | |
11.6% BisGMA, 11.6% EBPADMA, and 5.8% HDDMA
Mixture of 0.14% CQ, 0.59% 4E and 0.27% PO
2.3 Rheological characterization of the uncured resins (pastes)
The rheological properties of the uncured composite resins with different filler mixtures were measured by an ARES rheometer (TA Instruments-Waters LLC, New Castle, DE) with parallel plate configuration. The uncured composite resins were loaded onto the peltier plate at room temperature (25°C). The viscosity was measured as a function of strain under a measuring gap of 0.5 mm and an oscillation frequency of 1 Hz.
2.4 Testing of mechanical properties
Specimens were stored in deionized water at 37 °C for 24 h, 3 months or 6 months before the tests of FS, FM and EAB. Specimens for FT tests were stored in deionized water at 37 °C for 24 h. All tests were performed by a three-point-bending method on an Instron 5566 universal testing machine. FS, FM and EAB were measured simultaneously with a crosshead speed of 1 mm/min. For the FT test, the crosshead speed was 0.1 mm/min, and the actual notch length (a) was measured with a microscope and digital micrometer of Micromet 5104 Hardness Tester (Buehler). FT (KIC) was calculated by the following equation according to ASTM E993-90:
KIC = PLf(x)/(bw1.5),
where KIC = stress intensity factor (MN/m3/2),
P = load at fracture (MN),
w = width of the specimen (m),
b = thickness of the specimen (m),
a = notch length (m),
L = span (0.02m),
and f(x)=3x0.5{1.99-x(1-x)[2.15–3.93x+2.7x2]}/[2(1+2x)(1-x)1.5],
where x =a/w.
2.5 Measurement of degree of conversion
The degree of conversion (DC) was measured by Fourier transform near-infrared (FT-NIR) spectroscopy as described previously [36]. Disk composite specimens (5 mm in diameter, 2 mm in thickness, n = 5) were prepared with a Teflon ring mold pressed between a pair of glass slides (0.17 mm in thickness). A specimen was placed on the testing window of a Smart NIR UpDRIFT (Thermo-Nicolet Instrument Corp., Madison, WI), a top-loading diffuse reflection accessory, and the FT-NIR spectrum of uncured specimens (monomers) was acquired by a Thermo-Nicolet Nexus 670 FT-IR spectrometer. The specimen was then light-cured in situ (without moving the specimen) through the upper glass slide for 80 s. The FT-NIR spectrum of the cured composite was acquired again. All spectra were recorded in a wavelength range of 6400-5400 cm−1, with a resolution of 8 cm−1, and a scan number of 120. The DC was calculated with the areas of first overtone of the vinyl absorption band around 6164 cm−1:
where Au is the peak area of uncured resin (monomers) and Ac is the peak area of the cured composite (polymer) at 6164 cm−1 before and after cure, respectively.
2.6 Observation of fracture surface by SEM
The fracture surfaces of the specimens after tests of FS or FT were coated with about 5 nm thick of carbon and observed by a field-emission scanning electron microscope (FE-SEM, LEO 1530 VP).
2.7. Transmittance and refractive index
Disk samples (diameter 10 mm, thickness 1.2 mm, n = 3) with various ZS nanofiber content were made and polished to 1.0 mm thick with 0.05 μm alumina suspension (Precision Surfaces International, Houston, TX). The refractive index was measured in triplicate per sample by a refractive index meter (Presidium Instruments, Singapore). The transmittance was measured by a UV/Vis spectrophotometer (model Lambda 40, Perkin-Elmer, Waltham, MA) in a wave length range of 1100-300 nm at a scan speed of 240 nm/min according to the reported method [37].
2.8 Data analysis
The data were analyzed by ANOVA with Tukey’s Honestly Significant Differences test used for post hoc analysis. A 5% experimentwise error rate was maintained for all hypothesis tests.
3. Results and Discussion
3.1 Ceramic nanofibers
The ceramic ZS and ZYS nanofibers used in this study were prepared by sol-gel processing and reactive electrospinning followed by calcination at 1200 °C as previously reported [35]. Figure 1 shows the SEM micrograph of the ZS nanofibers (Zr/Si molar ration 80/20, mean diameter 190 nm). The lengths and distribution of the nanofibers (after mixing with monomers and glass filler particles to form a composite resin, which was then dissolved in acetone) are shown in Figure 2. The majority of the nanofibers have a length of 3 – 9 μm. The mean length is 8.7 ± 7.6 μm and the mean aspect ratio (length/diameter) is 45.6, which has exceeded the requirement for fiber reinforcement (aspect ratio > 10). The molar ratios of Zr/Si or Zr/Y/Si of other ceramic ZS and ZYS nanofibers are shown in Table 1.
Figure 1.
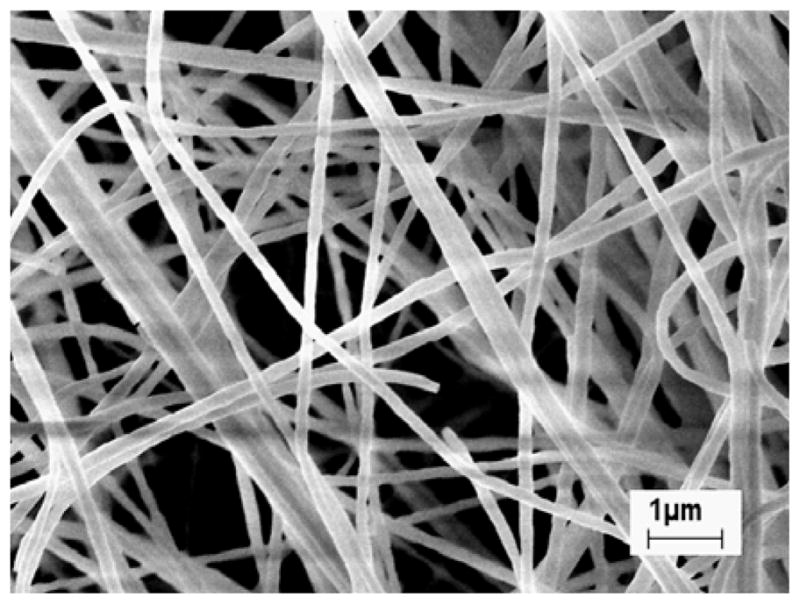
Scanning electromicrograph of ZS nanofibers (Zr/Si molar ration 80/20) calcinated at 1200 °C [35].
Figure 2.
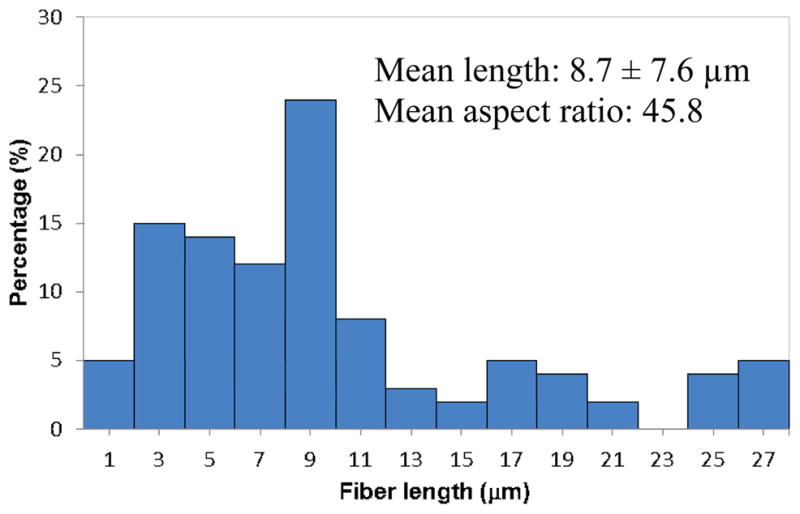
The length and distribution of ZS nanofibers in the composites.
3.2 Rheological properties of uncured resins (pastes)
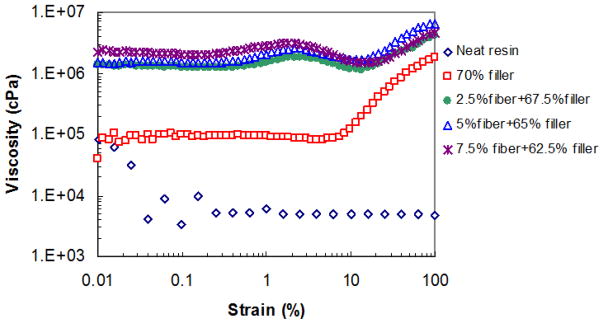
The neat resin consisting of BisGMA, EBPADMA and HDDMA at ratio of 2:2:1 (by weight) exhibits shear thinning behavior in the investigated shear strain range as shown in Figure 3. Beyond 0.2% strain, the complex viscosity remains unchanged at 7×10³ cPa. The presence of 70% particulate filler dramatically increases the paste viscosity to >105 cPa at low strain range (< 9%). Higher strain causes a significant viscosity increase (shear thickening) starting at 9% strain, which is a typical characteristic of highly filled resin paste. The nanofibers, even in small amounts, have a significant effect on the rheological property of the paste, due to their high surface area and strong interactions with the resin matrix and other fillers. As seen in Figure 3, 2.5% nanofibers (replacing 2.5 wt% particulate filler) increases the viscosity tenfold to >2×10⁶ cPa. The three pastes with various nanofiber contents all show two shear thickening stages. The first thickening transition arose at a strain of ~0.2% and viscosity reaches a peak at ~2% strain, then slightly decreases with further increased strain. This could be related to the orientation of the nanofibers along the flow direction under shear. The second shear thickening stage starting at 15% strain indicates strong filler-filler contact.
Figure 3.
The influence of the filler composition on the rheological property of the uncured composite resin.
3.3 Preparation of dental composites
In this study, zirconia-based ceramic (ZS and ZYS) nanofibers have been used to reinforce dental composites because they have high strength and toughness. ZS and ZYS ceramic nanofibers consisting of tetragonal crystalline zirconia and amorphous silica have smooth surfaces without any visible grain boundary even under high resolution FE-SEM (Figure 1) [35]. The refractive index of ZS2 was calculated as 2.04 (compared to 2.17 for zirconia) by the method established by Aminabhavi [38]. Like the glass filler particles, the ceramic nanofibers must be treated with silane coupling agent to increase the wetting and interfacial adhesion between nanofibers and polymer resin [39]. However, (yttria-stabilized) zirconia is known to be inert and direct surface treatment with silane coupling agent is ineffective. In this study, the silica phase in the ZS and ZYS nanofibers allows the surface modification through a silane coupling reaction. The successful silane treatment of the ZS and ZYS nanofibers was indicated by the observation that the treated (hydrophobic) nanofibers could float on the surface of motionless water for an extended period of time (hours) while the untreated (hydrophilic) nanofibers sink into water immediately. The FT-NIR spectra (not shown) of the silane-treated ceramic nanofibers have a small peak at around 6164 cm−1 indicating the presence of the methacrylate from the 3-methacryloxypropyltrimethoxysilane (MPTMS).
Uniform dispersion of the nanofibers in the resin matrix is also crucial to the mechanical properties of the composite. Aggregates or bundles of the nanofibers in a composite may decrease transparency and significantly decrease the reinforcement effect. Due to the high viscosity of dental resins (uncured composites), however, uniform dispersion of ceramic nanofibers is a great challenge. Initially we tried three blending methods: (1) all components (the monomers, initiators, glass filler particles, and nanofibers) were mixed simultaneously using a SpeedMixer™; (2) the nanofibers were first mixed with the monomer mixture in methanol. After solvent evaporation, the mixture of the monomers and nanofibers was then mixed with the particulate glass filler and initiators using a SpeedMixer™; (3) the nanofibers were first mixed with particulate glass filler in ethanol. After the solvent was completely removed, the mixture of nanofibers and glass particles was further mixed with monomers and initiators using a SpeedMixer™. The preliminary tests indicated that the composite (L1-2.5) containing 2.5% ZS nanofibers prepared through Method 3 had significantly higher FS than the control composites and the composites prepared by methods (1) and (2) (FS: 111.9 ± 12.0 MPa (prepared by Method 1), 116.6 ± 21.0 MPa (prepared by Method 2), 138.2 ± 24.8 MPa (prepared by Method 3)). The glass particles seem to help the dispersion of the nanofibers. Therefore, Method (3) was used in the preparation of all experimental composites in this research.
3.4 Influence of nanofibers on mechanical properties of composites
Table 3 shows the FS, FM and EAB of heat-cured control and experimental composites. The testing of the composite H1-2.5 containing 2.5% ZS1 nanofibers (zirconia/silica 90/10) showed that at 24 hours both FS and EAB increased significantly over the control by 28.7% (p = 0.004) and 64.87% (p = 0.029), respectively, while the FM increased only by 6.29%, which was not statistically significant (p = 0.145). When ZS1 nanofiber content was increased to 5% (H1-5.0), there was no significant change in the mean FS (p = 0.815), FM (p = 0.946), and EAB (p = 0.996) compared with H1-2.5. The difference between ZS1 (used in H1-2.5 and H1-5.0) and ZS2 (used in H2-2.5) was the ratio of zirconia and silica (ZrO2/SiO2 = 9/1 in ZS1 and 8/2 in ZS2). The results indicated that the ratio of zirconia/silica in nanofibers did not have significant influence on the mechanical properties, although H2-2.5 showed a slightly higher FS and EAB than H1-2.5 at 24 h.
Table 3.
Mechanical properties of heat-cured composites.
| Composite | Storage time in 37 °C water | Flexural Strength (MPa) | Modulus (GPa) | Energy at Break (mJ) |
|---|---|---|---|---|
| H-Ctr | 24 h | 99.8 ± 9.4b | 8.59 ± 0.67a | 6.49 ± 1.82b,c,d |
| 3 months | 98.1 ± 12.5b | 9.08 ± 1.02a | 6.09 ± 1.63c,d | |
| 6 months | 100.7 ± 6.1b | 9.27 ± 0.45a | 5.56 ± 0.73d | |
|
| ||||
| H1-2.5 | 24 h | 128.4 ± 24.4a | 9.13 ± 0.61a | 10.70 ± 4.08a |
| 3 months | 124.5 ± 12.9a | 8.79 ± 0.34a | 10.10 ± 2.53a,b | |
| 6 months | 124.1 ± 19.1a | 9.05 ± 0.53a | 9.94 ± 3.47a,b,c | |
|
| ||||
| H1-5.0 | 24 h | 135.4 ± 16.1a | 8.99 ± 0.53a | 10.36 ± 2.98a,b |
|
| ||||
| H2-2.5 | 24 h | 135.4 ± 15.8a | 8.79 ± 0.35a | 12.09 ± 4.65a |
The groups with the same superscript letters have no significant difference (p > 0.05). (For H1 composites, zirconia/silica = 90/10; for H2 composites, zirconia/silica = 80/20.)
After 3 or 6 months storage of H-Ctr and H1-2.5 specimens in 37 °C deionized water, FS and FM of both H-Ctr and H1-2.5 composites did not change significantly compared with those at 24 h, as shown in Table 3 as the same group. This was a significant improvement over the glass-fiber-reinforced dental composites as reported in [27]. The mean EAB of H1-2.5 was nearly double that of controls at both 3 months (p = 0.053) and 6 months (p = 0.019). In summary, the ceramic nanofibers can increase the composite’s long-term resistance to fracture.
While heat-cured dental composites can be used for indirect restorations, light-cured dental composites are more widely used in the dental clinic for direct restorations. Therefore, it is more important to study the influence of nanofibers on mechanical properties of light-cured dental composites. Table 4 shows the FS, FM, and EAB of light-cured dental composites after 24 h or 6 months storage in 37 °C deionized water. Although some overlapping in statistical grouping occurred (indicated by multiple superscript letters), some general trends can be seen. FS of the control composite (L-Ctr) was similar to the corresponding heat-cured control composite. All light-cured composites containing ZS1, ZS2, or ZYS nanofibers had significantly higher initial (24 h) FS than the control composite. Similar to heat-cured composites, the zirconia/silica ratio in the ceramic nanofibers did not significantly affect the mechanical properties of light-cured nanofiber-reinforced composites (L1-2.5 vs. L2-2.5, L1-5.0 vs. L2-5.0). No statistically significant difference of FS was observed among the composites L1-2.5, L1-5.0, L2-2.5, L2-5.0 and L-ZYS-2.5. The composite L-ZYS-2.5 exhibited the highest mean FS (146.4 ± 10.3 MPa), which was 42.3% higher than that of the control composite. The addition of more ZS2 nanofibers (7.5%) to the composite (L2-7.5) decreased FS slightly, but the value was still higher than that of control composites without nanofibers.
Table 4.
Mechanical properties of light-cured composites.
| Composite | Storage time in 37 °C water | Flexural Strength (MPa) | Modulus (GPa) | Energy at Break (mJ) |
|---|---|---|---|---|
| L-Ctr | 24 h | 102.6 ± 9.4c,d | 8.43 ± 0.32d | 8.15 ± 1.76b,c,d |
| 6 months | 91.9 ± 13.4d | 9.56 ± 0.62b,c | 4.50 ± 1.46d | |
|
| ||||
| L1-2.5 | 24 h | 143.2 ± 20.5a,b | 9.27 ± 0.56b,c,d | 13.28 ± 5.37a |
|
| ||||
| L1-5.0 | 24 h | 141.9 ± 22.3a,b | 9.65 ± 0.80b,c | 12.44 ± 5.03a,b |
|
| ||||
| L2-2.5 | 24 h | 142.7 ± 17.1a,b | 9.59 ± 0.71b,c | 11.86 ± 2.61a,b |
| 6 months | 137.4 ± 18.0a,b | 9.85 ± 0.52a,b | 10.96 ± 3.27a,b,c | |
|
| ||||
| L2-5.0 | 24 h | 142.7 ± 14.6a,b | 10.07 ± 0.63a,b | 11.12 ± 3.67a,b,c |
| 6 months | 115.0 ± 11.1c | 10.71 ± 0.38a | 6.37 ± 1.47c,d | |
|
| ||||
| L2-7.5 | 24 h | 122.6 ± 15.0b,c | 8.79 ± 0.64c,d | 10.13 ± 2.43a,b,c |
|
| ||||
| L-ZYS-2.5 | 24 h | 146.4 ± 10.3a | 9.77 ± 0.63b | 12.69 ± 2.03a |
The groups with the same superscript letters have no significant difference (p > 0.05). (For L1 composites, zirconia/silica = 90/10; for L2 composites, zirconia/silica = 80/20.)
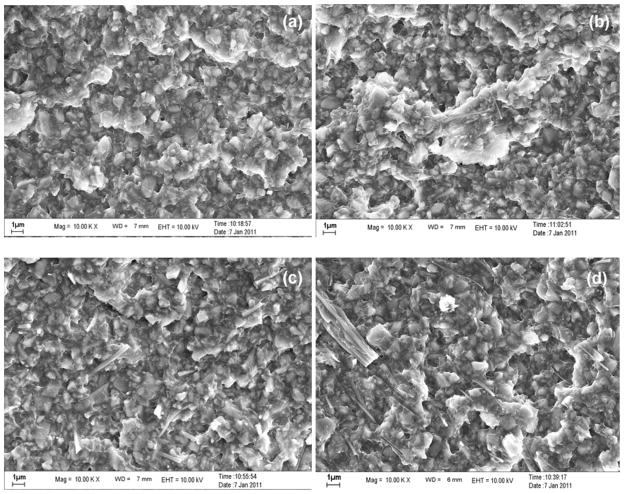
With an increasing amount of nanofibers that have very large surface area, the resin matrix may not be able to wet the nanofiber surface and cause the viscosity to increase (Figure 3 and section 3.2), which make it more difficult to disperse the nanofibers uniformly in the resin matrix. High fiber loading could lead to the formation of voids in the composites due to the fiber-fiber agglomeration which also contributes to nonuniform stress transfer. Furthermore, the reduced degree of conversion also leads to the reduction of mechanical strength (section 3.3). Figure 4 displays the FE-SEM images of the fracture surface of experimental composites with different nanofiber contents after FS measurement. In Figure 4(b) (L2-2.5) and 4(c) (L2-5.0), nanofibers pull-out residues were clearly observed, indicating the fiber reinforcement effect. Figure 4(b) (L2-2.5) only showed individual fibers while Figure 4(c) (L2-5.0) showed some twin fibers. No large bundles were observed on the fracture surface, indicating that nanofibers were quite uniformly dispersed in the composite matrix. In Figure 4(d) (L2-7.5), some thick bundles of multiple nanofibers were observed, indicating that the ceramic nanofibers were not uniformly dispersed. Therefore, a new formulation of monomer mixture with lower viscosity would improve the wetting and impregnation of nanofibers and their dispersion in the resins. However, our previous study on composites with particulate filler indicated that increasing the content of the low viscosity monomer (HDDMA) will likely decrease the mechanical properties [17]. Therefore, the overall effects of monomer mixtures and nanofiber contents on the mechanical properties need to be optimized.
Figure 4.
FE-SEM images of the fractured surface of ZS2 nanofiber-reinforced composites after flexural strength test: (a) L2-Ctr, (b) L2-2.5, (c) L2-5.0; (d) L2-7.5.
After 6 months storage in 37 °C deionized water, the FS of the control composite (L-Ctr) decreased but not significantly (p = 0.852); its FM increased significantly (p = 0.002); and its EAB decreased, but not significantly (p = 0.327). There was no significant change in the FS (p = 0.999) or EAB (p = 0.999) of ZS2-reinforced composites (L2-2.5) and they were higher than the control composite (L-Ctr) (for FS p < 0.001 and for EAB p = 0.001). The FS and EAB of L2-5.0 decreased (for FS p = 0.005, for EAB p = 0.067) and the FS was significantly higher than that of the control composites (p = 0.03) while the EAB was not significantly different (p = 0.949). The decrease of FS and EAB for L2-5.0 is probably due to the lower degree of conversion caused by increased light scattering (see the following section). None of the ceramic nanofiber reinforced composites’ modulus changed significantly.
3.5 Influence of ZS nanofibers on degree of conversion (DC) and translucence
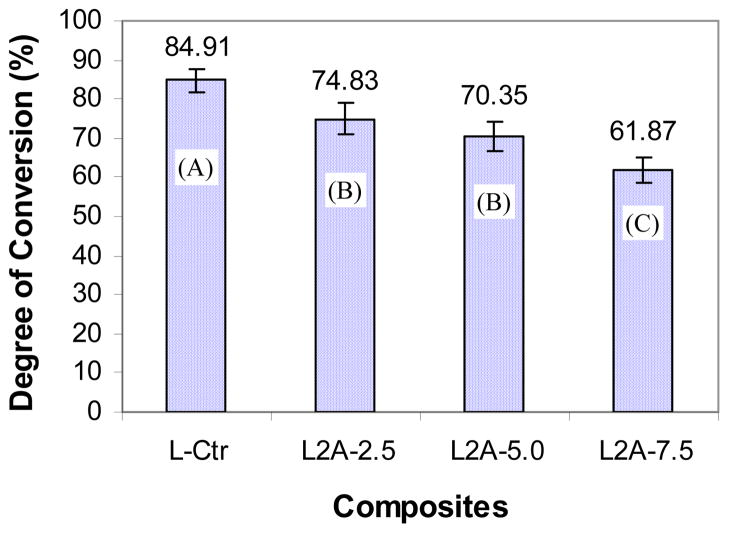
Figure 5 shows the DC of monomers in the light-cured control composite and experimental composites. Through the efforts of reducing the diameter of the ceramic fiber to the nano-scale (< 200 nm) and incorporating the amorphous silica in the ceramic nanofibers, the ceramic nanofiber-reinforced composites can be light-cured with acceptable DC (62%–75%), which was a significant improvement over the composites reinforced with SiC and Si3N4 whiskers, which can not be light cured [30–33]. On the other hand, due to the high refractive index of the zirconia, the refractive indices of the ZS nanofiber-reinforced composites increase with increasing content of ZS nanofibers while the translucence, as determined by transmittance at 470 nm matching the wave length of dental curing light [37], decreases with the increasing content of ZS nanofibers, as shown in Figure 6. Therefore, the DC of the composites decreases with increasing content of the ceramic nanofibers as shown in Figure 5. The reduction in DC may lead to lower mechanical properties, as shown in the case of composite L2-7.5 (Table 4). It can also increase the elution of uncured monomers, which in turn will cause a reduction in the mechanical properties of the composite after immersion in water for 6 months, as demonstrated by composite L2-5.0 (Table 4).
Figure 5.
Influence of ZS nanofibers on the degree of conversion (groups with the same letter do not have significant difference (p > 0.05)).
Figure 6.
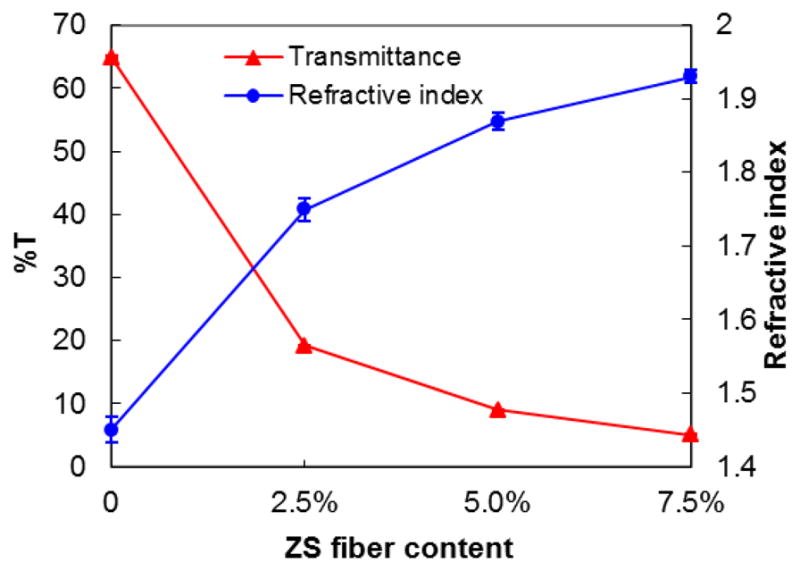
Refractive index and transmittance of ZS nanofiber-reinforced composites
The above results indicate that impregnation of ZS ceramic nanofibers in light-cured dental composites may have two opposite effects: a fiber reinforcing effect and a weakening effect due to the decrease of DC and the formation of fiber bundles. Therefore, the content of ceramic nanofibers in the composite needs to be optimized in order to tune the composites’ mechanical properties. Our experimental results indicate that the suitable content of ZS nanofibers in a dental composite is in the range 2.5% – 5.0%.
3.6 Influence of ZS nanofibers on fracture toughness
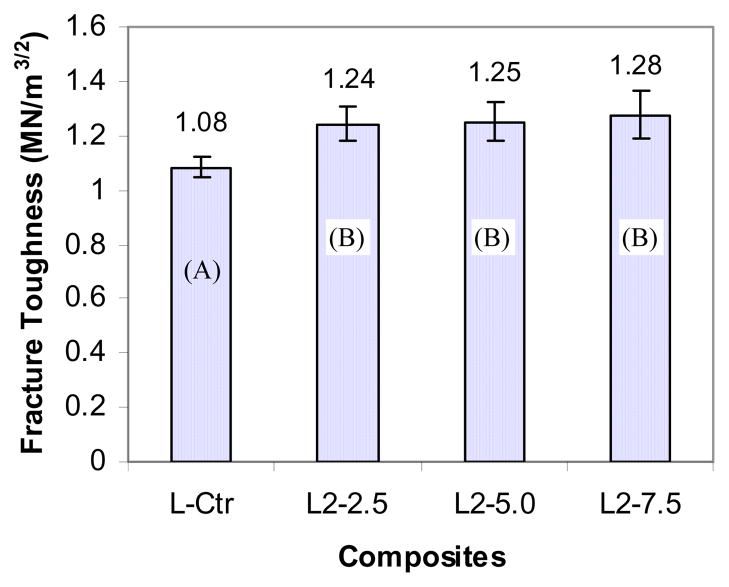
Fracture toughness reflects the resistance to crack propagation from an initiating flaw in materials. This property is very important in dental composites because bulk fracture is one of the main reasons for a shorter life of composites compared to amalgams [2]. Therefore, FT of light-cured dental composites reinforced by nanofibers was tested and the results are shown in Figure 6. When 2.5% ZS2 nanofibers were added to the composites, FT increased significantly over the control composite (p < 0.05) but further increase in the fiber content (5.0% or 7.5%) did not lead to significant change in FT (p>0.05).
Two factors may contribute to the increase of FT. First, according to the “bridging” mechanism [32], ZS nanofibers play the “bridge” role in the fracture regions. When a micro-crack is initiated in a dental composite, ZS nanofibers remain intact across the crack planes and support the applied load. Crack-opening is therefore resisted by the bridging fibers and the resin matrix is reinforced. Secondly, the stress-induced phase transformation of zirconia contributes to the toughening effect. In the event of a propagating crack passing the metastable regions of zirconia, the concentrated stress field at the crack tip enables tetragonal crystals of zirconia to transform to stable but less dense monoclinic zirconia. The associated volumetric expansion tends to close the crack and relieve the stress at its tip [36].
Conclusion
Partial substitution (2.5%, 5.0%) of particulate glass filler with zirconia/silica or zirconia/yttria/silica nanofibers can significantly improve mechanical properties (flexural strength and fracture toughness) of the composites although it slightly decreases the degree of conversion of monomers in the composites. Further increase of nanofiber content (7.5% or above), however, will result in a decrease in flexural strength. To further increase nanofiber content without decreasing DC and strength, fiber materials with a lower refractive index will be needed. Therefore, the ceramic nanofibers with lower zirconia/silica ratio and other ceramic materials are under study in our group. A monomer composition with lower viscosity and new methods to disperse the ceramic nanofibers more uniformly in the resin matrix and to minimize the air bubbles during blending will also likely to further improve the mechanical properties of the composite.
Figure 7.
Influence of ZS nanofibers on fracture toughness of light-cured composites (groups with the same letter do not have significant difference (p > 0.05)).
Acknowledgments
This project is sponsored by NIH/NIDCR grants 5R21DE018349-03 and 5R01DE019203-03.
Footnotes
Publisher's Disclaimer: This is a PDF file of an unedited manuscript that has been accepted for publication. As a service to our customers we are providing this early version of the manuscript. The manuscript will undergo copyediting, typesetting, and review of the resulting proof before it is published in its final citable form. Please note that during the production process errors may be discovered which could affect the content, and all legal disclaimers that apply to the journal pertain.
References
- 1.Mjör IA. Frequency of secondary caries at various anatomical locations. Oper Dent. 1985;10:88–92. [PubMed] [Google Scholar]
- 2.Deligeorgi V, Mjör IA, Wilson NH. An overview of reasons for the placement and replacement of restorations. Prim Dent Care. 2001;8:5–11. doi: 10.1308/135576101771799335. [DOI] [PubMed] [Google Scholar]
- 3.Hicks J, Garcia-Godoy F, Donly K, Flaitz C. Fluoride-releasing restorative materials and secondary caries. J Calif Dent Assoc. 2003;31:229–245. [PubMed] [Google Scholar]
- 4.Xu X, Burgess JO. Compressive strength, fluoride release and recharge of fluoride-releasing materials. Biomaterials. 2003;24:2451–2461. doi: 10.1016/s0142-9612(02)00638-5. [DOI] [PubMed] [Google Scholar]
- 5.Burke FM, Ray NJ, McConnell RJ. Fluoride-containing restorative materials. Int Dent J. 2006;56:33–43. doi: 10.1111/j.1875-595x.2006.tb00072.x. [DOI] [PubMed] [Google Scholar]
- 6.Wiegand A, Buchalla W, Attin T. Review on fluoride-releasing restorative materials-Fluoride release and uptake characteristics, antibacterial activity and influence on caries formation. Dent Mater. 2007;23:343–362. doi: 10.1016/j.dental.2006.01.022. [DOI] [PubMed] [Google Scholar]
- 7.Rawls HR. Fluoride-releasing acrylics. J Biomater Appl. 1987;1:382–405. doi: 10.1177/088532828600100406. [DOI] [PubMed] [Google Scholar]
- 8.Arends J, Ruben J. Fluoride-releasing from a composite resin. Quint Int. 1988;19:513–514. [Google Scholar]
- 9.Aasen SM, Oxman JD, Ubel A. Organic fluoride sources. 4,871,786. US Patent. 1989 Oct
- 10.Glasspoole EA, Erickson RL, Davidson CL. A fluoride-releasing composite for dental applications. Dent Mater. 2001;17:127–133. doi: 10.1016/s0109-5641(00)00051-8. [DOI] [PubMed] [Google Scholar]
- 11.Skrtic D, Antonucci JM. Dental composites based on amorphous calcium phosphate — resin composition/physicochemical properties study. J Biomater Appl. 2007;21:375–393. doi: 10.1177/0885328206064823. [DOI] [PMC free article] [PubMed] [Google Scholar]
- 12.Xu HH, Weir MD, Sun L. Calcium and phosphate ion releasing composite: effect of pH on release and mechanical properties. Dent Mater. 2009;25:535–542. doi: 10.1016/j.dental.2008.10.009. [DOI] [PMC free article] [PubMed] [Google Scholar]
- 13.Xu X, Burgess JO, Ding X, Ling L. Fluoride-releasing compositions. 6,703,518. US Patent. 2004 March 9;
- 14.Xu X, Ling L, Ding X, Burgess JO. Synthesis and characterization of a novel fluoride-releasing dimethacrylate monomer and its dental composite. J Polym Sci: Part A: Polym Chem. 2004;42:985–998. [Google Scholar]
- 15.Xu X, Ding X, Ling L, Burgess JO. Synthesis and characterization of novel fluoride-releasing monomers 2: Dimethacrylates containing bis(aminodiacetic acid) and their ternary zirconium-fluoride complexes. J Polym Sci: Part A: Polym Chem. 2005;43:3153–3166. [Google Scholar]
- 16.Xu X, Ling L, Wang R, Burgess JO. Formulation and characterization of a novel fluoride-releasing dental composite. Dent Mater. 2006;22:1014–1023. doi: 10.1016/j.dental.2005.11.027. [DOI] [PubMed] [Google Scholar]
- 17.Ling L, Xu X, Choi GY, Billodeaux D, Guo G, Diwan RM. Novel F-releasing composite with improved mechanical property. J Dent Res. 2009;88:83–88. doi: 10.1177/0022034508328254. [DOI] [PMC free article] [PubMed] [Google Scholar]
- 18.Lin S, Cai Q, Ji J, Sui G, Yu Y, Yang X, Ma Q, Wei Y, Deng X. Electrospun nanofiber reinforced and toughened composites through in situ nano-interface formation. Composite Sci Technol. 2008;68:3322–3329. [Google Scholar]
- 19.Fong H. Electrospun nylon 6 nanofiber reinforced Bis-GMA/TEGDMA dental restorative composite resins. Polymer. 2004;45:2427–2432. [Google Scholar]
- 20.Van Heumen CCM, Kreulen CM, Bronkhorst EM, Lesaffre E, Creugers NHJ. Fiber-reinforced dental composites in beam testing. Dent Mater. 2008;24:1435–1443. doi: 10.1016/j.dental.2008.06.006. [DOI] [PubMed] [Google Scholar]
- 21.Sun W, Cai Q, Li P, Wei Y, Xu M, Yang X. Post-draw PAN-PMMA nanofiber reinforced and toughened Bis-GMA dental restorative composite. Dent Mater. 2010;26:873–880. doi: 10.1016/j.dental.2010.03.022. [DOI] [PubMed] [Google Scholar]
- 22.Kurunmäki H, Kantola R, HatamLeh MM, Watts DC, Vallittu PK. A fiber-reinforced composite prosthesis restoring a lateral midfacial defect: A clinical report. J Prosthet Dent. 2008;100:348–352. doi: 10.1016/S0022-3913(08)60235-8. [DOI] [PubMed] [Google Scholar]
- 23.Garoushi S, Vallittua PK, Lassilaa LV. Short glass fiber reinforced restorative composite resin with semi-inter penetrating polymer network matrix. Dent Mater. 2007;23:1356–1362. doi: 10.1016/j.dental.2006.11.017. [DOI] [PubMed] [Google Scholar]
- 24.Behr M, Rosentritt M, Latzel D, Kreisler T. Comparison of three types of fiber-reinforced composite molar crowns on their fracture resistance and marginal adaptation. J Dent. 2001;29:187–196. doi: 10.1016/s0300-5712(01)00007-0. [DOI] [PubMed] [Google Scholar]
- 25.Giordano R. Fiber reinforced composite resin system. Gen Dent. 2000;48:244–249. [PubMed] [Google Scholar]
- 26.Knobloch LA, Kerby RE, Seghi R, Berlin JS, Clelland N. Fracture toughness of packable and conventional composite materials. J Prosthet Dent. 2002;88:307–313. doi: 10.1067/mpr.2002.128069. [DOI] [PubMed] [Google Scholar]
- 27.Lastumäki TM, Lassila LVJ, Vallittu PK. Flexural properties of the bulk fiber-reinforced composite DC-Tell used in fixed partial dentures. Int J Prosthodont. 2001;14:22–26. [PubMed] [Google Scholar]
- 28.Meric G, Dahl JE, Ruyter IE. Cytotoxicity of silica–glass fiber reinforced composites. Dent Mater. 2008;24:1201–1206. doi: 10.1016/j.dental.2008.01.010. [DOI] [PubMed] [Google Scholar]
- 29.Schlichting LH, de Andrada MA, Vieira LC, de Oliveira Barra GM, Magne P. Composite resin reinforced with pre-tensioned glass fibers, Influence of prestressing on flexural properties. Dent Mater. 2010;26:118–125. doi: 10.1016/j.dental.2009.09.004. [DOI] [PubMed] [Google Scholar]
- 30.Xu HH, Martin TA, Antonucci JM, Eichmiller FC. Ceramic whisker reinforcement of dental resin composites. J Dent Res. 1999;78:706–712. doi: 10.1177/00220345990780021101. [DOI] [PubMed] [Google Scholar]
- 31.Xu HH. Dental composite resins containing silica-fused ceramic single-crystalline whiskers with various filler levels. J Dent Res. 1999;78:1304–1311. doi: 10.1177/00220345990780070401. [DOI] [PubMed] [Google Scholar]
- 32.Xu HH. Whisker-reinforced heat-cured dental resin composites: effects of filler level and heat-cure temperature and time. J Dent Res. 2000;79:1392–1397. doi: 10.1177/00220345000790060701. [DOI] [PubMed] [Google Scholar]
- 33.Xu HH, Quinn JB, Smith DT, Giuseppetti AA, Eichmiller FC. Effects of different whiskers on the reinforcement of dental resin composites. Dent Mater. 2003;19:359–367. doi: 10.1016/s0109-5641(02)00078-7. [DOI] [PubMed] [Google Scholar]
- 34.Zhang F, Xia Y, Xu L, Gu N. Surface modification and microstructure of single-walled carbon nanotubes for dental resin-based composites. J Biomed Mater Res B Appl Biomater. 2008;86:90–97. doi: 10.1002/jbm.b.30991. [DOI] [PubMed] [Google Scholar]
- 35.Xu X, Guo G, Fan Y. Fabrication and characterization of dense zirconia and zirconia-silica ceramic nanofibers. J Nanosci Nanotechnol. 2010;10:5672–5679. doi: 10.1166/jnn.2010.2441. [DOI] [PMC free article] [PubMed] [Google Scholar]
- 36.Stansbury JW, Dickens SH. Determination of double bond conversion in dental resins by near infrared spectroscopy. Dent Mater. 2001;17:71–79. doi: 10.1016/s0109-5641(00)00062-2. [DOI] [PubMed] [Google Scholar]
- 37.Suzuki H, Taira M, Wakasa K, Yamaki M. Refractive-index-adjustable fillers for visible-light-cured dental resin composites: preparation of TiO2-SiO2 glass powder by the sol-gel process. J Dent Res. 1991;70:883–888. doi: 10.1177/00220345910700050401. [DOI] [PubMed] [Google Scholar]
- 38.Aminabhavi TM. Predicting refractive index and density increments of binary solvent mixtures. J Chem Eng Data. 1987;32:406–409. [Google Scholar]
- 39.Halvorson RH, Erickson RL, Davidson CL. The effect of filler and silane content on conversion of resin-based composite. Dent Mater. 2003;19:327–333. doi: 10.1016/s0109-5641(02)00062-3. [DOI] [PubMed] [Google Scholar]


