Abstract
The primary goal of this study was to characterize the variability in auditory-nerve temporal response patterns obtained with the electrically evoked compound action potential (ECAP) within and across a relatively large group of cochlear-implant recipients. ECAPs were recorded in response to each of 21 pulses in a pulse train for five rates (900, 1200, 1800, 2400, and 3500 pps) and three cochlear regions (basal, middle, and apical). An alternating amplitude pattern was typically observed across the pulse train for slower rates, reflecting refractory properties of individual nerve fibers. For faster rates, the alternation ceased and overall amplitudes were substantially lower relative to the first pulse in the train, reflecting cross-fiber desynchronization. The following specific parameters were examined: (1) the rate at which the alternating pattern ceased (termed stochastic rate), (2) the alternation depth and the rate at which the maximum alternation occurred, and (3) the average normalized ECAP amplitude across the pulse train (measure of overall adaptation/desynchronization). Data from 29 ears showed that stochastic rates for the group spanned the entire range of rates tested. The majority of subjects (79%) had different stochastic rates across the three cochlear regions. The stochastic rate occurred most frequently at 2400 pps for basal and middle electrodes, and at 3500 pps for apical electrodes. Stimulus level was significantly correlated with stochastic rate, where higher levels yielded faster stochastic rates. The maximum alternation depth averaged 19% of the amplitude for the first pulse. Maximum alternation occurred most often at 1800 pps for basal and apical electrodes, and at 1200 pps for middle electrodes. These differences suggest some independence between alternation depth and stochastic rate. Finally, the overall amount of adaptation or desynchronization ranged from 63% (for 900 pps) to 23% (for 3500 pps) of the amplitude for the first pulse. Differences in temporal response properties across the cochlea within subjects may have implications for developing new speech-processing strategies that employ varied rates across the array.
Keywords: cochlear implant, electrically evoked compound action potential, temporal response, stochastic, stimulation rate
1. Introduction
Many stimulus parameters for speech-processor programs can be manipulated to improve speech perception with a cochlear implant (CI). One parameter that has been shown to affect performance is the rate at which each electrode stimulates the auditory nerve (e.g., Brill et al., 1997; Friesen et al., 2005; Holden et al., 2002; Kiefer et al., 2000; Loizou et al., 2000; Vandali et al., 2000). Unfortunately, there is not one rate that is best for all recipients, nor is there currently an objective method for predicting an optimal rate on an individual basis. Thus, some amount of trial and error is involved in finding an optimal rate. For adults, this procedure involves subjective preferences and/or formal speech-perception measures to compare programs with different rates. Young congenitally deafened children, on the other hand, cannot provide reliable subjective feedback and typically have not developed adequate speech and language skills to complete formal speech-perception testing as a comparative measure. As a result, this population is typically fit with strategies using software-default rates. An objective method for individually predicting an optimal stimulation rate would be advantageous. It is possible that differences in auditory-nerve temporal responses across individuals may contribute to performance differences across stimulation rates. The present study is the first in a series of experiments that examined whether the electrically evoked compound action potential (ECAP) can be used to objectively predict an optimal stimulation rate on an individual basis.
A few studies have evaluated temporal response properties of the human auditory nerve by examining ECAP amplitudes in response to individual pulses in a train (Hay-McCutcheon et al., 2005; Finley et al., 1997; Rubinstein et al., 1999; Wilson et al., 1997). With these measurements, the relative ECAP amplitude reflects the total number of fibers responding to each pulse.1 For very slow-rate pulse trains (on the order of 100–200 pps, per Wilson et al., 1997), ECAP amplitudes are typically similar across individual pulses, suggesting that the same population of fibers are depolarized and then fully recover following each pulse in the train. For faster pulse rates (approximately 400 pps to 1500 pps, per Wilson et al., 1997), an alternating response pattern appears, which reflects the variance in absolute and relative refractory recovery times across individual auditory nerve fibers (Finley et al., 1997; Rubinstein et al., 1999; Wilson et al., 1997). The overall ECAP amplitudes are reduced and the alternating pattern typically diminishes as the stimulation rate is increased further (2000–3000 pps, per Wilson et al., 1997; 5000 pps, per Miller et al., 2008) due to combined effects of refractory recovery, adaptation, and increased temporal jitter (e.g., Hay-McCutcheon et al., 2005; Mino & Rubinstein, 2006; Miller et al., 2008). This state represents stochastic independence among individual auditory nerve fibers (e.g., Rubinstein et al., 1999; Wilson et al., 1997; Litvak et al., 2003; Miller et al., 2008). Further, modeling data show increased temporal jitter for shorter inter-pulse intervals (i.e., faster-rate pulse trains; Mino & Rubinstein, 2006). Auditory neurons are presumably able to code information represented by faster rates of stimulation as a result of desynchronization of the whole-nerve response; that is, a sub-population of fibers is available to respond at any given point in time. The rate at which stochastic independence occurs is henceforth referred to as “stochastic rate.”
In adult CI recipients, Loizou et al. (2000) measured speech perception with the continuous interleaved sampling (CIS) strategy (Wilson et al., 1995) using per-channel stimulation rates ranging from 400–2100 pps/ch. All six subjects showed a clear point where performance increased to a plateau as a function of rate. These plateau points varied across subjects from 800 pps/ch to 2100 pps/ch. Although ECAP responses to pulse trains have not been studied across enough subjects to establish the cross-subject variability, the upper end of the plateau points for some subjects in the Loizou et al. (2000) study were consistent with rates that yielded a stochastic response in the ECAP measures reported by other investigators (i.e., Rubinstein et al., 1999; Wilson et al., 1997). This observation suggests that there may be a relation between speech perception performance and stochastic independence as measured with the ECAP.
Temporal response patterns, such as those obtained with the ECAP in response to pulse trains, have not been characterized across a large number of CI recipients. Wilson et al. (1997) reported that there appeared to be variability across subjects and electrodes, but no ranges or means were reported for the 10 subjects in that study. Thus, it is not clear the extent to which temporal response patterns differ across subjects or across electrodes within a subject. If temporal response properties influence performance as a function of stimulation rate, then it would be valuable to gain a better understanding of the variability in temporal response patterns within and across subjects. In the present study, ECAPs were measured in response to successive pulses in pulse trains of varying rates. The primary goal of this study was to characterize the variability in ECAP temporal response patterns across electrodes within a subject and across a relatively large group of subjects. Specifically, the following parameters were examined: (1) stochastic rate, (2) alternation depth and the rate at which maximum alternation occurred, and (3) the average normalized ECAP amplitude across the pulse train, which represents an overall metric of adaptation and desynchronization. It was hypothesized that stochastic rates would vary substantially within and across subjects, likely reflecting differences in neural survival and specific response properties of those neurons. Further, we expected that the maximum alternation would occur at a rate slower than the stochastic rate. Finally, it was hypothesized that the overall amount of adaptation and desynchronization would increase with pulse rate.
2. Materials and methods
2.1. Subjects
Forty-two adult and pediatric subjects were initially enrolled for this study. All enrollees signed an informed consent. Due to current-level limitations for pulse-train stimuli (described further in section 2.4.), measurable ECAPs could not be obtained for 16 subjects. Data were subsequently collected for 29 ears in 26 subjects (10 males, 16 females): N=2 ears with Advanced Bionics CII (Advanced Bionics, Sylmar, CA, USA), N=8 ears with Advanced Bionics HiRes 90K, N=6 ears with Nucleus 24R(CS) (Cochlear Ltd., Macquarie, NSW, Australia), N=9 ears with Nucleus 24RE(CA) Freedom, and N=4 ears with Nucleus CI512. Data were collected for both ears in three subjects who were bilaterally implanted, designated in Table 1 as F1/R3, F5/R4, and F8/R2 (subject numbers are ear-specific, based on device type). Age at implant ranged from 7 years, 11 months to 82 years (mean: 44 years). Duration of implant use at the time of participation ranged from 3 months to 12.5 years (mean: 3.5 years). All subjects had full insertions. Additional demographic information is listed in Table 1.
Table 1.
Demographic information for participating subjects. Paired symbols indicate right and left ears from the same subject.
| Subject | Gender | Internal Device and Electrode Array | Ear | Duration Deafness (yrs) | Etiology | Age at CI (yrs, mos) | Duration CI Use (yrs, mos) | Tested Electrodes (Basal, Middle, Apical) |
|---|---|---|---|---|---|---|---|---|
| R2 | M | Nucleus 24R(CS) | R* | 3 | Noise induced, hereditary | 52, 0 | 6, 0 | 3, 11, 20 |
| R3 | F | Nucleus 24R(CS) | R† | 50 | Unknown | 56, 1 | 6, 7 | 3, 11, 17 |
| R4 | M | Nucleus 24R(CS) | L^ | 1 | Unknown | 41, 11 | 6, 3 | 5, 11, 20 |
| R6 | F | Nucleus 24R(CS) | R | 6 | Autoimmune disease | 44, 4 | 12, 5 | 7, 11, 20 |
| R7 | M | Nucleus 24R(CS) | R | 5 | Unknown, progressive | 62, 2 | 4, 3 | 5, 11, 20 |
| R10 | M | Nucleus 24R(CS) | R | 2 | Unknown, progressive | 61, 10 | 6, 2 | 3, 11, 19 |
| F1 | F | Nucleus 24RE(CA) | L† | 54 | Unknown | 60, 7 | 2, 2 | 3, 11, 20 |
| F2 | F | Nucleus 24RE(CA) | R | 10 | Unknown | 60, 2 | 1, 1 | 5, 11, 20 |
| F4 | F | Nucleus 24RE(CA) | L | 17 | Ototoxicity | 17, 6 | 1, 5 | 3, 11, 20 |
| F5 | M | Nucleus 24RE(CA) | R^ | 7 | Unknown | 48, 3 | 0, 6 | 3, 11, 20 |
| F7 | M | Nucleus 24RE(CA) | R | 28 | Unknown | 39, 1 | 2, 3 | 3, 11, 20 |
| F8 | M | Nucleus 24RE(CA) | L* | 9 | Noise induced, hereditary | 58, 3 | 0, 4 | 3, 11, 20 |
| F10 | F | Nucleus 24RE(CA) | R | 8 | Waardenburg syndrome | 8, 3 | 4, 6 | 3, 11, 20 |
| F12 | M | Nucleus 24RE(CA) | R | 4 | Unknown, progressive | 82, 0 | 1, 3 | 3, 11, 20 |
| F14 | F | Nucleus 24RE (CA) | L | 7 | Unknown, progressive | 14, 6 | 4, 5 | 5, 11, 20 |
| N2 | M | Nucleus CI512 | R | 5 | Usher syndrome | 68, 3 | 0, 3 | 5, 11, 20 |
| N3 | F | Nucleus CI512 | R | 2 | Congenital, genetic | 29, 1 | 0, 8 | 3, 14, 20 |
| N4 | F | Nucleus CI512 | R | 0.5 | Unknown | 13, 4 | 0, 10 | 5, 11, 20 |
| N5 | F | Nucleus CI512 | R | 1 | Sudden SNHL | 50, 9 | 0, 4 | 5, 11, 20 |
| C17 | F | HiRes 90K HF 1J | R | 5 | Unknown | 7, 11 | 3, 6 | 14, 9, 1 |
| C18 | F | HiRes 90K HF 1J | R | 34 | Sudden SNHL | 36, 8 | 2, 3 | 14, 8, 5 |
| C19 | M | HiRes 90K HF 1J | R | 0.3 | Sudden from established SNHL | 15, 5 | 5, 6 | 15, 8, 1 |
| C24 | F | Clarion CII HF 1 + p | R | 15 | Unknown, progressive | 67, 4 | 8, 9 | 14, 8, NR |
| C26 | F | HiRes 90K HF 1J | R | 54 | Unknown | 67, 6 | 2, 1 | 14, 8, 1 |
| C29 | F | HiRes 90K HF 1J | R | 21 | Meningitis | 31, 0 | 2, 6 | 14, 8, 1 |
| C30 | F | Clarion CII HF 1 + p | L | 4 | Unknown, progressive | 52, 0 | 8, 0 | 14, 8, 1 |
| C31 | M | HiRes 90K HF 1J | L | 7 | Unknown, progressive | 24, 1 | 3, 6 | 14, 8, 5 |
| C33 | M | HiRes 90K HF 1J | R | 34 | Genetic | 36, 0 | 1, 6 | 14, 10, 1 |
| C39 | F | HiRes 90K HF 1J | L | 0.5 | Unknown | 63, 0 | 2, 6 | 14, 8, 1 |
SNHL = sensorineural hearing loss; NR = no response; +p = electrode array with positioner; M = male; F = female.
2.2. Equipment setup
For subjects with Cochlear devices, ECAPs were measured using the Advanced Neural Response Telemetry (NRT) feature within the Custom Sound EP commercial software (Cochlear Ltd., Macquarie, NSW, Australia) via a Freedom speech processor interfaced with a programming Pod. For subjects with Advanced Bionics devices, ECAPs were measured with the Bionic Ear Data Collection System (BEDCS), which is an experimental research platform (Advanced Bionics Corp., Sylmar, CA). ECAP measures were obtained with a Platinum Series Processor interfaced with a Clinical Programming Interface (CPI II).
2.3. Stimuli
ECAPs were measured in response to each of 21 pulses in a pulse train. Pulse train stimuli were cathodic-leading, charge-balanced, biphasic current pulses presented in monopolar mode at five different rates: 900, 1200, 1800, 2400, and 3500 pps. Pulse width was 25 μsec/phase for Cochlear and 21.55 μsec/phase for Advanced Bionics devices. For subjects with the Nucleus 24R(CS) and Nucleus 24RE/CI512 devices, the software defaults for interphase gap were used, which were 25 and 7 μsec, respectively. There was no interphase gap for Advanced Bionics devices.
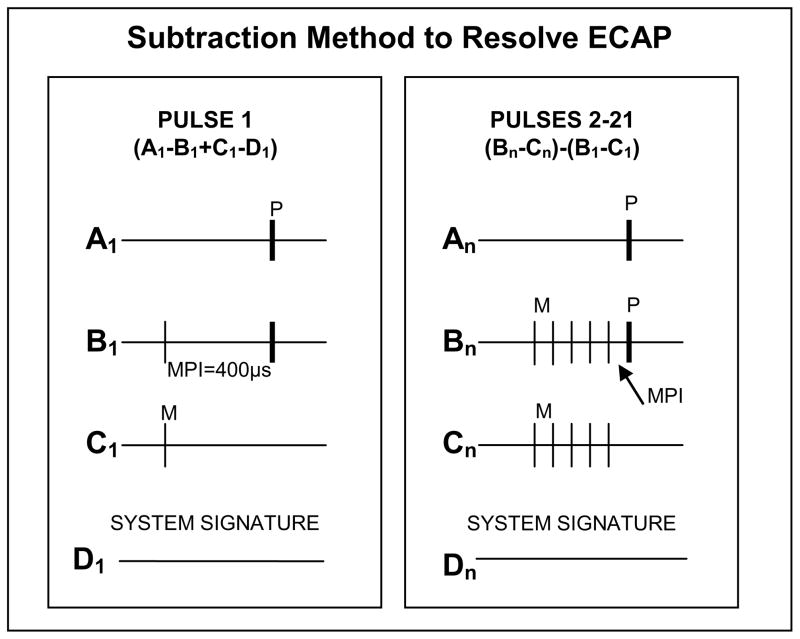
ECAPs were separated from the stimulus artifact using a modified forward masking technique described by Hay-McCutcheon et al. (2005). This process is illustrated in Fig. 1. To resolve the response to the first pulse in the train, the standard forward-masking technique (e.g., Abbas et al., 1999) was applied, using a single masker with a masker-probe interval (MPI) of 400 μsec (A1−B1+C1−D1; Fig. 1, left panel). Four steps were used to resolve the ECAP response for pulses 2–21. First, a template of the probe artifact was isolated by subtracting trace C1 from trace B1. Second, the MPI was set to equal the period of the pulse-train rate (e.g., 286 μsec for a 3500-pps train) so that the probe served as the last pulse in each pulse train (masker and probe amplitudes were equal; see Fig. 1, right panel, trace Bn). To remove the stimulus artifact and neural responses to all but the last pulse (probe), the masker(s)-alone trace was subtracted from the masker(s)-plus-probe trace (Bn−Cn). Last, the probe artifact template (B1−C1) was subtracted from Bn−Cn, where n represents the total number of pulses in the pulse train. The number of maskers was increased by one after each waveform was obtained, until 21 pulses were presented (20 maskers and one probe). For each participant, the presentation order for pulse-train rate and test electrode were pseudo-randomized to avoid introducing additional adaptation effects on a single electrode.
Fig. 1.
Schematic illustrating the subtraction method used to resolve the ECAP. Left panel: traditional forward-masking technique, used to resolve the response to the first pulse in the train. Right panel: modified forward-masking technique, used to resolve the responses to pulses 2–21 (number of pulses indicated by subscript n). MPI = masker-probe interval. In both panels, A = probe alone, B = masker plus probe, C = masker alone, D = zero-amplitude pulse for system artifact. Probe pulses are indicated in bold and labeled “P”; masker pulses are thinner lines labeled “M.”
For Cochlear recipients, the probe repetition rate was reduced to 35 Hz to accommodate 20 maskers (software default is 80 Hz). For Advanced Bionics recipients, the repetition rate was approximately 1 Hz. These were the fastest repetition rates for the present stimuli that could be used for each respective device. Software defaults for gain were used (50 dB for N24RE and CI512, 60 dB for N24R(CS), 1000 [linear multiplier] for Advanced Bionics). The recording electrode was typically located two positions apical to the stimulating electrode (monopolar recording). Recording delay was optimized individually for Cochlear recipients (this parameter is not applicable in BEDCS for Advanced Bionics recipients). For all subjects, 50–100 sweeps were averaged to resolve the ECAP. Measures were made for an apical, middle, and basal electrode for each subject (one exception was for subject C24, for whom no ECAP responses could be obtained on an apical electrode; see Table 1). Electrode impedances were measured for all subjects prior to data collection. Abnormally functioning electrodes were not used for stimulation or recording in this study.
2.4. Procedures
Because stimulus level has been shown to strongly affect ECAP temporal response patterns (e.g., Finley et al., 1997; Miller et al., 2008), it was important to use the same current level to measure ECAPs for all five rates on a given electrode. Temporal integration varies with stimulation rate (i.e., faster rates sound louder than slower rates) and pulse duration (i.e., 21 pulses will sound louder than 1), so stimulus levels were determined based on loudness judgments for the longest pulse train at the fastest rate. The behavioral dynamic range was measured for each electrode using a 3500-pps train of 21 pulses (20 maskers and 1 probe), which represents the maximum amount of current across all stimuli used. For Cochlear recipients, the “stimulate only” mode in NRT was used to present the pulse-train stimuli in an ascending manner using 5-CL2 steps. For Advanced Bionics recipients, BEDCS was used to present the pulse-train stimuli in an ascending logarithmic manner using similar increments (as in Hughes & Stille, 2009). Participants used a visual rating scale to indicate when the sound was first heard (rating of 1 on a scale of 1 to 10, where 10 was too loud) and when the sound was loud but comfortable (rating of 8). For each electrode, ECAPs were measured using the same masker/probe current level for all five rates. Because stimulus levels were determined using a fast-rate pulse train, the maximum stimulus levels used were lower than that typically used to obtain traditional ECAPs (i.e., a single masker and probe). ECAP thresholds typically fall in the upper half of the dynamic range for the traditional stimulus used to elicit the ECAP (Potts et al., 2007), and may approximate or exceed the behavioral upper loudness limit for faster-rate pulse trains (e.g., Potts et al., 2007; Holstad et al., 2009). These limitations precluded participation in the study for roughly one-third of the subjects who were initially enrolled, because measurable ECAPs could not be obtained with these lower current levels.
2.5. Data analysis
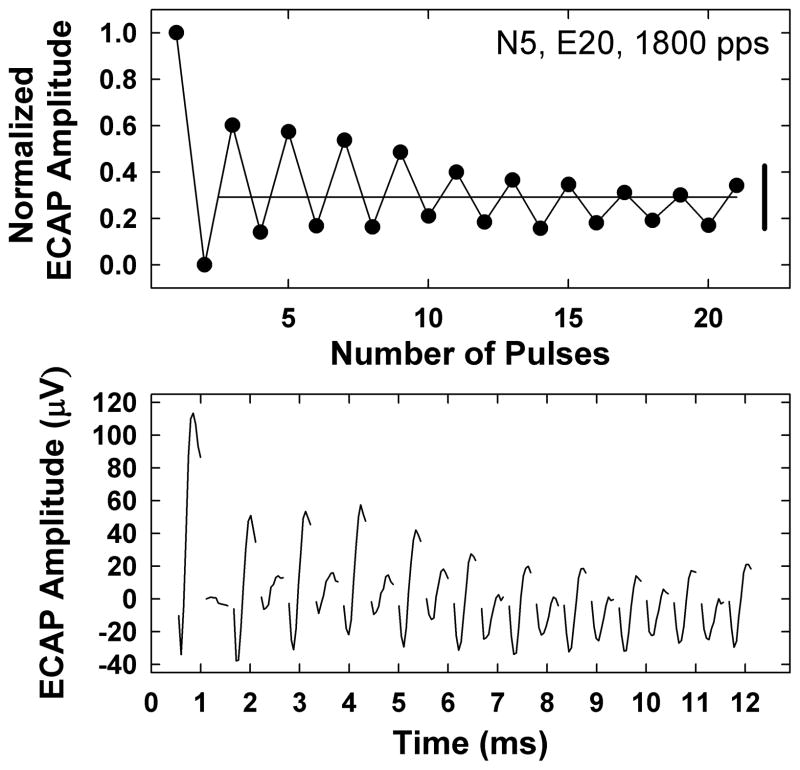
ECAP traces were read into a custom program written in Matlab (Mathworks, Inc., Natick, MA), which applied the subtraction methods described above (Fig. 1). N1 and P2 peaks were manually marked and peak-peak amplitudes were calculated. For each set of 21 pulses, ECAP amplitudes were normalized to (i.e., divided by) the amplitude obtained for the first pulse in the train. This was done so that relative amplitude changes across the pulse train could be assessed and compared across electrodes and subjects. An example is shown in the top panel of Fig. 2 for an 1800-pps pulse train delivered to electrode 20 (E20) for subject N5. The bottom panel shows the corresponding waveforms (for clarity, only the first 10 samples of each trace have been plotted). The amplitude for the first pulse should be the largest, as it presumably reflects the contribution of all fibers recruited by the electrode at a fixed stimulus level.
Fig. 2.
Top: Individual example illustrating how alternation depth (vertical bolded solid line at right) and average normalized ECAP amplitude across pulses 2–21 (horizontal light solid line) were calculated. Data are from subject N5, electrode 20, for an 1800-pps pulse train. Bottom: Corresponding ECAP waveforms for the data in the top panel. For clarity, only the first 10 samples of each trace are shown.
To determine stochastic rate, the normalized amplitudes for even-numbered pulses were compared with those for odd-numbered pulses (excluding the normalization point of 1.0) using a paired t-test. The rate that yielded no statistically significant difference (p > 0.05) was taken as the stochastic rate for that electrode. The alternation depth was calculated as the average normalized amplitude of the odd-numbered pulses minus the average normalized amplitude of the even-numbered pulses, excluding the normalization point (Fig. 2, vertical bold solid line at right). Finally, the average normalized ECAP amplitude across pulses 2–21 was calculated, which represents an overall metric of adaptation and/or desynchronization of individual fibers (Fig. 2, horizontal light solid line).
3. Results and discussion
3.1. Individual examples
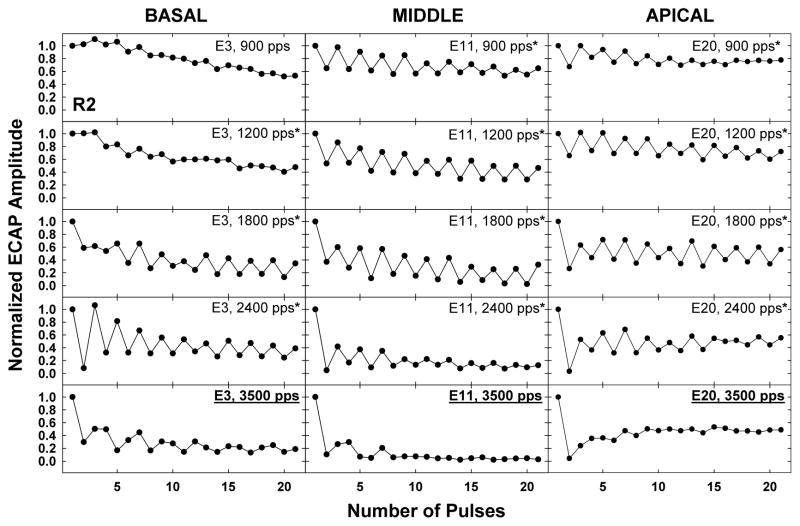
Figure 3 shows an example of normalized ECAP amplitudes as a function of pulse number for all five rates (top row: 900 pps, bottom row: 3500 pps) across the three electrodes tested (columns) for subject R2. Rates with a statistically significant alternating pattern are indicated with an asterisk next to the label in the top right corner of each graph. Stochastic rate for each electrode is indicated by the underlined label in bold text on the respective graph in each column. For this subject, stochastic rates were 3500 pps for all three electrodes. Note that for the basal electrode (E3), the alternating pattern was not pronounced for the slowest rates (900 and 1200 pps), whereas greater alternation was present for the middle (E11) and apical (E20) electrodes at the same rates. The rate that yielded the greatest alternation depth was 2400 pps for E3 and 1800 pps for both E11 and E20. Despite these differences, all three electrodes had the same stochastic rate, which suggests some independence between alternation depth and stochastic rate. It may be that the alternation depth is influenced more by refractory recovery properties of the underlying neural population (see section 3.3), whereas stochastic rate is influenced more by other response properties (e.g., temporal jitter, spontaneous rate). Another notable difference across electrodes for subject R2 was the overall gradient of the functions. This difference was most pronounced for the basal and apical electrodes at the slower rates: E3 exhibited an overall adaptation (i.e., decreasing amplitude) across the pulse train, whereas E20 exhibited an alternating pattern with consistent average amplitude over the course of the pulse train.
Fig. 3.
Individual example of temporal response patterns for five rates (top row: 900 pps, bottom row: 3500 pps) across basal (left), middle (middle), and apical (right) cochlear regions. In each panel, ECAP amplitudes were normalized to the amplitude for the first pulse in the train, and are plotted as a function of number of pulses. Data are from subject R2. For each electrode, the stochastic rate (rate at which the alternation was no longer statistically significant) is underlined and bolded.
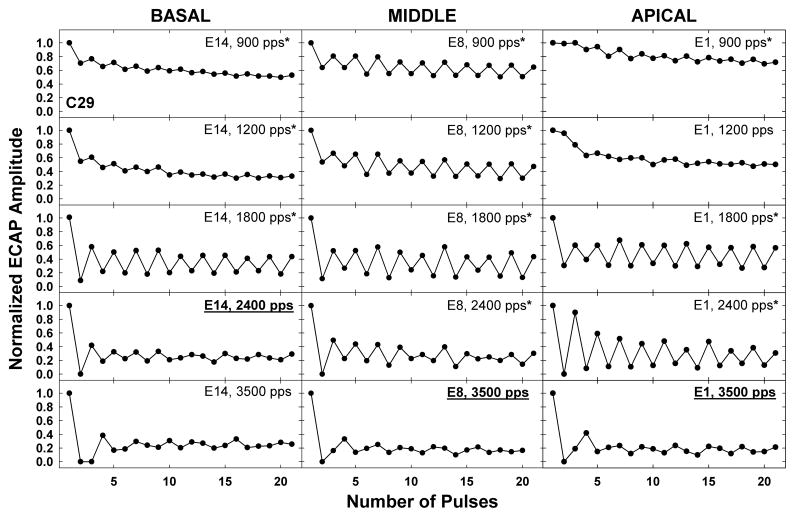
Another individual example is shown in Fig. 4 for subject C29; data are plotted as in Fig. 3. This example shows relatively flat patterns for the basal (E14) and apical (E1) electrodes for 900 and 1200 pps, in contrast with a more pronounced alternation for the middle electrode (E8). Despite the basal and apical electrodes exhibiting similar patterns at slower rates, each electrode had a different stochastic rate (2400 pps for E14 and 3500 pps for E1) and the maximum alternation occurred at different rates (1800 pps for E14 and 2400 pps for E1). This subject also exhibited an unexpected triplet pattern at 3500 pps, where the amplitude pattern generally repeated itself following every third pulse (e.g., E8, pulses 2–4, 5–7, 8–10, 11–13, 14–16).
Fig. 4.
Individual example of temporal response patterns for five rates across basal, middle, and apical cochlear regions for subject C29. Data are plotted as in Fig. 3.
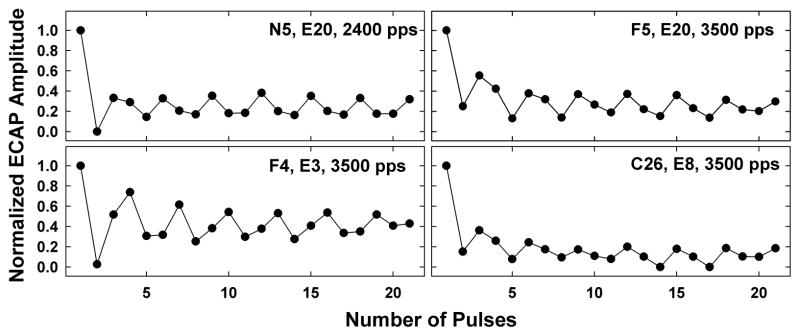
Figure 5 shows examples from four additional subjects that exhibited the triplet pattern shown in Fig. 4 for 3500 pps. For all four examples, the pattern was observed at the stochastic rate. This pattern was qualitatively observed for 21 electrodes (two rates for one electrode, for a total of 22 occurrences) across 15 subjects, and always occurred at a rate that was either equal to (N=18) or greater than (N=4) the stochastic rate. The pattern occurred most often for basal electrodes (N=10), and equally as often for middle and apical electrodes (N=6 for each). For subject N5, the pattern repeated itself after every third pulse for 2400 pps (Fig. 5, top left panel), and for 3500 pps (data not shown), the pattern repeated itself after every fourth pulse. These results suggest a more complex repeated pattern that may be consistent with further desynchronization that parcels the underlying neural population into distinct sub-groups based on individual-fiber refractory-recovery time constants, and/or integration across pulses for faster rates (Zhang et al., 2007). Recall that the ECAP is a population response, which therefore reflects the number of surviving auditory neurons in a stimulated cochlear region, as well as the specific properties of each (i.e., fiber threshold, dynamic range, temporal jitter, high or low spontaneous rate). Single-fiber studies have shown relatively large variation in fiber and node diameters across neurons (Arneson & Osen, 1978; Liberman, 1980). Both of these variables can affect firing threshold, speed of action-potential propagation, overall fiber excitability, and adaptation (e.g., Rhode & Smith, 1985; Muller & Robertson, 1991). Other factors that can influence fiber excitability, temporal jitter, or adaptation include the site of spike initiation, distance between the electrode and stimulated neural population, and stimulation rate (Frijns et al., 1996; Javel & Shepherd, 2000; Mino et al., 2004; Mino & Rubinstein, 2006; Woo et al., 2010). Differences in electrode placement, nerve survival patterns, and fiber-specific properties of the surviving neural population (i.e., different distributions of high- or low-spontaneous rate fibers) are likely explanations for why the more complex patterns were not observed in all cases.
Fig. 5.
Individual examples of triplet amplitude pattern. Each graph represents data from a different subject. Subject number, electrode, and rate are indicated on each graph.
The relative independence between alternation depth, stochastic rate, and adaptation across electrodes is also likely due to the variability in the number and type of surviving neurons across the cochlea. Different fiber types will have different thresholds, temporal jitter, refractory time constants, and susceptibility to adaptation (e.g., Matsuoka et al., 2001; Zhang et al., 2007; Woo et al., 2010). For example, high-spontaneous-rate fibers typically have larger axons, lower thresholds, and less susceptibility to adaptation than low-spontaneous-rate fibers (e.g., Ranck, 1975; Liberman, 1982; Rattay, 1986). Further, larger neural populations in specific cochlear regions will yield higher overall ECAP amplitudes. Different combinations of specific fiber characteristics across the cochlea, as well as differences in current level (Finley et al., 1997), likely lead to different combinations of alternation depth, stochastic state, and adaptation patterns across electrodes, as seen in Figs. 3 and 4.
3.2. Variability across electrodes and subjects
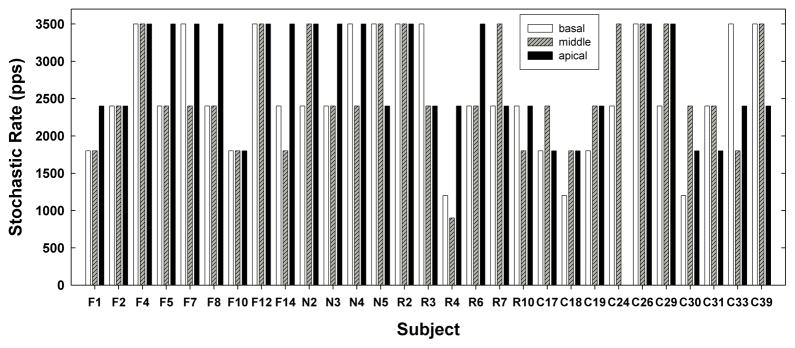
The primary goal of this study was to characterize the variability in ECAP temporal response patterns across electrodes within a subject and across a relatively large group of subjects. Figure 6 shows the variation in stochastic rates across electrodes and subjects. Each grouping represents data for a basal (white bar), middle (striped bar), and apical (black bar) electrode for each subject. Subject numbers are labeled along the x-axis. Across subjects, stochastic rates spanned the full range tested (900–3500 pps). The majority of subjects (23 of 29 ears, or 79%) had different stochastic rates across cochlear regions. The difference in stochastic rates across the cochlea varied more for some subjects than for others. Subjects R4, C33, and F14 exhibited the greatest range in stochastic rates across cochlear regions: for R4 the range was 900 pps (middle electrode) to 2400 pps (apical electrode) and for F14 and C33, the range was 1800 (middle electrode) to 3500 pps (apical and basal electrode, respectively). These three subjects differed widely in duration of deafness (range: 1–34 years), etiology (progressive, genetic), and age (14–41 years; see Table 1), which are all factors known to significantly affect nerve survival (see Ng et al., 2000).
Fig. 6.
Bar graph illustrating the range in stochastic rates across electrodes and subjects. Data from basal (white bars), middle (striped bars), and apical (black bars) electrodes are shown for each subject. Subject C24 had no measurable ECAP responses for an apical electrode.
As Table 1 shows, data were collected for subjects with different manufacturers’ devices. The per-channel stimulation rates for subjects’ daily-use programs ranged from 250 pps to 1200 pps for Cochlear recipients and 1289 pps to 5156 pps for Advanced Bionics recipients. Given these large differences in stimulation rate between manufacturers, it was worthwhile to determine whether long-term use of faster- or slower-rate stimulation had an effect on stochastic rate. In addition, there were differences in the stimulus presentation rate between manufacturers (35 Hz for Cochlear, 1 Hz for AB), which may have affected stochastic rate. A two-way analysis of variance was used to assess the effect of device type (Cochlear, Advanced Bionics) and cochlear region (basal, middle, apical) on stochastic rate. Results showed no significant effect of region (F = 0.35, p = 0.71), device (F = 2.33, p = 0.13), or region-device interaction (F = 1.99, p = 0.14). In sum, the distribution of stochastic rates did not vary significantly across cochlear region, or between device manufacturers.
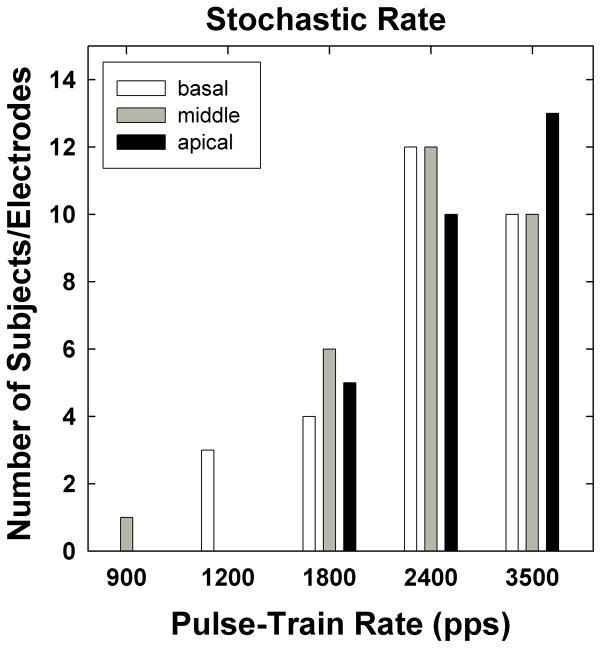
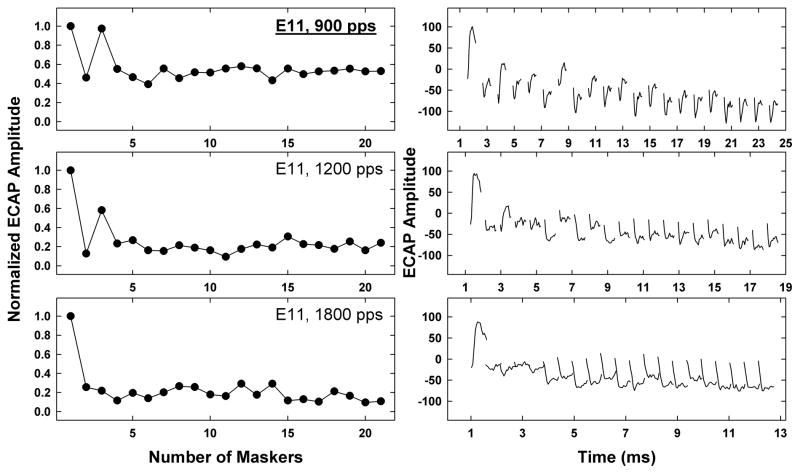
Figure 7 shows a histogram of stochastic rates for the three cochlear regions. The height of each bar indicates the number of subjects/electrodes for each stochastic rate as a function of cochlear region. The stochastic rate occurred most frequently at 2400 pps for basal (white bars) and middle (gray bars) electrodes, and at 3500 pps for apical (black bars) electrodes. These results are generally consistent with the individual data from humans reported by Wilson et al. (1997). Only three basal electrodes yielded a stochastic rate of 1200 pps (subjects R4, C18, C30). Subject R4 demonstrated no statistically significant alternating patterns at any of the rates tested for E11; therefore, 900 pps was designated as the stochastic rate. For this single case, it appears that the measurement of stochastic rate was limited by the subject’s upper loudness comfort limits in relation to ECAP thresholds. The ECAP amplitudes for 900 pps were ~100 μV for the first and third pulses and ~50 μV for all remaining pulses; alternation was only evident for the first four pulses (Figure 8). For 1200 pps, ECAP amplitudes for the first and third pulses were ~100 μV and 60 μV, respectively, while all remaining amplitudes hovered around the noise floor (~20 μV for this device). For the remaining rates (1800–3500 pps), ECAP amplitudes for pulses 2–21 were near the noise floor, making it difficult to resolve potential alternating patterns.
Fig. 7.
Histogram of stochastic rates for each electrode region, as a function of pulse-train rate. Data are from all electrodes/subjects tested.
Fig. 8.
Left: Normalized ECAP amplitudes as a function of pulse number for Subject R4, electrode 11. Each panel represents a different rate: 900 pps (top), 1200 pps (middle), and 1800 pps (bottom). Right: Corresponding ECAP waveforms for the plots on the left. Data for the two fastest rates (2400 pps and 3500 pps) were similar to the plots shown for 1800 pps.
It was of interest to examine the effect of current level on stochastic rate based on results from Finley et al. (1997), who showed greater suppression (relative to the first pulse) for lower current levels and greater adaptation over the course of the train for higher current levels (see also Miller et al., 2008). Stimulus levels were correlated with stochastic rate for Advanced Bionics and Cochlear recipients (each group separately, due to differences in current units). Results showed significant correlations between stimulus level and stochastic rate, where faster stochastic rates tended to occur with higher stimulation levels (r = 0.57, p = 0.001, N = 29 for Advanced Bionics and r = 0.38, p = 0.004 for Cochlear, N = 57; Spearman rank correlation for non-normal distribution of data). These results are consistent with (1) greater synchrony for high stimulus levels resulting in stronger locking to individual pulses (Miller et al., 2008), which effectively results in the stochastic state occurring for faster-rate pulse trains; and (2) greater variation in amplitudes and changes in the alternating pattern across the pulse train for low stimulus levels, as reported by Finley et al. (1997), which effectively results in the stochastic state occurring at slower rates. This was likely the issue for E11 in subject R4 (Figure 8). The extent to which stochastic rate changes with stimulus level within subjects is not entirely clear, and is a topic that warrants further investigation.
It is also not clear how differences in stochastic rates across the cochlea might relate to performance with the device. ECAP stochastic rates in the present study spanned from 900 pps to 3500 pps, which is consistent with stochastic rates reported by other investigators (i.e., Rubinstein et al., 1999; Wilson et al., 1997), and with rates yielding a plateau in speech-perception performance (800–2100 pps; Loizou et al., 2000). Although the majority of the stochastic rates in the present study (2400–3500 pps) are consistent with or exceed the upper range of rates investigated by Loizou et al. (2000), this difference may be due to the relatively small sample size in that study (six subjects) and possible differences in stimulus levels used for speech processing versus ECAP data collection. Recall that the stimulus levels for the present study were based on a pulse train of approximately 6 ms (21 pulses at 3500 pps), which would yield higher current levels for equal loudness relative to the traditional 500-ms pulse train used for programming the speech processor. Because slower stochastic rates tend to occur for lower stimulus levels, we would likely see stochastic rates more similar to the rates that yielded plateaus in performance in the Loizou et al. study if similar (lower) levels were used for ECAP data collection.
A number of studies have shown relationships between perceptual temporal processing and speech perception (e.g., Fu, 2002; Luo et al., 2008; Sagi et al., 2009). If temporal inputs from the auditory nerve are the basis for perceptual temporal processing, then the results from the present study may have implications for changes to future speech-processing strategies. Current speech processors only employ a single per-channel rate for all electrodes, with the exception of MED-EL’s Fine Structure Processing (FSP) strategy. With FSP, the per-channel rate is varied on the most apical 2–3 channels to represent the positive-going zero-crossings (or fine structure) within the respective bandpass filter(s) (Hochmair et al., 2006). In any case, it may be beneficial to employ per-channel stimulation rates that vary independently across the entire array to best exploit the temporal response properties of local neural populations. Given the performance plateaus as a function of rate reported by Loizou et al. (2000), one argument may be to simply use the fastest stimulation rate available for a given processor, which would ensure that all auditory-nerve fibers would be driven at the stochastic rate with no detriment to performance. The flaws with this argument, however, are that sustained, long-term stimulation with high rates can produce long-term threshold shifts in auditory nerve fibers (Tykocinski et al., 1995; Litvak et al., 2003). In addition, faster-rate strategies will reduce battery life for the processor. It therefore seems prudent to investigate ways to optimize (but not exceed) stochastic rate on an individual-electrode basis. Although the present study did not include measures of speech perception, future experiments are underway that will further examine these relationships.
3.3. Alternation across rates
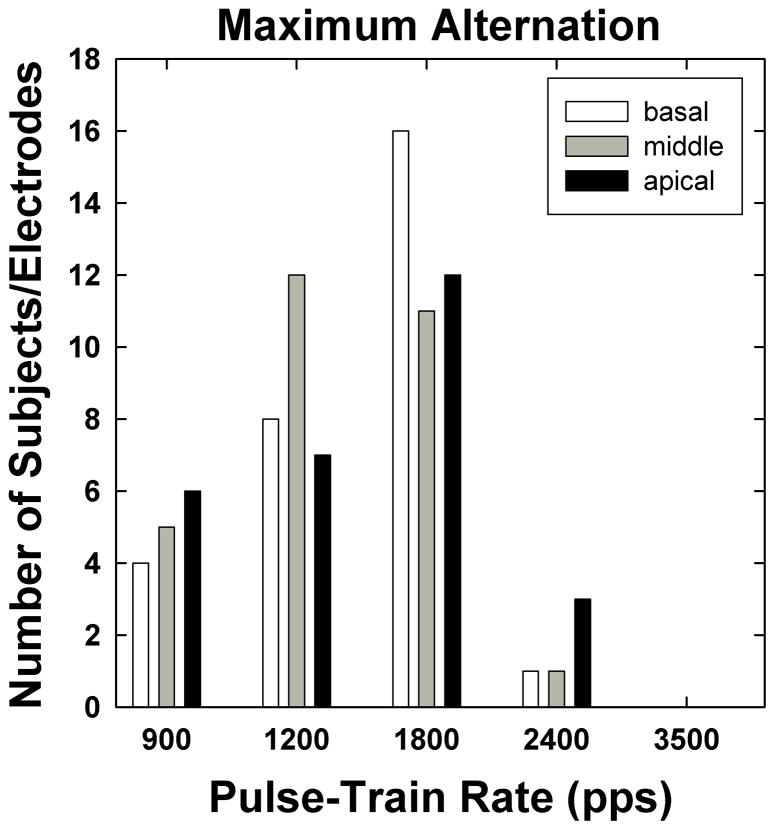
Figure 9 shows a histogram of rates at which the maximum alternation occurred. Data are plotted as in Fig. 7. The maximum alternation (i.e., largest alternation depth) occurred most often at 1800 pps for basal and apical electrodes, and at 1200 pps for middle electrodes. In no case did the maximum alternation occur at 3500 pps for the present subject group; this was expected because the majority of stochastic rates (which, by definition, was the rate at which the alternation ceased) were 2400 pps and 3500 pps (see Fig. 7). On average, the maximum alternation depth spanned a range of 19% of the amplitude of the response to the first pulse in the train (i.e., the mean difference between odd- and even-numbered pulses was 0.19 normalized amplitude).
Fig. 9.
Histogram of rates at which maximum alternation occurred for each electrode region, as a function of pulse-train rate. Data are from all electrodes/subjects tested.
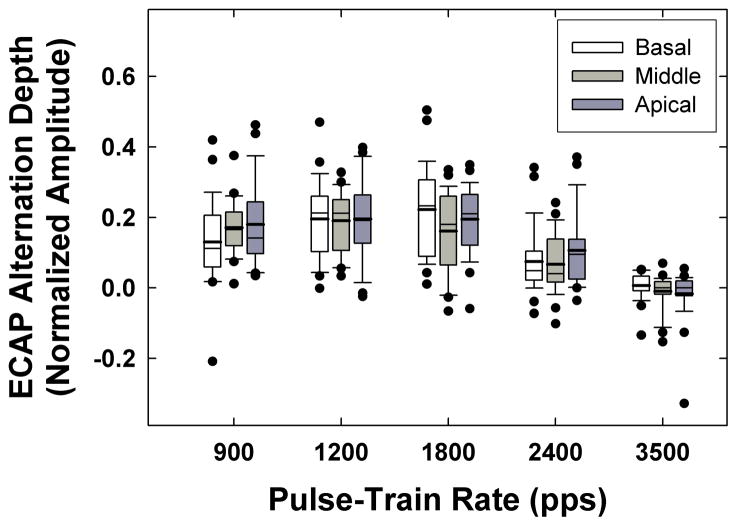
Figure 10 depicts box-and-whisker plots showing the range of alternation depth (which reflects the variance in refractory-recovery times across fibers) across all subjects and electrodes for each pulse-train rate. The boxes represent the 25th and 75th percentiles, the whiskers represent the 10th and 90th percentiles, and the filled circles represent outliers. Means and medians are represented by thick and thin horizontal lines, respectively. In general, the alternation depth increased slightly from 900 pps to 1200 pps, then decreased as the rate increased to 3500 pps. The mean alternation depth across all electrodes was 0.160, 0.194, 0.192, 0.082, and −0.007 normalized amplitude for 900, 1200, 1800, 2400, and 3500 pps, respectively. Taken together with the results from Fig. 9, these data suggest that the maximum alternation occurred most frequently for 1800 pps, but when it occurred for 1200 pps, the alternation depth was larger.
Fig. 10.
Box-and-whisker plots showing average alternation depth across pulses 2–21 (odd-numbered pulses minus even-numbered pulses) for each rate and electrode region. Each grouping of three plots represents data for basal (left/white bars), middle (middle/light gray bars), and apical (right/dark gray bars) electrodes. Boxes represent the 25th and 75th percentiles, whiskers represent the 10th and 90th percentiles, and filled circles represent outliers. Means and medians are represented by thick and thin horizontal lines, respectively.
If we consider that the absolute refractory period (time period when an action potential is not possible) of the auditory nerve is approximately 300–400 μsec (Miller et al., 2001; Morsnowski et al., 2006), then we would expect limited alternation for rates beyond 2500–3333 pps, which is consistent with the present findings. The periods of the 1200-pps and 1800-pps pulse trains (rates producing maximum alternation) were 833 μs and 556 μs, respectively, which fall within the known relative refractory period (time period of reduced excitability) of the auditory nerve (Miller et al., 2001; Morsnowski et al., 2006; Botros & Psarros, 2010). Stimulation rates within this range will be most likely to produce alternating ECAP patterns.
To further assess refractory effects, we calculated the absolute refractory period and the refractory-recovery time constant, τ (tau), from refractory-recovery functions that were collected for these subjects as part of another experiment (unpublished data). Refractory-recovery functions were assessed for MPIs ranging from 100 μsec – 10 ms for Cochlear recipients (software default) and 100 μsec – 4 ms for AB recipients (due to BEDCS limitations). Data were available for 57 of the 86 electrodes tested (N = 43 Cochlear, N = 14 AB). The absolute refractory period was taken as the MPI for the peak of the function, and ranged from 100 μsec to 900 μsec (mean: 499.5 μsec, SD: 148.9 μsec). Tau was calculated using the following formula:
where A is the ECAP amplitude, Amax is the maximum ECAP amplitude within the function, MPI is the corresponding masker-probe interval for amplitude A, t0 is the masker-probe interval for Amax (MPI for the peak of the function), and C is a correction for residual masking (i.e., the amplitude at the longest MPI). Overall, tau values ranged from 410.5 μsec to 1884.0 μsec, which should represent the relative refractory period. These time constants correspond to stimulation rates of approximately 531 pps to 2436 pps, which is a range that should yield alternating amplitude patterns, consistent with the data in Figure 10. The mean time constants for basal, middle, and apical electrodes were 1032.4 μsec (SD = 350.7), 990.4 μsec (SD = 259.4), and 774.4 μsec (SD = 263.2), respectively. These results were consistent with the faster stochastic rates observed for apical electrodes (Fig. 7), and may be the result of greater nerve survival or a more heterogeneous population of fibers in the apical region.
Table 2 lists the mean refractory-recovery time constants for electrodes with stochastic rates ranging from 900–3500 pps (top section), and for electrodes with the rate of maximum alternation ranging from 900–2400 pps (bottom section). Standard deviations (SD), the range of tau values, and number of electrodes included for each rate are also shown. A one-way analysis of variance (Kruskal-Wallis, on ranks due to non-normal distribution) revealed no significant differences in recovery time constants across electrodes with different stochastic rates (H = 2.54, df = 4, p = 0.64). Although there was a trend toward shorter refractory-recovery time constants for electrodes that demonstrated a maximum alternation at faster rates, this trend failed to reach statistical significance (H = 7.50, df = 3, p = 0.06). It should be noted that the refractory-recovery functions were obtained using masker/probe levels that were “loud but comfortable” (rating of 8), based on the single masker-probe stimulus used to elicit these measures. As a result, the current levels used for the refractory-recovery functions were typically higher than those used for the pulse-train data. Because refractory-recovery functions are level dependent (e.g., Finley et al., 1997), we are limited in what we can infer from comparing these data to the pulse-train data. Ideally, refractory-recovery functions should have been obtained using the same current levels used to obtain the pulse-train data. Because refractory recovery is generally slower for lower stimulus levels (Finley et al., 1997), we might expect slightly longer time constants for recovery functions obtained with the same (lower) stimulus levels used for the pulse-train data.
Table 2.
Mean refractory-recovery time constant (τ) with standard deviation (SD), range of time constants, and number of observations (N) for electrodes with stochastic rates ranging from 900–3500 pps (top) and rate of maximum alternation ranging from 900–2400 pps (bottom).
| Stochastic Rate
|
|||||
|---|---|---|---|---|---|
| 900 pps | 1200 pps | 1800 pps | 2400 pps | 3500 pps | |
| Mean τ SD | 929.5 (0) | 1126.6 (432.0) | 899.9 (239.4) | 988.0 (368.7) | 877.1 (273.0) |
| Range | -- | 821.1 – 1432.1 | 584.4 – 1349.8 | 410.5 – 1884.0 | 464.4 – 1389.0 |
| N | 1 | 2 | 7 | 22 | 25 |
| Rate of Maximum Alternation
|
|||||
|---|---|---|---|---|---|
| 900 pps | 1200 pps | 1800 pps | 2400 pps | 3500 pps | |
| Mean τ SD | 1068.9 (307.4) | 1026.2 (341.6) | 885.3 (277.2) | 706.1 (345.5) | N/A |
| Range | 737.4 – 1519.7 | 410.5 – 1622.2 | 501.5 – 1884.0 | 464.4 – 1218.7 | |
| N | 7 | 15 | 31 | 4 | |
N/A = not applicable.
Finally, the rate at which the maximum alternation occurred in the present study (1800 pps) contrasts with data from Wilson et al. (1997), which indicated that the maximum alternation depth occurred at approximately 1000 pps or less. This difference may have been due to differences in stimulus level between the two studies. Wilson et al. used current levels that produced most-comfortable levels with a 1016-pps, 50-msec duration pulse train, whereas the present study used loudness ratings based on 21 pulses of a 3500-pps train (6 ms duration). The shorter-duration signal used for loudness estimates in the present study may have yielded overall higher stimulus levels than in Wilson et al. Higher stimulus levels produce greater synchrony, and thus a higher probability that individual fibers will respond to each pulse in the train (yielding a relatively flat amplitude pattern across pulses). Thus, faster rates would be necessary for an alternating pattern to emerge for higher stimulus levels.
3.4. Desynchronization across rates
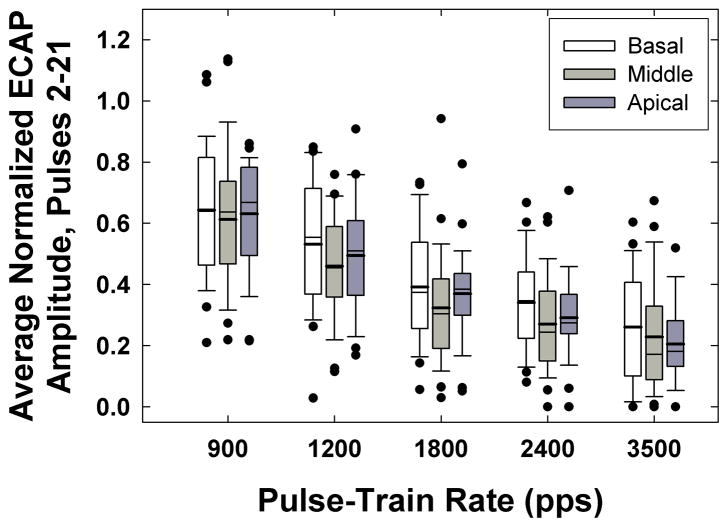
Figure 11 depicts box-and-whisker plots showing the normalized ECAP amplitudes averaged across pulses 2–21, which reflects the overall amount of desynchronization across the pulse train. Data are plotted as in Fig. 10. Because the ECAP amplitude for the first pulse represents the response from the entire population of neurons in a given region, reduced ECAP amplitudes for subsequent pulses (i.e., 2–21) should represent responses from a sub-population of fibers. In general, the normalized amplitude across the pulse train decreased as the rate increased. The amplitude decrease was not linear as a function of rate, but rather was best fit with a decaying exponential (note that in Fig. 11, rate is plotted on an interval scale, not a linear scale). The average normalized amplitudes across all electrodes were 0.63, 0.50, 0.36, 0.30, and 0.23 for 900, 1200, 1800, 2400, and 3500 pps, respectively. This means that at the fastest rate (3500 pps), on average, approximately 23% of the total population of fibers recruited by the first pulse produced a response to each subsequent pulse. These results are consistent with those reported by Wilson et al. (1997) and Rubinstein et al. (1999), and suggest that for faster stimulation rates, the whole-nerve response becomes desynchronized so that only a sub-population of fibers is available at any given time to code information from individual pulses.
Fig. 11.
Box-and-whisker plots showing average normalized ECAP amplitude across pulses 2–21 for each rate and electrode region. Data are plotted as in Fig. 9.
3.5. Robustness of ECAP measures
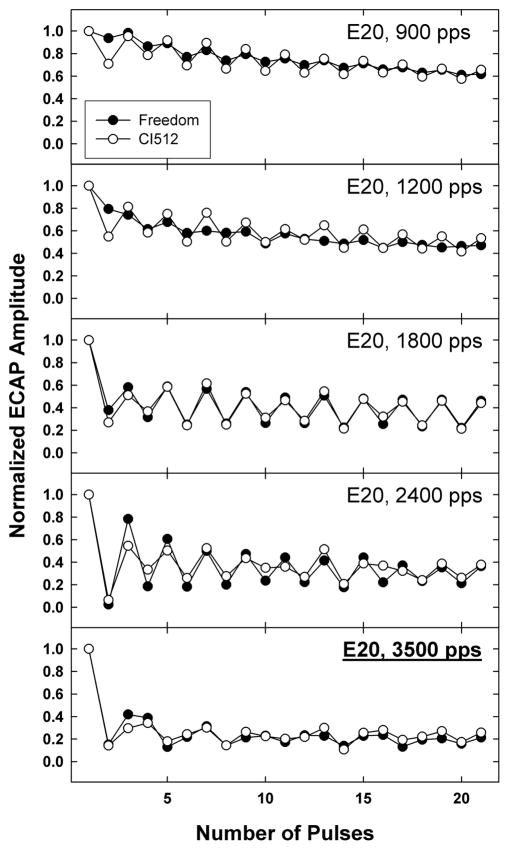
Figure 12 illustrates the robustness of the ECAP measures presented here. Several months after completing data collection for this study, subject F8 underwent explantation of his Nucleus 24RE Freedom device following unresolved intermittencies with device function. He was re-implanted with the newer-generation Nucleus CI512 device. ECAP measures were repeated for E20 with the new device (following approximately 12 months of use) to compare with the previous results obtained 17 months earlier. In general, the normalized ECAP amplitudes were very similar with both devices. Pearson correlation coefficients ranged from 0.79 (p < 0.0001) for 1200 pps to 0.98 (p < 0.0001) for 1800 pps. It should be noted that the stimulation levels were different between the two visits: 225 CL was used at the first visit with the Freedom device, whereas 200 CL was used with the CI512 device (these levels both corresponded to a loudness rating of “8” at the time of testing). There was slightly more alternation at the two slowest rates with the newer device, consistent with the lower stimulus level used (see Section 3.3). Despite these differences in alternation, both devices yielded the same stochastic rate (3500 pps). Both devices also produced the triplet pattern observed at 3500 pps. These results illustrate the robustness of the measures discussed here, in that similar responses were obtained for the same subject with two different devices (albeit similar electrode arrays) across a relatively long time interval.
Fig. 12.
Example of robustness of temporal response patterns pre and post re-implant. Data are for subject F8, electrode 20, across all five rates. Filled circles represent original recordings with a Nucleus Freedom device; open circles represent data obtained 17 months later following re-implantation with a Nucleus CI512 device.
3.6. Study limitations
One limitation for potential clinical applications of the present results is that ECAPs could not be measured for 38% (16 out of 42) of the subjects who were initially enrolled. When using the traditional single-masker stimulus, ECAPs can typically be recorded from approximately 95% of electrodes (van Dijk et al., 2007). For the pulse train stimuli used in the present study, loudness summation across the 3500-pps pulse train necessitated the use of lower current levels. Therefore, subjects had to have relatively large ECAPs to begin with (re: single-masker stimulus). However, the patterns tended to emerge within the first few pulses, so a reasonable alternative would be to use shorter-duration pulse trains, which would allow for the use of higher stimulus levels and thus a greater likelihood of obtaining measurable ECAPs.
A potential shortcoming in the present data set is that ECAP responses were not evaluated for rates slower than 900 pps. The initial motivation for the study was to examine the range of stochastic rates across electrodes and subjects. Therefore, 900 pps was chosen as the slowest rate for the present study based on results from Wilson et al. (1997). Those data showed that 900 pps typically produced a clear alternating pattern across pulses, suggesting that a stochastic state should be reached with rates faster than 900 pps. In the course of data analysis, however, it became clear that other characteristics of the functions were of interest to examine, such as the alternation depth and amount of adaptation or desynchronization across pulses. Therefore, additional research would be valuable for further characterizing responses for slower pulse rates.
Similarly, patterns were only assessed for the first 21 pulses for each rate. Therefore, it is not known whether the trends noted in the present study would persist across longer-duration pulse trains. For example, the alternating pattern for E11 at 2400 pps in Fig. 3 shows greater alternation for the first half of the function than for the second half. Based on the limited sampling window, it is not known whether that alternation persists or continues to diminish. Hay-McCutcheon et al. (2005) showed relatively stable patterns across a series of 100 pulses for a 1000-pps train (i.e., 100-ms window), but did not assess other rates. Therefore, assessment of temporal response patterns across a longer time window for different rates represents an opportunity for further study.
4. Conclusions
The primary goal of this study was to characterize ECAP temporal response patterns across electrodes within a subject and across a relatively large group of subjects. Results showed that (1) stochastic rate varied across cochlear regions for the majority (79%) of ears tested; (2) stochastic rates ranged from 900 pps to 3500 pps, which spanned the entire range assessed; (3) for a large number of subjects, the alternating pattern developed into a triplet pattern as the rate increased to 2400–3500 pps; (4) stochastic state was reached most often for 2400- to 3500-pps pulse trains; (5) stimulus level was significantly correlated with stochastic rate; (6) maximum alternation occurred most often for 1200- to 1800-pps pulse trains; (7) on average, the maximum alternation depth spanned a range of approximately 19% of the amplitude of the response to the first pulse in the train; (8) the overall amount of adaptation/desynchronization decayed exponentially as a function of pulse-train rate; (9) on average, approximately 23% of the total population of fibers recruited by the first pulse produced a response to each subsequent pulse at the fastest rate (3500 pps); and (10) temporal response properties of the auditory nerve appear to be resilient to device re-implantation and longitudinal effects.
Highlights.
Stochastic rates varied across cochlear regions for the majority (79%) of ears tested.
Stochastic state occurred most often for 2400–3500 pps pulse trains.
Maximum alternation occurred most often for 1200–1800 pps pulse trains.
Stimulus level was significantly correlated with stochastic rate.
At 3500 pps, ~23% of fibers recruited by the first pulse responded to subsequent pulses.
Acknowledgments
This research was supported by NIH/NIDCD R01 DC009595, T35 DC008757, and P30 DC04662. The content of this project is solely the responsibility of the authors and does not necessarily represent the official views of the National Institute on Deafness and Other Communication Disorders or the National Institutes of Health. The authors thank Tom Creutz for data-analysis programs; Leo Litvak (Advanced Bionics) for BEDCS support; and Lisa Stille, Katelyn Rosemond, Donna Neff, Adam Goulson, Alex Helbig, and Gina Diaz for assistance with data collection. We also thank two anonymous reviewers for valuable feedback on an earlier version of this manuscript.
Abbreviations
- AB
Advanced Bionics
- BEDCS
Bionic Ear Data Collection System
- CI
cochlear implant
- CIS
continuous interleaved sampling
- ECAP
electrically evoked compound action potential
- FSP
Fine Structure Processing
- MPI
masker-probe interval
- NRT
Neural Response Telemetry
- pps
pulses per second
- SD
standard deviation
Footnotes
ECAP amplitude is also influenced by the proximity of the stimulating electrode to the neural tissue, as well as the relative location of the recording electrode. Because those two variables are held constant for the measures described here, any relative changes in ECAP amplitude as a function of pulse number should reflect the activity of the underlying neural population.
CL is a logarithmic-based current-level unit for Nucleus devices.
Publisher's Disclaimer: This is a PDF file of an unedited manuscript that has been accepted for publication. As a service to our customers we are providing this early version of the manuscript. The manuscript will undergo copyediting, typesetting, and review of the resulting proof before it is published in its final citable form. Please note that during the production process errors may be discovered which could affect the content, and all legal disclaimers that apply to the journal pertain.
References
- Abbas PJ, Brown CJ, Shallop JK, Firszt JB, Hughes ML, Hong SH, Staller SJ. Summary of results using the Nucleus CI24M implant to record the electrically evoked compound action potential. Ear Hear. 1999;20(1):45–59. doi: 10.1097/00003446-199902000-00005. [DOI] [PubMed] [Google Scholar]
- Arneson AR, Osen KK. The cochlear nerve in the cat: Topography, cochleotopy, and fiber spectrum. J Comp Neurol. 1978;178(4):661–678. doi: 10.1002/cne.901780405. [DOI] [PubMed] [Google Scholar]
- Botros A, Psarros C. Neural Response Telemetry reconsidered: II. The influence of neural population on the ECAP recovery function and refractoriness. Ear Hear. 2010;31:380–391. doi: 10.1097/AUD.0b013e3181cb41aa. [DOI] [PubMed] [Google Scholar]
- Finley CC, Holden TA, Holden LK, Whiting BR, Chole RA, Neely GA, Hullar TE, Skinner MW. Role of electrode placement as a contributor to variability in cochlear implant outcomes. Otol Neurotol. 2008;29(7):920–928. doi: 10.1097/MAO.0b013e318184f492. [DOI] [PMC free article] [PubMed] [Google Scholar]
- Finley C, Wilson B, van den Honert C, Lawson D. Sixth Quarterly Progress Report, Nov. 1, 1996-Jan. 31, 1997, NIH Project N01-DC-5-2103. 1997. Speech processors for auditory prostheses. [Google Scholar]
- Frijns JH, de Snoo SL, ten Kate JH. Spatial selectivity in a rotationally symmetric model of the electrically stimulated cochlea. Hear Res. 1996;95(1–2):33–48. doi: 10.1016/0378-5955(96)00004-4. [DOI] [PubMed] [Google Scholar]
- Fu QJ. Temporal processing and speech recognition in cochlear implant users. NeuroReport. 2002;13(13):1635–1639. doi: 10.1097/00001756-200209160-00013. [DOI] [PubMed] [Google Scholar]
- Hay-McCutcheon M, Brown CJ, Abbas PJ. An analysis of the impact of auditory-nerve adaptation on behavioral measures of temporal integration in cochlear implant recipients. J Acoust Soc Am. 2005;118(4):2444–2457. doi: 10.1121/1.2035593. [DOI] [PubMed] [Google Scholar]
- Hochmair I, Nopp P, Jolly C, Schmidt M, Schosser H, Garnham C, Anderson I. MED-EL cochlear implants: State of the art and a glimpse into the future. Trends Amplif. 2006;10(4):201–220. doi: 10.1177/1084713806296720. [DOI] [PMC free article] [PubMed] [Google Scholar]
- Holstad BA, Sonneveldt VG, Fears BT, Davidson LS, Aaron RJ, Richter M, Matusofsky M, Brenner CA, Strube MJ, Skinner MW. Relation of electrically evoked compound action potential thresholds to behavioral T- and C-levels in children with cochlear implants. Ear Hear. 2009;30(1):115–127. doi: 10.1097/AUD.0b013e3181906c0f. [DOI] [PMC free article] [PubMed] [Google Scholar]
- Hughes ML, Stille LJ. Psychophysical and physiological measures of electrical-field interaction in cochlear implants. J Acoust Soc Am. 2009;125(1):247–260. doi: 10.1121/1.3035842. [DOI] [PMC free article] [PubMed] [Google Scholar]
- Javel E, Shepherd RK. Electrical stimulation of the auditory nerve. III. Response initiation sites and temporal fine structure. Hear Res. 2000;140(1–2):45–76. doi: 10.1016/s0378-5955(99)00186-0. [DOI] [PubMed] [Google Scholar]
- Liberman MC. Morphological differences among radial afferent fibers in the cat cochlea: An electron-microscopic study of serial sections. Hear Res. 1980;3(1):45–63. doi: 10.1016/0378-5955(80)90007-6. [DOI] [PubMed] [Google Scholar]
- Liberman MC. The cochlear frequency map for the cat: Labeling auditory-nerve fibers of known characteristic frequency. J Acoust Soc Am. 1982;72:1441–1449. doi: 10.1121/1.388677. [DOI] [PubMed] [Google Scholar]
- Litvak LM, Smith ZM, Delgutte B, Eddington DK. Desynchronization of electrically evoked auditory-nerve activity by high-frequency pulse trains of long duration. J Acoust Soc Am. 2003;114(4):2066–2078. doi: 10.1121/1.1612492. [DOI] [PMC free article] [PubMed] [Google Scholar]
- Luo X, Fu QJ, Wei CG, Cao KL. Speech recognition and temporal amplitude modulation processing by Mandarin-speaking cochlear implant users. Ear Hear. 2008;29(6):957–970. doi: 10.1097/AUD.0b013e3181888f61. [DOI] [PMC free article] [PubMed] [Google Scholar]
- Miller CA, Abbas PJ, Robinson BK. Response properties of the refractory auditory nerve fiber. J Assoc Res Otolaryngol. 2001;2:216–232. doi: 10.1007/s101620010083. [DOI] [PMC free article] [PubMed] [Google Scholar]
- Miller CA, Hu N, Zhang F, Robinson BK, Abbas PJ. Changes across time in the temporal responses of auditory nerve fibers stimulated by electric pulse trains. J Assoc Res Otolaryngol. 2008;9:122–137. doi: 10.1007/s10162-007-0108-5. [DOI] [PMC free article] [PubMed] [Google Scholar]
- Mino H, Rubinstein JT. Effects of neural refractoriness on spatio-temporal variability in spike initiations with electrical stimulation. IEEE Trans Neur Sys Rehab Eng. 2006;14(3):273–280. doi: 10.1109/TNSRE.2006.881590. [DOI] [PubMed] [Google Scholar]
- Mino H, Rubinstein JT, Miller CA, Abbas PJ. Effects of electrode-to-fiber distance on temporal neural response with electrical stimulation. IEEE Trans Biomed Eng. 2004;51(1):13–20. doi: 10.1109/TBME.2003.820383. [DOI] [PubMed] [Google Scholar]
- Morsnowski A, Charasse B, Collet L, Killian M, Müller-Deile J. Measuring the refractoriness of the electrically stimulated auditory nerve. Audiol Neurotol. 2006;11:389–402. doi: 10.1159/000095966. [DOI] [PubMed] [Google Scholar]
- Muller M, Robertson D. Relationship between tone burst discharge pattern and spontaneous firing rate of auditory nerve fibres in the guinea pig. Hear Res. 1991;57(1):63–70. doi: 10.1016/0378-5955(91)90075-k. [DOI] [PubMed] [Google Scholar]
- Ng M, Niparko JK, Nager GT. Inner ear pathology in severe to profound sensorineural hearing loss. In: Niparko JK, Kirk KI, Mellon NK, Robbins AM, Tucci DL, Wilson BS, editors. Cochlear Implants: Principles and Practices. Lippincott Williams & Wilkins; Philadelphia: 2000. [Google Scholar]
- Potts LG, Skinner MW, Gotter BD, Strube MJ, Brenner CA. Relation between Neural Response Telemetry thresholds, T-and C -levels, and loudness judgments in 12 adult Nucleus 24 cochlear implant recipients. Ear Hear. 2007;28(4):495–511. doi: 10.1097/AUD.0b013e31806dc16e. [DOI] [PubMed] [Google Scholar]
- Ranck JB., Jr Which elements are excited in electrical stimulation of mammalian central nervous sytem: A review. Brain Res. 1975;98:417–440. doi: 10.1016/0006-8993(75)90364-9. [DOI] [PubMed] [Google Scholar]
- Rattay F. Analysis of models for external stimulation of axons. IEEE Trans Biomed Eng. 1986;33:974–977. doi: 10.1109/TBME.1986.325670. [DOI] [PubMed] [Google Scholar]
- Rhode WS, Smith PH. Characteristics of tone-pip response patterns in relationship to spontaneous rate in cat auditory nerve fibers. Hear Res. 1985;18(2):159–168. doi: 10.1016/0378-5955(85)90008-5. [DOI] [PubMed] [Google Scholar]
- Rubinstein JT, Wilson BS, Finley CC, Abbas PJ. Pseudospontaneous activity:stochastic independence of auditory nerve fibers with electrical stimulation. Hear Res. 1999;127(1–2):108–118. doi: 10.1016/s0378-5955(98)00185-3. [DOI] [PubMed] [Google Scholar]
- Sagi E, Kaiser AR, Meyer TA, Svirsky MA. The effect of temporal gap identification on speech perception by users of cochlear implants. J Sp Lang Hear Res. 2009;52(2):385–395. doi: 10.1044/1092-4388(2008/07-0219). [DOI] [PMC free article] [PubMed] [Google Scholar]
- Tykocinski M, Shepherd RK, Clark GM. Reduction in excitability of the auditory nerve following electrical stimulation at high stimulation rates. Hear Res. 1995;88:124–142. doi: 10.1016/0378-5955(95)00108-g. [DOI] [PubMed] [Google Scholar]
- Van Dijk B, Botros AM, Battmer RD, Begall K, Dillier N, Hay M, Lai WK, Lenarz T, Laszig R, Morsnowski A, Muller-Deile J, Psarros C, Shallop J, Weber B, Wesarg T, Zarowski A. Clinical results of AutoNRT, a completely automatic ECAP recording system for cochlear implants. Ear Hear. 2007;28(4):558–570. doi: 10.1097/AUD.0b013e31806dc1d1. [DOI] [PubMed] [Google Scholar]
- Wilson BS, Finley CC, Lawson DT, Zerbi M. Temporal representations with cochlear implants. Am J Otol. 1997;18(6):30–34. [PubMed] [Google Scholar]
- Woo J, Miller CA, Abbas PJ. The dependence of auditory nerve rate adaptation on electric stimulus parameters, electrode position, and fiber diameter: a computer model study. J Assoc Res Otolaryngol. 2010;11(2):283–296. doi: 10.1007/s10162-009-0199-2. [DOI] [PMC free article] [PubMed] [Google Scholar]
- Zhang F, Miller CA, Robinson BK, Abbas PJ, Hu N. Changes across time in spike rate and spike amplitude of auditory nerve fibers stimulated by electric pulse trains. J Assoc Res Otolaryngol. 2007;8:356–372. doi: 10.1007/s10162-007-0086-7. [DOI] [PMC free article] [PubMed] [Google Scholar]


