Abstract
Polyamides (PA) are distamycin-type ligands of DNA that bind the minor groove and are capable of sequence selective recognition. This capability provides a viable route to their development as therapeutics. Presented here is a simple and convenient fluorescence assay for polyamide-DNA binding. PAs are titrated into a sample of a hairpin DNA featuring a TAMRA dye attached to an internal dU near the PA binding site. In a study of 6 polyamides, PA binding leads to a steady, reproducible decrease in fluorescence intensity that can be used to generate binding isotherms. The assay works equally well with both short (6–8 ring) and long (14 ring) polyamides, and Kd values ranging from about 1 nM to at least 140 nM were readily obtained using a simple monochromator or filter configuration. Competition assays provide a means to assessing possible dye interference, which can be negligible. The assay can also be used to determine polyamide extinction coefficients, and to measure binding kinetics, and thus is an accessible and versatile tool for the study of polyamide properties and polyamide-DNA interactions.
Keywords: polyamide, DNA, fluorescence, binding
INTRODUCTION
Polyamides (PA) are distamycin-type ligands of DNA that bind the minor groove and are capable of sequence selective recognition [1]. Polyamides can be thought of as higher homologs of Distamycin A and the lexitropsins, and all of these DNA ligands form hydrogen bonds to functional groups in the minor groove of double-stranded DNA, providing a range of binding tendencies and selectivities [2; 3]. An amino acid derivative of N-methylimidazole (Im), which recognizes G, and an analogous derivative of N-methylpyrrole (Py), which recognizes C, A, or T, form the bulk of polyamide building blocks. The 2-carboxy-4-amino substitution pattern of these 5-membered heterocycles confers a shape on the resulting polyamides that matches the curvature of B-form duplex DNA very closely [1]. Additionally, β-alanine (β) is used in PA design to confer some conformational flexibility and also can recognize C, A, and T. These are the most common building blocks found in polyamides, which can be prepared in a number of topologies, from linear to circular and hairpin shapes [1]. Hairpin structures are able to form a turn composed of groups such as γ-aminobutyric acid, which binds mainly to nucleobases classified as W (either A or T). Typical C-termini of polyamide hairpins mimic the cationic amidine group found at the same terminus of Distamycin A and are capped with cationic tails prepared from N,N-dimethylaminopropylamine (Dp) or 3,3’-diamino-N-methyldipropylamine (Ta) building blocks, both of which bind preferentially to A or T over G and C. The hairpin structure introduced by Dervan allows each strand of the PA to independently recognize one strand of duplex DNA. This arrangement makes for highly sequence selective binding [4; 5]. Thus hairpin polyamides have been used effectively for biomedical programs that target specific DNA sequences, including the control of gene expression and the diminution of viral titer [6; 7; 8]. In some cases, polyamides have been used successfully both in vitro and in vivo, and it is hoped that this class of designed DNA ligands will be developed as therapeutics [8; 9; 10; 11].
Critical to the continued development of polyamides as DNA ligands is a convenient assay for their DNA-binding behavior. Many drug-DNA interactions have been characterized using optical techniques [12; 13], and a number are based on the changes in intrinsic fluorescence of the ligand upon binding DNA. While PAs have limited intrinsic fluorescence, and PA-DNA binding can be characterized via observation of this weak fluorescence signal [14], high PA concentrations are required (above 1 uM), well above the range needed to measure high affinity Kds typical for these molecules [15]. Another option for studying PA-DNA binding involves the incorporation of a fluorophore into the polyamide [16; 17; 18]. However, the introduction of such a dye requires additional synthetic and purification steps and can change uptake for cell-based assays, making the biological relevance of PA-dye conjugates questionable, unless they are the bioactive species [19].
The most commonly performed assays of DNA binding by PAs involve calorimetry [20], surface plasmon resonance (SPR) [20], and footprinting [21]. All of these techniques require specialized equipment and expertise that do not make them generally accessible. Fluorescence spectroscopy is a more convenient technique than any of the alternatives surveyed above, and assays such as the fluorescence of intercalator displacement (FID) have been applied to the characterization of PA-DNA binding [22]. This approach is technically easier but reliant on a second (DNA-intercalator) equilibrium, which may or may not be amenable to a particular concentration regime of interest. Presented here is a simple, versatile, and convenient fluorescence assay for polyamide-DNA binding. Its utility is demonstrated for Kd measurements, PA extinction coefficient determinations, and PA-DNA binding kinetics.
MATERIALS AND METHODS
Chemical Synthesis
Polyamides 1–6 were prepared by automated solid-phase synthesis on Boc-β-alanine-PAM resin [23]. An ABI 433A peptide synthesizer was used. Compounds were isolated by reverse-phase HPLC with a MeOH/H2O/0.1% TFA gradient and characterized by mass spectrometry (HPLC/MS and HRMS, both using ESI+), combustion analysis (CNH), UV/Vis and 500 MHz 1H NMR. Detailed characterizations for 1–5 are provided in the supporting information, and 6 was prepared and characterized as previously described [8]. Note that, contrary to previous reports that imidazoles are not protonated in isolated PAs, elemental analysis indicated that our compounds were isolated from RP-HPLC (MeOH/Water/0.1% TFA) as tetracations with all imidazoles and the tertiary amine protonated [14; 24]. Stock solutions of 6 in DMSO were quantitated using an ε305 of 113,300 M−1cm−1, a reference value obtained by NMR spectroscopy [25]. Other polyamide stock concentrations were obtained by dissolving a known mass (1–2 mg weighed to at least two significant figures) of lyophilized and MS-determined samples in either DMSO or H2O, diluted as needed, and stored at –20°C. If additional stocks were needed, they were quantitated from the ε at 305 nm (λmax for the peak closest to the visible region) obtained from the mass, MWT, and the absorbance of a sample in the low micromolar range. For 2, the extinction coefficient obtained via this method was compared with the value generated by the fluorescence method as described below.
Fluorescence Spectroscopy
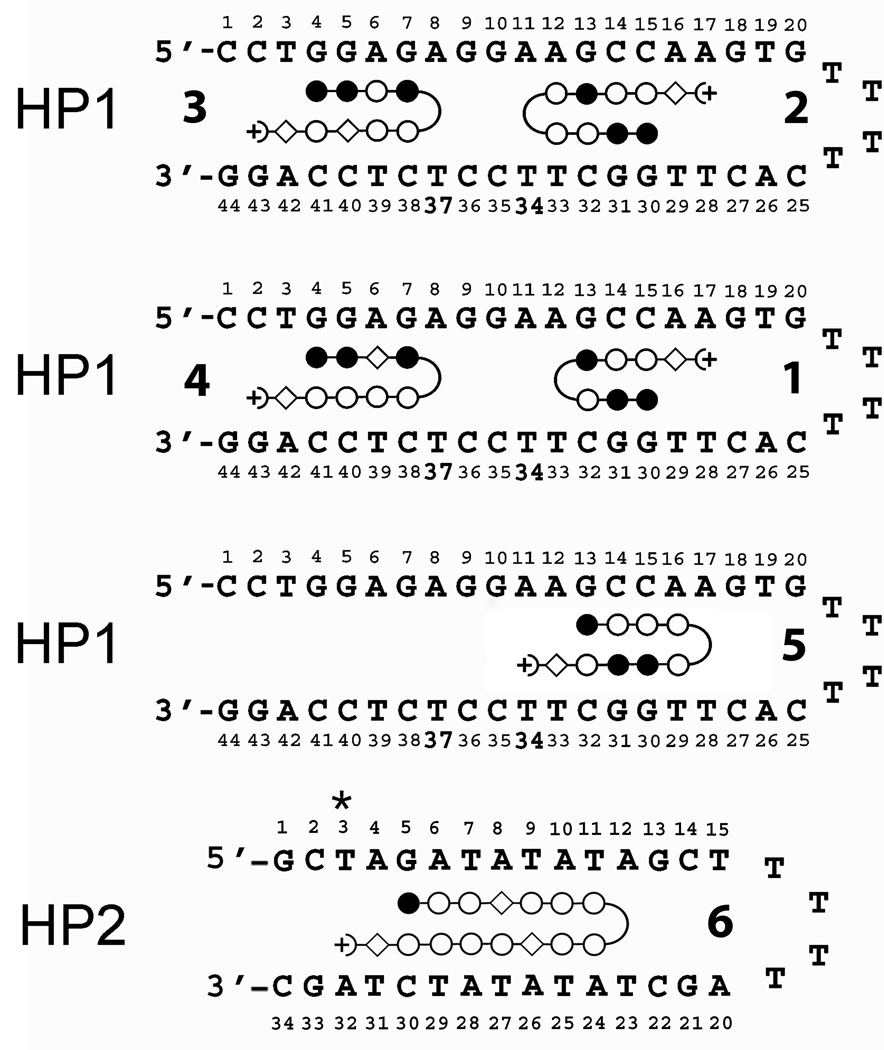
Quantitation of DNA binding was achieved by observing the change in fluorescence intensity of TAMRA (carboxytetramethyl rhodamine)-labeled oligonucleotide as a function of PA concentration. 5’-CCT GGA GAG GAA GCC AAG TGT TTT CAC TTG GCT TCC TCT CCA GG-3’ (HP1) and 5’-GCT AGA TAT ATA GCT TTT TAG CTA TAT ATC TAG C-3; (HP2) were purchased with HPLC purification from IDT (Coralville, IA) either unlabeled or labeled with dU-TAMRA (at C5 via NHS ester) at either T34 or T37 for HP1 and at T3 in HP2 as shown in Fig. 1. The DNAs were rinsed twice with Milli-Q water using a Centricon unit, annealed from boiling water, quantitated using the vendor’s extinction coefficient, and either used directly or aliquoted, lyophilized and stored at −20 °C until use.
Fig. 1. Summary of Hairpin Design with Dye Placement.
For HP1, TAMRA dye was placed either at T34 or T37 as indicated. Illustrated PAs are numbered and correspond to Table 1 entries. PA positions are based on expected binding location as dictated by conventional recognition rules. For HP2, TAMRA dye was placed at T3 (*). Closed circles = imidazole; open circles = pyrrole; open diamond = β alanine.
The experiments were performed in acid pre-washed quartz cuvettes in buffer (10 mM HEPES, 50 mM NaCl, 1 mM EDTA, pH 7.4) on a T-formatted Fluorolog-3 (SPEX) spectrofluorimeter. The temperature was maintained at 25 °C with a thermostatted cell holder equipped with a magnetic stirrer. TAMRA-labeled oligonucleotides were excited at 559 nm and the resulting emission was observed through a monochromator set at 580 nm or passed through a 592 nm bandpass filter (Edmund Optics, Barrington, NJ). In most cases, the intensity at the emission maximum decreased as PA was added. Intensity values were obtained in triplicate and averaged.
Intensities were normalized to indicate fraction of DNA bound and then plotted versus PA concentration and the data fit to equation 1:
| (1) |
where θ is fraction of duplex bound, [L] is the total PA concentration, and Ka is the association constant. Reported Kds represent an average of at least three separate experiments.
Competition Fluorescence Binding Assay
Increasing amounts of unlabeled DNA hairpin PA were added to a fluorescent DNA-PA complex pre-formed at a concentration 10-fold above the Kd and the resultant intensities measured and averaged. The resulting data were fit to a system of equations describing both the labeled DNA-PA equilibrium (known Kd) and the unlabeled DNA-PA equilibrium (unknown Kd) using Scientist software (MicroMath, Salt Lake City, UT) as previously described [26; 27; 28].
Dissociation Kinetics (Scheme I)
To observe koff for 2, 75 nM of unlabeled DNA hairpin was added to a 30 nM 1:1 complex of 2 and TAMRA-labeled DNA hairpin (denoted *DNA) in 10 mM HEPES, 50 mM NaCl, 1 mM EDTA, pH 7.4. Intensities were recorded every 30 sec, normalized and fit to the expression: fraction bound = 1-e^(kofft) where koff is the dissociation rate constant.
| (Scheme 1) |
Kd Determination by Quantitative DNaseI Footprinting using Capillary Electrophoresis (CE)
To generate a 120 bp DNA fragment containing one site for PA 2, two complementary 90mer oligomers were ordered from Integrated DNA Technologies, Inc. (Coralville, Iowa) (top strand): 5’-TGA TGG AGG TGG AGT TTA ATG AAA TTT CTG CAA GGG TCT GTA ATA TGT TTT GTA AAT TCT AAC CTG GAG AGG AAG CCA AGT GTT TTT GGT and (bottom strand) 5’-ACC AAA AAC ACT TGG CTT CCT CTC CAG GTT AGA ATT TAC AAA ACA TAT TAC AGA CCC TTG CAG AAA TTT CAT TAA ACT CCA CCT CCA TCA-3’. These were annealed in 10 mM Tris buffer and cooled to room temperature. Diluted duplex was used as a template and amplified using the forward primer: 5’-ATG TGA TAG GGT AGA TGA TGG AGG TGG AGT TTA ATG AAA T-3’ and the reverse primer 5’-CTG CTA ATG GTT GTA ACC AAA AAC ACT TGG CTT CCT CTC C-3’ (underlined sequences overlap with above duplex). The PCR conditions were 55 °C/1min annealing temperature, 68 °C/min extension temperature with 33 cycles. The fragment was purified using agarose gel electrophoresis and a Qiagen gel purification kit. This product was used as a template and further PCR amplified to generate a 120 bp DNA fragment with the 5’ terminus of the top strand labeled with fluorescent dye 6-Fam. The PCR conditions were: 54 °C annealing temperature, extension temperature/time: 68 °C/min, 33 cycles. The final product was purified using agarose gel electrophoresis and a Qiagen gel purification kit.
For quantitative footprinting, this duplex DNA was mixed with polyamide in TKMC buffer (10 mM Tris, 10 mM KCl, 5 mM MgCl2 and 5 mM CaCl2), incubated at 37 °C for 4 hours to overnight [21]. The mixture was digested with RQ1 RNase-Free DNase I (Promega, Madison, WI) for 5 min at 37 °C and quenched by adding 30 µL of 500 mM EDTA. Typically, 0.01~0.03U DNase I was used to achieve the desired single-hit cleavage kinetics [29]. The DNase I digested product was purified with Qiagen PCR purification kits (Qiagen, Valencia, CA) and eluted with 30 µL of buffer. A few µL of the resulting samples were analyzed using an ABI 3100 16-capillary CE-based sequencer (Carlsbad, California). Data were processed using Genemarker V1.97 software (Softgenetics LLC, State College, PA). Peaks in the footprint were normalized to a neighboring peak (one not sensitive to PA concentration) and plotted as fraction bound vs. PA concentration and fit to the Langmuir isotherm as described above.
RESULTS AND DISCUSSION
Assay Design
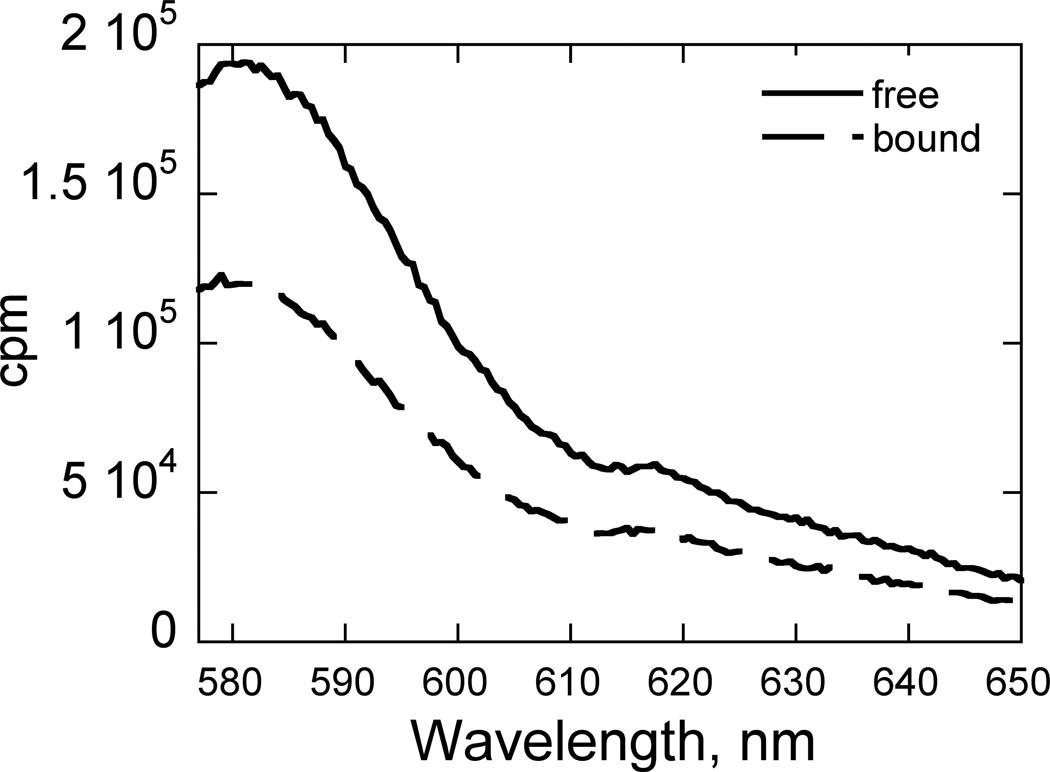
The assay for PA-DNA interactions described here is based on a simple design involving the attachment of an extrahelical TAMRA dye via a linker at the C5 position of thymidine analog 2’-deoxyuridine (dU), a modification that is commercially available. The dye was located either near the binding site of the relevant polyamides’ gamma turn (γ) or a few nucleotides removed from the expected recognition site for the PA-DNA combination (Fig. 1). In most cases, the fluorescence of the TAMRA dye decreased as a function of added PA (Fig. 2). Interestingly, with the dye placements used, the percent change in fluorescence intensity is typically very large, ranging from 5% for 6 to over 30% for 4 (Table 1). Most of the intensity changes are well above the threshold of reproducibility for fluorescence intensity (%). This provides excellent signal-to-noise ratios.
Fig. 2. Fluorescence Emission Spectral Response upon PA Binding.
Free DNA (solid) vs. 2-bound DNA (dashed). Conditions: 10 nM HP1, 10 mM HEPES, 50 mM NaCl, 1 mM EDTA, pH 7.4, 25°C.
Table 1.
Summary of Polyamide-DNA Interactions Observed by Fluorescence Spectroscopy
| # | Sequence | Site | Dye locn | % Δ int | Kd, nM |
|---|---|---|---|---|---|
| 1 | dImImPyγImPyPyβDp | head | T37 | 10 ± 5 | 7.8 ± 1.6 |
| 2 | dImImPyPyγPyImPyPyβDp | head | T37 | 34 ± 2 | 2.3 ± 0.3 |
| 3 | dImImPyImγPyPyβPyβDp | tail | T37 | 25 ± 3 | 50 ± 15 |
| 4 | dImImβImγPyPyPyPyβDp | tail | T37 | 38 ± 3 | 140 ± 30 |
| 5 | dImPyPyPyγPyImImPyβDp | head | T34 | 22 ± 4 | 11.4 ± 1 |
| 6 | dImPyPyβPyPyPyγ-PyPyβPyPyPyPyβTab | n/a | T3 | 5.5 ± 1.5 | 4.8 ± 0.6 |
Im = imidazole, dIm = desamino-imidazole, Py = pyrrole, β= beta alanine, γ= gamma turn, Ta = 3,3’-diamino-N-methyldipropylamine, Dp = N,N-dimethylaminopropylamine. Site refers to the expected binding location based on recognition rules. Dye locn refers to the position of the TAMRA dye. % Δ int refers to the percent change in fluorescence intensity between the free DNA and PA-bound DNA. Unless otherwise noted, DNA binding to all PAs was measured with HP1 in 10 mM HEPES, 50 mM NaCl, pH 7.4, 25°C.
Kds were measured with HP2 and 200 µM nt calf thymus DNA, an additive carrier necessary to achieve reliable isotherms with this PA. Such carriers are used frequently in the literature and are known to decrease non-specific interactions between nucleic acids and proteins or small molecules [38; 39].
Equilibrium Binding Assay
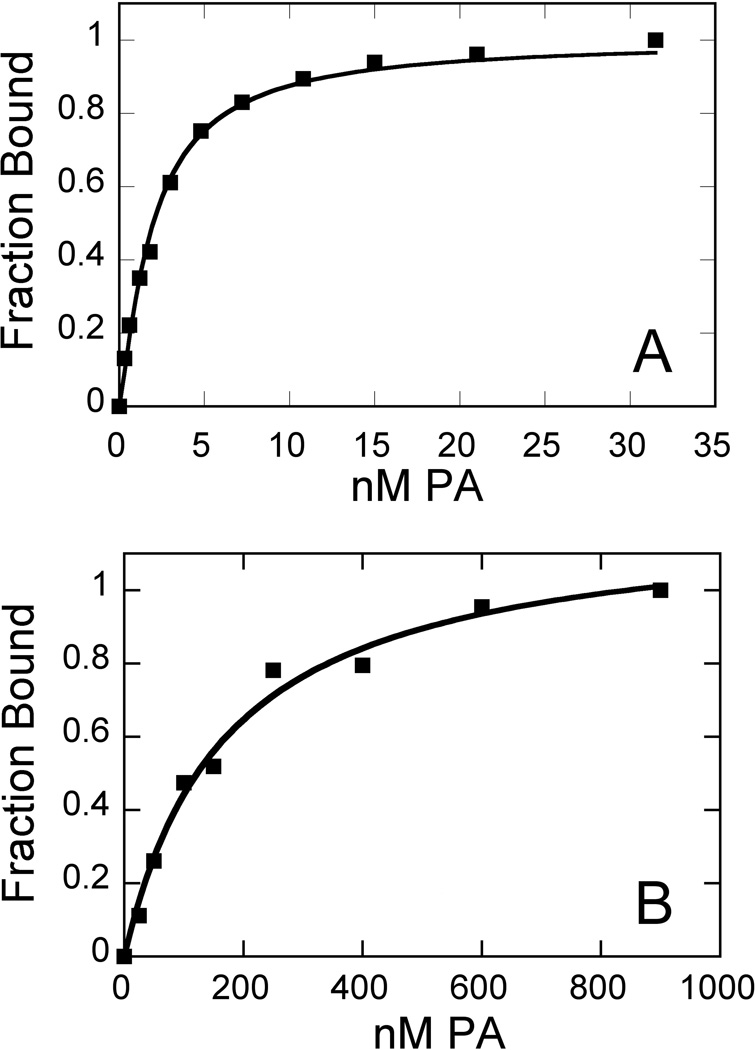
As shown in Fig. 3 and summarized in Table 1, high quality isotherms are readily obtained for a number of PAs ranging from 6–14 rings in size. Kds presented here range from 2.3 nM (Fig. 3A) to nearly 140 nM (Fig. 3B), and it is anticipated that the range of utility extends beyond these values. For Kds below 1 nM, it is of course necessary for the DNA concentration to be well below 1 nM for adequate measurements to be made. Under these circumstances, additional signal would be available using a cutoff or bandpass filter instead of a monochromator.
Fig. 3. Sample Isotherms for PA Binding.
(A) strong (2) and (B) weak (4) binding isotherms illustrate the range of this assay. Conditions: 0.63 nM and 50 nM HP1, respectively, in 10 mM HEPES, 50 mM NaCl, 1 mM EDTA, pH 7.4, 25°C.
The assay is of sufficient sensitivity to discern a small difference in binding affinity (2–3 fold) between the isomers 3 and 4. While benefits of introducing an internal β-alanine have been noted [30], there is little information regarding the behaviors of PAs that are β isomers of one another (i.e., β-alanine and Py positions are swapped). In one study of alkylating PAs [31], the reason for an observed difference in activity between two β-alanine isomers is not clear and was attributed to conformational effects that are transmitted to alkylation reactivity. Something similar could be operable here.
Assessing Potential Dye Interference
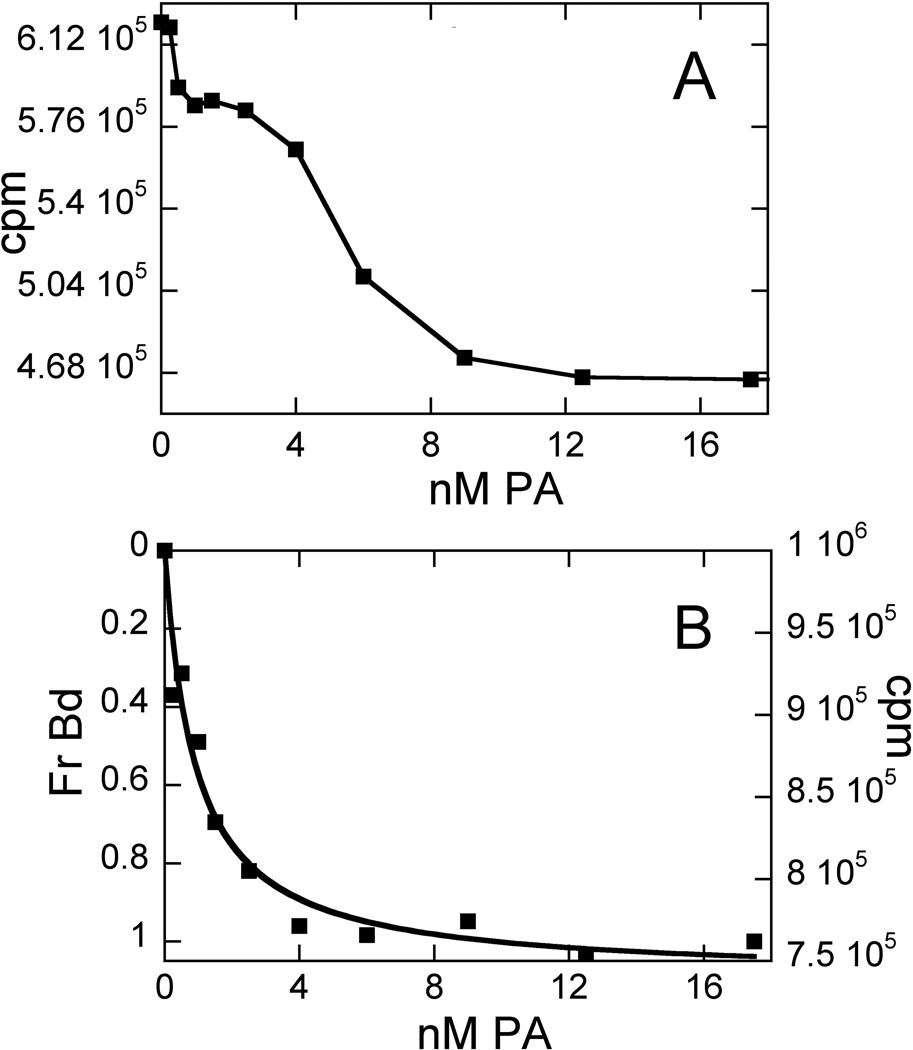
An obvious possible criticism of this assay is that the dye attached to the DNA hairpin can interfere with the PA-DNA interaction, thus leading to the measurement of artifact instead of any relevant Kd. This is manifested most obviously when the classical isotherm trend is disturbed in ways that are reproducible, rather than due to noise in the data. Indeed, in our hands, some obvious cases of dye interference were observed. Fig. 4A illustrates a reproducible anomaly in the isotherm for the binding of 5 to HP1 when the dye was placed at T37. As shown in Fig. 4B, this artifact was eliminated by “moving” the dye, that is, working with a DNA hairpin with the dye located elsewhere (T34 in this case). The assay does not provide structural details regarding why tethering the dye to T37 (which is removed from the anticipated PA binding site) leads to overt dye interference, while tethering to T34 (which is located at the PA binding site) does not. One possibility is that the dye at T37 interferes directly with the binding of 5 in a way that it does not when 1 or 2 bind at this site. The principal difference between the HP1 binding of 1 and 2 and that of 5 is that the latter binds in an opposite orientation, with the cationic tail (rather than the γ turn) being closer to the dye tether site. TAMRA is connected to dU via a long carbon chain linker (see Fig. S1); this provides enough length and flexibility for the dye to reach and occupy a number of locations. While a structure for an oligonucleotide terminally-labeled with rhodamine has been reported [32], we are unaware of any structural information regarding dye placement on internally labeled oligonucleotides. Another possible explanation for the importance of dye position is that the minor groove widening that accompanies PA-DNA binding [33] leads to conformational adjustment(s) that are transmitted to other parts of the duplex, affecting dye environment outside the most obvious region of DNA sequence. Perhaps the binding mode of 5 does this in a unique way relative to 1 and 2.
Fig. 4. Example of Dye Interference.
Binding trends for 5 (A) with dye located at T37; (B) dye located at T34. Conditions: 0. 5 nM DNA, 10 mM HEPES, 50 mM NaCl, 1 mM EDTA, pH 7.4, 25°C.
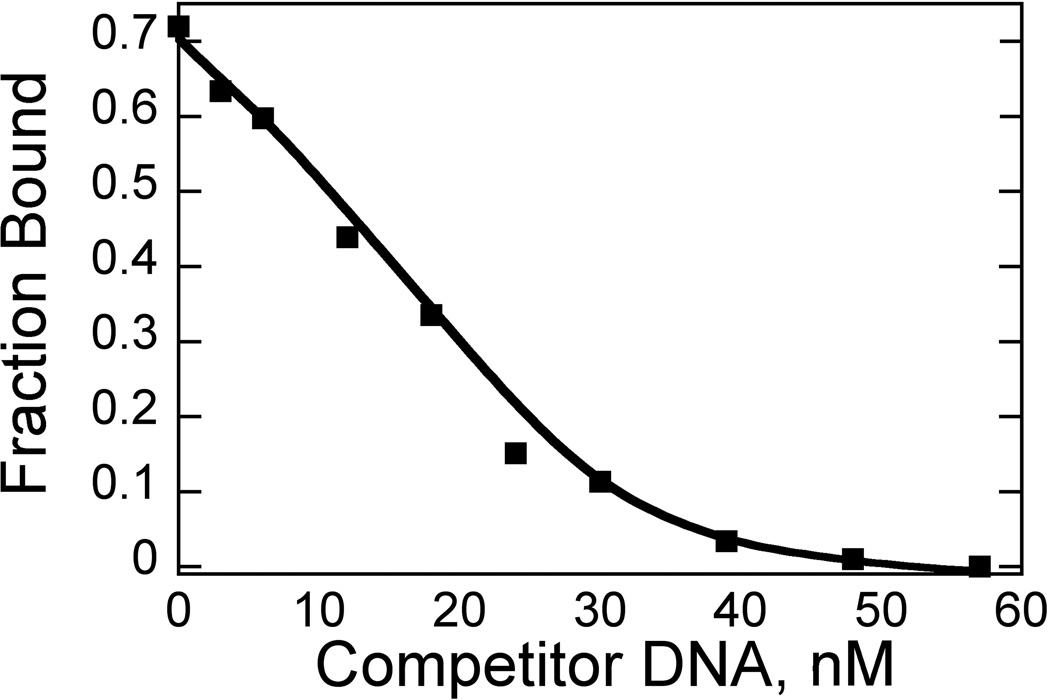
In contrast to the above example, it is also possible that the dye label can affect affinity without disturbing the binding trends or generating obvious artifacts. This possibility was addressed in two ways. The first is a simple competition assay in which a PA-DNA complex is pre-formed, and then unlabeled DNA is titrated into this sample. Increasing amounts of PA partition to unlabeled DNA until the PA-bound DNA signal disappears. These data are then fit to a competition model featuring the known Kd (measured directly with dye-labeled DNA) and the unknown Kd (for the unlabeled PA-DNA interaction). This is a common method for assessing dye interference [26; 27; 28].
A sample competition experiment is shown in Fig. 5; for 2, the data fit easily to yield the Kd for the unlabeled DNA (1.1 nM) and is very comparable to that of the labeled DNA. The same is true of 6, which binds the unlabeled DNA with a Kd of 1.8 nM.
Fig. 5. Competition Fluorescence Spectroscopy.
Titration of unlabeled DNA hairpin into 30 nM 2:TAMRA-labled DNA. Conditions: 10 mM HEPES, 50 mM NaCl, 1 mM EDTA, pH 7.4, 25°C. Data were fit to yield a Kd of 1.1 ± 0.2 nM for the unlabeled DNA.
In general, competition experiments work best when the two Kds are fairly similar (within one order of magnitude), although weaker binding competitor DNAs can be accommodated with higher competitor concentrations. The data shown here illustrate that it is possible for the dye to make no difference in affinity. If interference is exhibited, it is easily characterized with this experiment.
To determine if using a DNA hairpin would influence the Kds observed relative to a longer, conventional double-stranded DNA, the Kd for binding 2 to a perfectly matched site located in a 120 bp duplex was also determined using quantitative DNase I footprinting and capillary electrophoresis [34; 35]. The Kd for the sequence recognized by 2 within the long, linear DNA duplex was the same within experimental error as that observed using the fluorescence assay and a hairpin DNA substrate (1.1 ± 0.2 nM). Thus, the question of whether these hairpin designs are similar enough to conventional double stranded DNA to provide meaningful Kds is answered: there is no significant difference in Kds for this polyamide determined in our hairpins or in a long duplex.
Other Applications of the Assay
Extinction Coefficient for Ligand
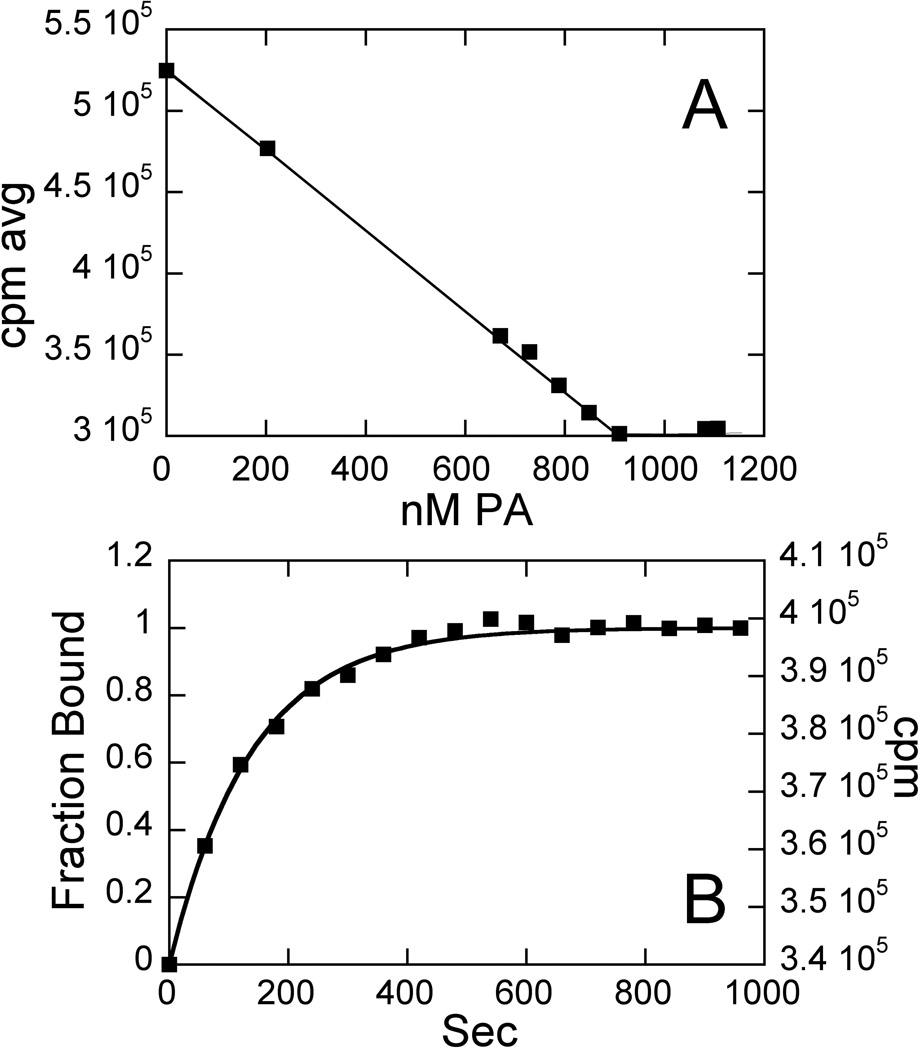
Obtaining reliable extinction coefficients for DNA binding molecules can sometimes be problematic. This is especially true in the case of polyamides, which have been shown to exhibit dramatically different extinction coefficients under different conditions [14; 24]. This fluorescence assay, coupled with the well-characterized ε’s for DNA, makes it possible to obtain reliable extinction coefficients for polyamides. To demonstrate this, a provisional ε305 was determined by measuring the absorbance of a sample in DMSO based on the accurately weighed mass (1–2 mg), known volume of solution, the mass spectrometry- and elemental analysis-determined MWT, and Beer’s Law. For 2, this value is 93,000 M−1cm−1. Stocks of 2 quantitated using this value were used to titrate into a known concentration of labeled HP1 that is well above the Kd for the interaction (>10-fold). Since PA absorbance and fluorescence emission is well removed from the fluorescence behavior of TAMRA (over 100 nm), there is no interference in the TAMRA signal from the PA. This determination is illustrated for HP1 and 2 in Fig. 6A. Because one is working so far above the Kd (2.3 ± 0.3 nM), all added PA becomes immediately bound. When PA is added in excess, there is no further change in signal. The concentration of PA at which these two trends intersect, which is well determined by a number of points on either side of the transition, gives the true PA concentration in the mixture. Using this information and the known concentration of DNA, the 2:HP1 stoichiometry is calculated to correct the provisional ε305 value to 103,000 M−1cm−1. In this case, the adjustment was less than 10%. Thus while determining ε by mass is a reasonable approach for this compound, the new analysis described here can be used to determine, verify, and/or correct ε305 values determined via other means. This can be especially helpful when the conventionally-determined ε, binding constants, or other properties are measured in different solvents or buffers, because of the wide range of ε values seen for a given PA, depending on solvent details [14; 24].
Fig. 6.
(A) Extinction coefficient determination for 2. Conditions: 800 nM HP1, 10 mM HEPES, 50 mM NaCl, 1 mM EDTA, pH 7.4, 25°C. ε was determined to be 103,000 M−1cm−1 at 305 nm, and the Kd for the interaction between HP1 and 2 is 2.3 ± 0.3 nM. (B) Dissociation rate constant determination for 2. 30 nM 1:1 HP1:2 complex and 75 nM unlabeled DNA competitor. Data were fit to obtain kobs (koff) = 0.42 min−1.
Kinetic Binding Constants
In addition to the above applications, the assay presented here can be used to measure kinetic rate constants for binding, providing an alternative to SPR. As an illustration, the off-rate constant (koff) for DNA-PA binding was obtained by adding a large excess of unlabeled HP1 into a pre-formed complex of 2 and labeled HP1 at a concentration well above the Kd (2.3 ± 0.3 nM) (Scheme 1) and then observing the change in fluorescence emission signal as a function of time until a plateau was reached (Fig. 6B). These data were fit to obtain kobs (koff) of 0.42 min−1. Forward rate constants can also obtained by varying this observation as a function of PA concentration [36]: kon is the slope of this dependence. Our method allows determination of on and off rate constants for binding without extensive experimental design that can be required for techniques such as SPR to avoid mass transfer limitations or other diffusion-related systematic errors[37].
In conclusion, presented here is a sensitive and versatile fluorescence assay of polyamide-DNA interactions and polyamide properties that can be used to determine binding constants, extinction coefficients, and binding kinetics. Given the nature of the assay design, its application could easily prove useful in the study of other DNA-binding molecules.
Supplementary Material
Acknowledgements
The authors are grateful to L. Hicks and Z. Liu at the Danforth Plant Science Center for high resolution mass spectrometry data, and to the reviewers for their suggestions.
Footnotes
This is a PDF file of an unedited manuscript that has been accepted for publication. As a service to our customers we are providing this early version of the manuscript. The manuscript will undergo copyediting, typesetting, and review of the resulting proof before it is published in its final citable form. Please note that during the production process errors may be discovered which could affect the content, and all legal disclaimers that apply to the journal pertain.
This research is supported by NIH R01 AI083803-02 awarded to JKB.
REFERENCES
- 1.Dervan PB, Edelson BS. Recognition of the DNA minor groove by pyrrole-imidazole polyamides. Curr Opin Struct Biol. 2003;13:284–299. doi: 10.1016/s0959-440x(03)00081-2. [DOI] [PubMed] [Google Scholar]
- 2.Neidle S. DNA minor-groove recognition by small molecules. Nat Prod Rep. 2001;18:291–309. doi: 10.1039/a705982e. [DOI] [PubMed] [Google Scholar]
- 3.Urbach AR, Dervan PB. Toward rules for 1:1 polyamide:DNA recognition. Proc Natl Acad Sci U S A. 2001;98:4343–4348. doi: 10.1073/pnas.081070798. [DOI] [PMC free article] [PubMed] [Google Scholar]
- 4.Pelton JG, Wemmer DE. Structural characterization of a 2:1 distamycin A.d(CGCAAATTGGC) complex by two-dimensional NMR. Proc Natl Acad Sci U S A. 1989;86:5723–5727. doi: 10.1073/pnas.86.15.5723. [DOI] [PMC free article] [PubMed] [Google Scholar]
- 5.Zhang Q, Dwyer TJ, Tsui V, Case DA, Cho J, Dervan PB, Wemmer DE. NMR structure of a cyclic polyamide-DNA complex. J. Am. Chem. Soc. 2004;126:7958–7966. doi: 10.1021/ja0373622. [DOI] [PubMed] [Google Scholar]
- 6.Dickinson LA, Trauger JW, Baird EE, Dervan PB, Graves BJ, Gottesfeld JM. Inhibition of Ets-1 DNA binding and ternary complex formation between Ets- 1, NF-kappaB, and DNA by a designed DNA-binding ligand. J. Biol. Chem. 1999;274:12765–12773. doi: 10.1074/jbc.274.18.12765. [DOI] [PubMed] [Google Scholar]
- 7.Sasaki S, Bando T, Minoshima M, Shinohara K.-i, Sugiyama H. Sequence-specific alkylation by Y-shaped and tandem hairpin pyrrole-imidazole polyamides. Chemistry--A European Journal. 2008;14:864–870. doi: 10.1002/chem.200700571. [DOI] [PubMed] [Google Scholar]
- 8.Edwards TG, Koeller KJ, Slomczynska U, Fok K, Helmus M, Bashkin JK, Fisher C. HPV episome levels are potently decreased by pyrrole-imidazole polyamides. Antiviral Res. 2011;91:177–186. doi: 10.1016/j.antiviral.2011.05.014. [DOI] [PMC free article] [PubMed] [Google Scholar]
- 9.Shinohara K-I, Bando T, Sugiyama H. Anticancer activities of alkylating pyrrole-imidazole polyamides with specific sequence recognition. Anti-Cancer Drugs. 2011;21:228–242. doi: 10.1097/CAD.0b013e328334d8f9. [DOI] [PubMed] [Google Scholar]
- 10.Ueno T, Fukuda N, Tsunemi A, Yao E-H, Matsuda H, Tahira K, Matsumoto T, Matsumoto K, Matsumoto Y, Nagase H, Sugiyama H, Sawamura T. A novel gene silencer, pyrrole-imidazole polyamide targeting human lectin-like oxidized low-density lipoprotein receptor-1 gene improves endothelial cell function. Journal of Hypertension. 2009;27:508–516. doi: 10.1097/hjh.0b013e3283207fe1. [DOI] [PubMed] [Google Scholar]
- 11.Chou CJ, Farkas ME, Tsai SM, Alvarez D, Dervan PB, Gottesfeld JM. Small molecules targeting histone H4 as potential therapeutics for chronic myelogenous leukemia. Mol Cancer Ther. 2008;7:769–778. doi: 10.1158/1535-7163.MCT-08-0130. [DOI] [PMC free article] [PubMed] [Google Scholar]
- 12.Jenkins TC. Optical absorbance and fluorescence techniques for measuring DNA-drug interactions. Methods Mol Biol. 1997;90:195–218. doi: 10.1385/0-89603-447-X:195. [DOI] [PubMed] [Google Scholar]
- 13.Wheate NJ, Brodie CR, Collins JG, Kemp S, Aldrich-Wright JR. DNA intercalators in cancer therapy: organic and inorganic drugs and their spectroscopic tools of analysis. Mini Rev Med Chem. 2007;7:627–648. doi: 10.2174/138955707780859413. [DOI] [PubMed] [Google Scholar]
- 14.Zhang H, Wang J, Wu Y, Yuan G, Al X, Wang L, Zhang J. Fluorescence dynamics of interactions between polyamide PyPyPybDp and DNA. Science in China: Series B Chemistry. 2006;49:75–80. [Google Scholar]
- 15.Westrate L, Mackay H, Brown T, Nguyen B, Kluza J, Wilson WD, Lee M, Hartley JA. Effects of the N-terminal acylamido group of imidazole- and pyrrole-containing polyamides on DNA sequence specificity and binding affinity. Biochemistry. 2009;48:5679–5688. doi: 10.1021/bi900242t. [DOI] [PubMed] [Google Scholar]
- 16.Reddy P, Jindra P, Satz A, Bruice T. Sequence selective recognition in the minor groove of dsDNA by pyrrole, imidazole-substituted bis-benzimidazole conjugates. J. Am. Chem. Soc. 2003;125:7843–7848. doi: 10.1021/ja035116k. [DOI] [PubMed] [Google Scholar]
- 17.Groger K, Baretic D, Piantanida I, Marjanovic M, Kralj M, Grabar M, Tomic S, Schmuck C. Guanidiniocarbonyl-pyrrole-aryl conjugates as nucleic acid sensors: switch of binding mode and spectroscopic responses by introducing additional binding sites into the linker. Org Biomol Chem. 2011;9:198–209. doi: 10.1039/c0ob00103a. [DOI] [PubMed] [Google Scholar]
- 18.Chenoweth DM, Viger A, Dervan PB. Fluorescent sequence-specific dsDNA binding oligomers. J Am Chem Soc. 2007;129:2216–2217. doi: 10.1021/ja0682576. [DOI] [PMC free article] [PubMed] [Google Scholar]
- 19.Crowley KS, Phillion DP, Woodard SS, Schweitzer BA, Singh M, Shabany H, Burnette B, Hippenmeyer P, Heitmeier M, Bashkin JK. Controlling the intracellular localization of fluorescent polyamide analogues in cultured cells. Bioorg Med Chem Lett. 13:1565–1570. doi: 10.1016/s0960-894x(03)00152-5. [DOI] [PubMed] [Google Scholar]
- 20.Mackay H, Brown T, Sexton JS, Kotecha M, Nguyen B, Wilson WD, Kluza J, Savic B, O'Hare C, Hochhauser D, Lee M, Hartley JA. Targeting the inverted CCAAT Box-2 of the topoisomerase IIalpha gene: DNA sequence selective recognition by a polyamide-intercalator as a staggered dimer. Bioorg Med Chem. 2008;16:2093–2102. doi: 10.1016/j.bmc.2007.10.059. [DOI] [PubMed] [Google Scholar]
- 21.Trauger JW, Dervan PB. Footprinting methods for analysis of pyrrole-imidazole polyamide/DNA complexes. Methods Enzymol. 2001;340:450–466. doi: 10.1016/s0076-6879(01)40436-8. [DOI] [PubMed] [Google Scholar]
- 22.Woods CR, Ishii T, Wu B, Bair KW, Boger DL. Hairpin versus extended DNA binding of a substituted beta-alanine linked polyamide. J Am Chem Soc. 2002;124:2148–2152. doi: 10.1021/ja0122039. [DOI] [PubMed] [Google Scholar]
- 23.Baird EE, Dervan PB. Solid phase synthesis of polyamides containing imidazole and pyrrole amino acids. J. Am. Chem. Soc. 1996;118:6141–6146. [Google Scholar]
- 24.Chenoweth DM, Harki DA, Dervan PB. Solution-phase synthesis of pyrrole-imidazole polyamides. J Am Chem Soc. 2009;131:7175–7181. doi: 10.1021/ja901307m. [DOI] [PMC free article] [PubMed] [Google Scholar]
- 25.Pierens GK, Carroll AR, Davis RA, Palframan ME, Quinn RJ. Determination of analyte concentration using the residual solvent resonance in 1H NMR spectroscopy. J Nat Prod. 2008;71:810–813. doi: 10.1021/np8000046. [DOI] [PubMed] [Google Scholar]
- 26.Conlan LH, Dupureur CM. Dissecting the metal ion dependence of DNA binding by PvuII endonuclease. Biochemistry. 2002;41:1335–1342. doi: 10.1021/bi015843x. [DOI] [PubMed] [Google Scholar]
- 27.King J, Bowen L, Dupureur CM. Binding and conformational analysis of phosphoramidate-restriction enzyme interactions. Biochemistry. 2004;43:8551–8559. doi: 10.1021/bi049509n. [DOI] [PubMed] [Google Scholar]
- 28.Reid S, Parry D, Liu H-H, Connolly BA. Binding and recognition of GATATC target sequences by the EcoRV restriction endonuclease. Biochemistry. 2001;40:2484–2494. doi: 10.1021/bi001956p. [DOI] [PubMed] [Google Scholar]
- 29.Fox K. DnaseI Footprinting. Totowa, NJ: Humana Press; 1997. [Google Scholar]
- 30.Wang CC, Ellervik U, Dervan PB. Expanding the recognition of the minor groove of DNA by incorporation of beta-alanine in hairpin polyamides. Bioorg Med Chem. 2001;9:653–657. doi: 10.1016/s0968-0896(00)00282-0. [DOI] [PubMed] [Google Scholar]
- 31.Bando T, Minoshima M, Kashiwazaki G, Shinohara K, Sasaki S, Fujimoto J, Ohtsuki A, Murakami M, Nakazono S, Sugiyama H. Requirement of beta-alanine components in sequence-specific DNA alkylation by pyrrole-imidazole conjugates with seven-base pair recognition. Bioorg Med Chem. 2008;16:2286–2291. doi: 10.1016/j.bmc.2007.11.064. [DOI] [PubMed] [Google Scholar]
- 32.Neubauer H, Gaiko N, Berger S, Schaffer J, Eggeling C, Tuma J, Verdier L, Seidel CA, Griesinger C, Volkmer A. Orientational and dynamical heterogeneity of rhodamine 6G terminally attached to a DNA helix revealed by NMR and single-molecule fluorescence spectroscopy. J Am Chem Soc. 2007;129:12746–12755. doi: 10.1021/ja0722574. [DOI] [PubMed] [Google Scholar]
- 33.Chenoweth DM, Dervan PB. Structural basis for cyclic Py-Im polyamide allosteric inhibition of nuclear receptor binding. J Am Chem Soc. 2010;132:14521–14529. doi: 10.1021/ja105068b. [DOI] [PMC free article] [PubMed] [Google Scholar]
- 34.Wilson DO, Johnson P, McCord BR. Nonradiochemical DNase I footprinting by capillary electrophoresis. Electrophoresis. 2001;22:1979–1986. doi: 10.1002/1522-2683(200106)22:10<1979::AID-ELPS1979>3.0.CO;2-A. [DOI] [PubMed] [Google Scholar]
- 35.Mitra S, Shcherbakova IV, Altman RB, Brenowitz M, Laederach A. High-throughput single-nucleotide structural mapping by capillary automated footprinting analysis. Nucleic Acids Res. 2008;36:e63. doi: 10.1093/nar/gkn267. [DOI] [PMC free article] [PubMed] [Google Scholar]
- 36.Conlan LH, Dupureur CM. Multiple metal ions drive DNA association by PvuII endonuclease. Biochemistry. 2002;41:14848–14855. doi: 10.1021/bi026403o. [DOI] [PubMed] [Google Scholar]
- 37.Rich RL, Myszka DG. Advances in surface plasmon resonance biosensor analysis. Curr Opin Biotechnol. 2000;11:54–61. doi: 10.1016/s0958-1669(99)00054-3. [DOI] [PubMed] [Google Scholar]
- 38.Ansari AZ, Mapp AK, Nguyen DH, Dervan PB, Ptashne M. Towards a minimal motif for artificial transcriptional activators. Chem Biol. 2001;8:583–592. doi: 10.1016/s1074-5521(01)00037-0. [DOI] [PubMed] [Google Scholar]
- 39.Brenowitz M, Senear DF, Shea MA, Ackers GK. Quantitative DNase footprint titration: a method for studying protein-DNA interactions. Methods Enzymol. 1986;130:132–181. doi: 10.1016/0076-6879(86)30011-9. [DOI] [PubMed] [Google Scholar]
Associated Data
This section collects any data citations, data availability statements, or supplementary materials included in this article.


