Abstract
Previous studies have shown that skeletal muscle diffusion tensor imaging (DTI) can non-invasively probe changes in the muscle fiber architecture and microstructure in diseased and damaged muscles. However, DTI fiber reconstruction in small muscles and in muscle regions close to aponeuroses and tendons remains challenging because of partial volume effects. Increasing the spatial resolution of skeletal muscle single-shot diffusion weighted (DW)-EPI can be hindered by the inherently low SNR of muscle DW-EPI due to the short muscle T2 and the high sensitivity of single-shot EPI to off-resonance effects and T2* blurring. In the present work, eddy-current compensated diffusion-weighted stimulated echo preparation is combined with sensitivity encoding (SENSE) to maintain good SNR properties and reduce the sensitivity to distortions and T2* blurring in high resolution skeletal muscle single-shot DW-EPI. An analytical framework is developed for optimizing the reduction factor and diffusion weighting time to achieve maximum SNR. Arguments for the selection of the experimental parameters are then presented considering the compromise between SNR, B0-induced distortions, T2* blurring effects and tissue incoherent motion effects. Based on the selected parameters in a high resolution skeletal muscle single-shot DW-EPI protocol, imaging protocols at lower acquisition matrix sizes are defined with matched bandwidth in the phase-encoding direction and SNR. In vivo results show that high resolution skeletal muscle DTI with minimized sensitivity to geometric distortions and T2* blurring is feasible using the proposed methodology. In particular, a significant benefit is demonstrated from reducing partial volume effects on resolving multi-pennate muscles and muscles with small cross sections in calf muscle DTI.
Keywords: skeletal muscle, high resolution DTI, stimulated echo, single-shot EPI
INTRODUCTION
Diffusion-weighted (DW) MRI combined with diffusion tensor imaging (DTI) encoding (1) and fiber tracking algorithms (2) has emerged as an important non-invasive tool in the characterization of skeletal muscle fiber architecture (3–7), microstructure (8–12) and microvasculature (13) with applications in the study of muscle edema (14,15), muscle denervation (16), muscle injury (17), muscle regeneration (18), muscle aging (19), and biomechanics (20). Diffusion tensor metric maps and DTI-based skeletal muscle fiber tracking results have been shown in studies of the human calf (7,21), thigh (22) and forearm (23) muscles. In contrast to white matter tracts, muscle fiber tracts in general run parallel to each other within the muscle fiber bundles and do not show any crossings. However, muscle fiber architecture can vary in space in regions where fibers of different muscles merge. Therefore, high resolution skeletal muscle DTI is necessary in order to resolve muscles with small cross section and to delineate the fiber architecture in multi-pennate muscles and in the boundaries between different muscles (close to aponeuroses and near tendons) (24,25).
Although high resolution skeletal muscle DTI is necessary, high resolution DTI based on single-shot DW-EPI is limited by the short muscle T2 and the associated long gradient EPI readouts. The short muscle T2 relaxation time results in low SNR (26) and hinders any further potential TE increase related to the implementation of eddy currents compensation schemes. Furthermore, the long gradient EPI readouts associated with large matrix sizes induce distortions due to off resonance effects and T2*-blurring due to the short muscle T2* (25).
Stimulated-echo preparation has been proposed to overcome the SNR limitations in DWI of tissues with short T2 (27,28). Although stimulated echo preparation results in a 50% signal reduction compared to spin echo preparation, stimulated echo preparation allows achieving high b-values by increasing the mixing time instead of the echo time and can reduce T2-related signal loss. Therefore, stimulated echo preparation can be beneficial to spin-echo in terms of SNR for achieving high b-values in tissues with moderate T2 values and for achieving moderate and high b-values in tissues with short T2 values (29). Furthermore, the use of stimulated echo preparation enables eddy current compensation by placing gradients in the mixing time interval without additional TE increase (30). Specifically, Steidle et al. have shown that the stimulated echo prepared DW-EPI with additional eddy current compensating gradients during the mixing time and optimized diffusion timing results in higher SNR than the twice-refocused spin-echo prepared DW-EPI in skeletal muscle at 1.5 T (30).
Parallel imaging has been extensively used to decrease B0 inhomogeneity-induced and susceptibility-induced distortions and T2* blurring in single-shot DW-EPI and it is currently routinely used in brain DWI (31,32). Although parallel imaging reduces the gradient readout duration, it has been also shown to increase the SNR by reducing the echo time in high resolution scans compared to the non-parallel imaging case (33). The influence of sensitivity encoding (SENSE) (34) on image properties has been extensively studied in previous brain studies and the SNR efficiency of SENSE has been optimized in single-shot spin-echo DW-EPI (33,35).
The purpose of the present study is to enable single-shot DW-EPI of skeletal muscle at high spatial resolution, alleviating distortions and T2* blurring, by combining the eddy-current compensated stimulated echo preparation with SENSE. An analytical framework is first formulated for the optimization of the eddy-current compensated stimulated echo preparation timing and the SENSE reduction factor in order to maximize SNR. Arguments for the selection of the experimental parameters are then presented considering the compromise between SNR, B0-induced distortions, T2* blurring effects and tissue incoherent motion effects. Based on the selected protocol parameters, a systematic analysis of the partial volume effects in muscle DTI using the stimulated echo preparation at varying spatial resolution with matched bandwidth in the phase-encoding direction and SNR is adopted. Specifically, the benefits from the use of the present methodology are studied in the context of resolving multi-pennate muscles and muscles with small cross sections in the middle and proximal calf region of three healthy volunteers.
MATERIALS AND METHODS
Pulse sequence timing
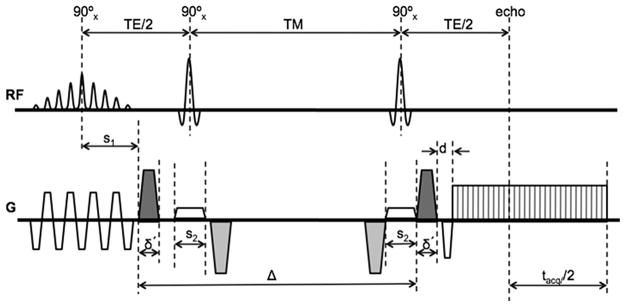
The schematic of a diffusion-weighted stimulated echo EPI sequence is shown in Figure 1. The left dephasing diffusion gradient is positioned adjacent to the excitation pulses so that the time separation Δ between the diffusion gradients is maximized. Additional gradients are added during the mixing time (TM) to compensate for eddy currents without prolonging the echo time (TE), as it was proposed by Steidle et al. (30). Fat suppression is performed using a spatial spectral water excitation pulse and SENSE is used to reduce the gradient readout duration tacq and TE.
Figure 1.
Schematic of eddy-current compensated stimulated-echo prepared DW-EPI pulse sequence. Diffusion-weighting gradients are in black and eddy current compensating gradients are in gray.
If γ is the proton gyromagnetic ratio and g, δ and r are the amplitude, plateau and ramp time of the diffusion gradients respectively (δ′ =δ+2r), the b-value is given by the equation:
| (1) |
For a given b-value, g, r, and Δ, Eq. [1] can be reformatted as a third order polynomial of the diffusion gradient duration δ and it can be solved for δ.
The sequence timing depends on the duration of the EPI readout tacq, which depends on the employed acquisition matrix size N and the parallel imaging reduction factor R. Based on the sequence timing (shown in Fig. 1) and the fact that in most practical cases the echo time is limited by the interval between the third RF pulse and the echo in the stimulated echo sequence, the echo time and the mixing time are given by the equations:
| (2) |
| (3) |
where pF is the partial Fourier factor, s1 is the isodelay of the excitation pulse, s2 is the duration of the second and third 90° pulse and d is the duration of the readout gradient dephaser. If esp(N) is the echo-spacing in the EPI readout for a given acquisition matrix size N (using ramp sampling), the duration of the EPI readout is:
| (4) |
SNR analysis
The SNR is simulated as a function of the SENSE reduction factor R and the diffusion time Δ. For given b-value, matrix size, and partial Fourier factor (pF), the analysis takes into account the SNR loss due to T2 relaxation over the echo time TE (30), T1 relaxation over the mixing time TM (30), the mean geometry factor over the entire FOV for a particular coil geometry (33) and the reduced data acquisition window by (33). The relative SNR equation is:
| (5) |
SNR0 is the SNR without parallel imaging (R=1) and without T1- and T2- weighting, taking into account the voxel size, number of averages and the readout duration:
| (6) |
Distortion and T2* blurring analysis
The velocity of traversing k-space in the phase-encoding direction is given by the equation:
| (7) |
The distortion in the phase encoding direction for a given off-resonance Δf (induced by B0 inhomogeneity, susceptibility difference or chemical shift difference) is described by the equation (36):
| (8) |
The point spread function (PSF) along the phase encoding direction is also simulated as a function of R taking into account T2* blurring, as it has been previously described in (35). The simulations of the PSF use skeletal muscle T2* values borrowed from the literature. The full-width half maximum of the point spread function (PSF) is used as a metric of the effective resolution.
Study of partial volume effects
To understand the partial volume effect in delineating muscle fiber architecture a systematic analysis of data acquired at different spatial resolutions is adopted (37). Experimental protocols with different matrix sizes are determined with variable reduction factors and number of averages. Specifically, the reduction factor is changed for different matrix sizes to maintain the phase encoding k-space velocity constant in order to maintain the same relative B0-induced distortion (described by Eqs. [7] and [8]) and T2* blurring. The number of averages is also changed to keep the SNR constant, combing Eqs. [5] and [6]. Table 1 summarizes the acquisition parameters used for protocols with 80×80, 96×96 and 128×128 acquisition matrix sizes.
Table 1.
DW-EPI imaging protocol parameters for different acquisition matrices designed to maintain the phase-encoding k-space velocity and SNR constant.
| N | voxel size (mm) | R | esp (ms) | Navg | vky (kHz) | relative SNR | acquisition time (min) |
|---|---|---|---|---|---|---|---|
| 80 | 2.50 | 2.38 | 0.600 | 2 | 3.97 | 1.035 | 4 |
| 96 | 2.08 | 2.56 | 0.652 | 3 | 3.93 | 0.963 | 6 |
| 128 | 1.56 | 2.86 | 0.732 | 8 | 3.91 | 1.000 | 16 |
Eddy currents compensation
Steidle et al. have computed the required duration of eddy current compensating gradient to null the eddy current of a given time constant (30). They used a time constant equal to 100 ms to select the duration of the eddy current compensating gradient (δc) and they observed that a significant reduction of eddy current effects can be achieved even for only roughly adjusted compensation gradient pulses (30). It is known that a variety of time constants can be present on whole-body MRI systems and Finsterbusch recently proposed a double spin-echo prepared technique to compensate for eddy currents of different time constants (38). Therefore, the present eddy current compensating gradient duration is selected with the idea that the residual eddy current be less than 10% of the nominal eddy current for all time constants less than a certain value and then to minimize the value of this time constant. The nominal eddy current is defined as the uncompensated eddy current generated by a single ramp.
In vivo measurements
An eight-channel lower extremity coil (Invivo, USA) was used to scan the calf muscle of three healthy subjects (A, B and C-male volunteers, age range 26–29 years) on a 3 T full-body scanner (General Electric Healthcare, Waukesha, WI, USA). In all subjects, the coil was positioned first in the middle calf region and then the coil was positioned more proximally relative to the subject’s leg, close to the knee (by shifting the coil relative to the subject’s leg). Gross leg motion was avoided by padding the space between the leg musculature and the coil tightly, and by supporting and positioning the ankle to the best of the subject’s comfort. DTI measurements were performed using the eddy current compensated stimulated-echo prepared DW single-shot EPI sequence of Fig. 1 with the following parameters: TR/TE=4000/31 ms, FOV=20×20 cm2, 12 slices with 7 mm thickness, partial Fourier factor of 0.625, δ/Δ=6/170 ms, 30 directions, b=700 s/mm2. Three different acquisition matrices (80×80, 96×96, 128×128) with variable reduction factors and number of averages were used to compare the effect of spatial resolution on the DTI metrics, as shown in Table 1. The reconstruction matrix size matched the acquisition matrix size for every DTI scan. Ten b=0 images were acquired in every DTI scan. SNR values were measured from the b=0 images of all three subjects for both leg sites at all three acquisition matrices based on the difference method (39). The SNR calculations were based on ROIs in the tibialis anterior (TA) muscle region for the middle calf slice and in the medial gastrocnemius muscle (MG) region for the proximal calf slice. An additional DTI scan was performed for the high acquisition matrix size (128×128) with low reduction factor (R=1.33) to make comparisons with the high reduction factor (R=2.86) scan addressing the sensitivity to B0-induced distortions and T2* blurring.
The calf muscle region scanned with the DW-EPI sequence (12 slices with 7 mm thickness and FOV=20×20 cm2) was also scanned with additional sequences for the purposes of measuring the fieldmap, measuring geometry factor maps and acquiring high resolution anatomical images. Axial fast spin-echo (FSE) T1-weighted images with different echo shifts and with identical shimming to the DTI scans were acquired to measure the fieldmap variation across the calf muscle cross section in the DTI scans. The acquisition parameters for the echo shifted FSE scan were: 3 echoes, TR/TEmin/ΔTE=1000/8.2/0.8 ms, echo train length=9, 256×256 acquisition matrix, receiver bandwidth=50 kHz. The iterative decomposition of water and fat with echo asymmetry and least squares estimation (IDEAL) algorithm (40) was employed to measure the fieldmap in the presence of water and fat components. Geometry factor maps were measured from noise maps computed in all subjects using 2D spoiled gradient echo images with acquisition parameters: TR/TE=40/4.8 ms, flip angle=20°, 256×256 acquisition matrix, receiver bandwidth=31.25 kHz. FSE T2-weighted images with fat suppression (using chemical saturation) were also acquired for anatomical reference. The acquisition parameters for the FSE T2-weighted scan were: 384×192 acquisition matrix, TR/TE=6000/50 ms, echo train length=12, receiver bandwidth=31.25 kHz, Nex=2.
Since skeletal muscle DTI is sensitive to tissue incoherent motion effects originating from blood pulsation and other sources (involuntary muscle contractions, table vibrations) (41,42), the benefit of physiological gating in DTI scans was investigated in a fourth subject. A single middle-calf slice of the subject (subject D, male with age 29 years) was also scanned to address the dependence of tissue incoherent motion effects on diffusion time and on physiological gating in DTI of muscle regions close to vessels, acquiring 80 repetitions of the same DW-image (with A/P diffusion encoding direction and b=700 s/mm2). Three non-triggered acquisitions were first performed with different diffusion times (Δ=100, 170 and 250 ms), diffusion gradient durations (δ=8, 6 and 4.8 ms) and echo times (TE=35, 31 and 29 ms) at the same b-value (b=700 s/mm2) and with TR= 3 s to characterize the dependence of tissue incoherent motion effects on diffusion time. Three triggered acquisitions were then performed with the same diffusion preparation (Δ/δ/TE=170/6/31 ms) and different trigger delays (15, 215 and 415 ms) at the same b-value (b=700 s/mm2) and with TR= 3 R-R intervals (average subject’s R-R interval was 1 s) to characterize the dependence of tissue incoherent motion effects on physiological gating. The triggered acquisitions were peripherally gated using the scanner’s pulse oximeter. Standard deviation maps were computed from the 80 repetitions of the single acquired DW-image and normalized with the median of the 80 repetitions at every voxel.
DTI processing
The RESTORE algorithm (43) is implemented in order to remove outlier data in the DTI acquisitions originating from tissue incoherent motion. The RESTORE algorithm is performed in two steps. In the first step, points lying outside a confidence interval (set to three times the expected signal standard deviation) are identified as outliers based on an iterative reweighting procedure. In the second step, the outliers are excluded and the remaining data points are equally weighted in a non-linear least squares fitting. In the present implementation of RESTORE, the raw diffusion-weighted images are first median filtered with a 3×3 window and then used for the outlier detection step. The raw-unfiltered diffusion-weighted data, excluding the outlier data, is then used for the final tensor fit step. In the present implementation, the identification of outliers is done for all voxels based on the standard deviation of the signal as measured in the ROIs used for the SNR calculations.
The orientation of the primary eigenvector of the diffusion tensor is defined by using the zenith angle and the azimuth angle values. The primary eigenvectors maps are first transformed so that all eigenvectors have positive z-components. The zenith angle corresponds to the angle between the primary tensor eigenvector and the positive z-axis and the azimuth angle corresponds to the angle between the projection of the primary tensor eigenvector on the xy-plane and the positive x-axis. Using the above convention, the zenith angle should vary between 0 and 90 degrees and the azimuth angle should vary between 0 and 360 degrees. However, in the present work the azimuth angle is allowed to vary only between 0 and 180 degrees by computing the angle between the projection of the primary tensor eigenvector on the xy plane and the positive x-axis for eigenvectors with positive y-component and the angle between the projection of the primary tensor eigenvector on the xy-plane and the negative x-axis for eigenvectors with negative y-component. This way the visualization of different muscles in the colormaps of the azimuth angle is facilitated.
Cone of uncertainty
To address the uncertainty in the estimation of the fiber direction, the analytical framework of Koay et al. for error propagation in DTI measurements was adopted (44). Under this framework, the uncertainty in the diffusion-weighted signal expressed by the SNR of the b=0 images can be translated into uncertainty in the diffusion tensor elements or diffusion tensor quantities. The uncertainty in the primary eigenvector orientation can be expressed by a cone, which for diffusion tensors with non-equal secondary and tertiary eigenvalues has been shown to be elliptical (45). In the present analysis, the major and minor axes of the elliptical cone of uncertainty were calculated with a confidence level equal to 0.68 (corresponding to the area covering the two tails of the normal distribution at one standard deviation apart from the center). The calculation was based on the experimentally measured SNR, the experimental diffusion encoding scheme (30 diffusion directions and b=700 s/mm2) and representative values for the muscle diffusion tensor eigenvalues (λ1/λ2/λ3=1.85/1.26/1.00 10−9 m2/s measured in the TA muscle of subject A).
RESULTS
Trade-offs in echo preparation and SENSE
Simulations were performed for studying the influence of stimulated echo preparation timing and SENSE on image properties using gradient hardware limits with maximum gradient strength of 40 mT/m and maximum slew rate of 150 mT/(m ms), T1/T2/T2*=1500/30/25 ms (46), 128×128 matrix size, b=700 s/mm2 and the mean geometry factor values from the in vivo scan of subject A. Figure 2a shows the iso-contour lines of normalized SNR in the R-Δ plane. The SNR values are normalized to the maximum SNR value. If Ropt and Δopt are the reduction factor and diffusion time values at the maximum SNR point, Fig. 2b shows the variation of the SNR with the diffusion time at R=Ropt and Fig. 2c shows the variation of the SNR with the reduction factor at Δ=Δopt. As the diffusion time increases for a constant reduction factor, the T1-related signal loss during the mixing time TM increases, but the T2-related signal loss during the echo time TE decreases. As it has been shown by Steidle et al. (30), there is an optimal diffusion time for which the SNR is maximized. However, as Fig. 2b shows there is only a small decrease in SNR (of the order of 3%) for a diffusion time varying between 150 ms and 350 ms. As the reduction factor increases for a constant diffusion time, the signal decreases due to the decrease in the duration of the EPI readout, but the T2-related signal loss during the echo time TE decreases. Therefore, there is an optimal reduction factor maximizing SNR performance (Fig. 2c).
Figure 2.
SNR dependence on diffusion time and reduction factor: (a) relative SNR variation as a function of diffusion time and SENSE reduction factor, (b) relative SNR variation as a function of diffusion time at optimal reduction factor, and (c) relative SNR variation as a function of reduction factor at optimal diffusion time.
Simulations were performed to compare the relaxation-induced signal loss between the twice-refocused spin echo diffusion-weighted preparation and the eddy current compensated stimulated echo diffusion-weighted preparation (with Δ=Δopt and Δ=0.7 Δopt at R=1.51) as function of b-value for the SNR optimal reduction factor of the stimulated echo preparation (Figure 3). The results show that stimulated echo preparation leads to higher SNR values compared to the twice-refocused spin echo preparation for b>290 s/mm2. Furthermore, a reduction of diffusion time by 30% from the SNR optimal diffusion time results in negligible SNR loss (of the order of 1.5%), as Figure 3 shows.
Figure 3.
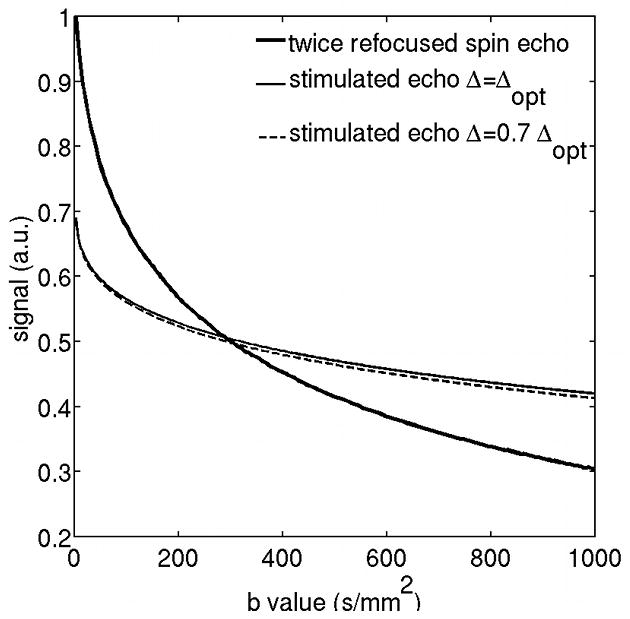
Relaxation-induced SNR loss comparison between the twice-refocused spin echo preparation and the eddy current compensated stimulated echo diffusion-weighted preparation (with Δ=Δopt and Δ=0.7 Δopt) as function of b-value (R=1.51).
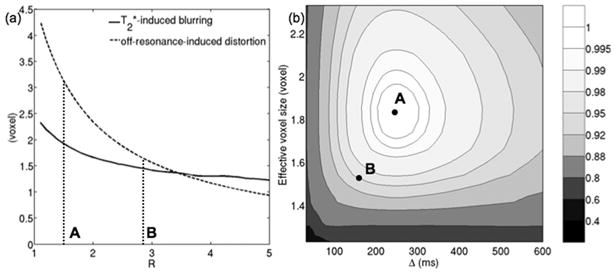
Simulations were also performed to quantify the effect of parallel imaging on the T2*-induced spatial resolution loss in the phase encoding direction and on the extent of geometric distortions. The solid line in Fig. 4a shows the effect of the variation of the reduction factor on the T2*-induced effective resolution in the phase encoding direction. The dashed line in Fig. 4a shows the effect of the variation of the reduction factor on off-resonance-induced distortion (for a representative fieldmap value Δf=50 Hz, given the measured fieldmap in the three subjects) along the phase encoding direction. Increased reduction factors result in high k-space velocities in the phase encoding direction and lead to reduced T2*-induced blurring and reduced off-resonance-induced distortions.
Figure 4.
Trade-off between phase encoding bandwidth and SNR: (a) T2* blurring and B0-induced-distortion (for Δf=50 Hz) dependence on reduction factor and (b) selection of optimal experimental parameters based on the variation of relative SNR with diffusion time and with effective voxel size that takes into account T2* blurring effects. Point A corresponds to sequence parameters that result in maximal SNR (R = 1.51, Δ = 249 ms), Point B corresponds to sequence parameters that provide a compromise between SNR, geometric distortion, blurring and tissue incoherent motion effects (R = 2.86, Δ = 170 ms).
The selection of sequence parameters should take into account the trade-off between SNR and the sensitivity to T2* blurring and off-resonance effects. The results of Figs. 2a and 4a are combined in Fig. 4b, where the iso-contour lines of the normalized SNR are plotted in the plane of diffusion time and effective voxel size (that takes into account T2* blurring). Point A (Δopt=249 ms, Ropt=1.51) corresponds to the maximal SNR performance. However, there is a moderate decrease in SNR for Δ lower than Δopt (Fig. 2b) and since lower values of Δ could also reduce the sensitivity to tissue incoherent motion, they are preferable. In addition, there is only a moderate decrease in SNR for R higher than Ropt, and since higher values of R reduce the sensitivity to T2* blurring and off-resonance effects, they are preferable. Specifically, point B (Δ=170 ms, R=2.86) would reduce the diffusion time by 32% (Fig. 4b), reduce the T2*-induced blurring by 25% (Fig. 4a) and the geometric distortion induced by an off-resonance effect of the order of 50 Hz by 48% (Fig. 4a) with only a moderate decrease in SNR by 13% (Fig. 4b). Therefore, an increase of the reduction factor from 1.51 to 2.86 and a decrease of the diffusion time from 249 ms to 170 ms is adopted, as it improves the sensitivity to distortion, T2* blurring and tissue incoherent motion with only a moderate SNR loss.
The SNR-optimal stimulated echo preparation uses short diffusion-weighting gradients (δ=6 ms), for which long time constant eddy currents from the falling ramps can be reduced by the corresponding eddy currents from the risings ramps (30). For eddy currents compensating gradients with duration δc=3.2 ms the eddy current constant above which the residual eddy current is below 10% of the nominal eddy current is minimized. Figure 5 shows the variation of the cumulated residual eddy current from the preparation (Ie) at the beginning of the EPI readout normalized by the eddy current of a single gradient ramp (Io) with the eddy current time constant for the case of the uncompensated sequence and for the cases of the compensated sequence with the duration of the eddy current compensating gradient δc equal to 6 ms or 3.2 ms. The amplitude of residual cumulated eddy current is less than 10% of the nominal value for eddy currents with time constant larger than 62 ms in the case of the stimulated echo preparation without eddy current compensation. By including eddy currents compensating gradients during the mixing time the amplitude of residual cumulated eddy current is less than 10% of the nominal value for eddy currents with time constant larger than 30 ms or 13 ms using δc equal to 6 ms or 3.2 ms respectively. Therefore, a δc equal to 3.2 ms should be preferable than a δc of 6 ms.
Figure 5.
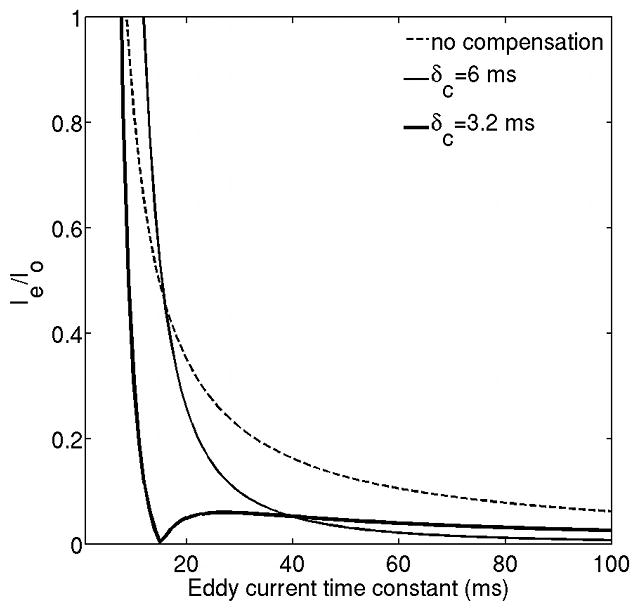
Comparison of residual eddy current from right diffusion-weighting gradient (δ=6 ms) at the beginning of the EPI readout between the stimulated echo prepared DW single-shot EPI without any eddy current compensation, with eddy current compensation and duration of eddy current compensating gradients δc=6 ms and δc=3.2 ms.
In vivo results
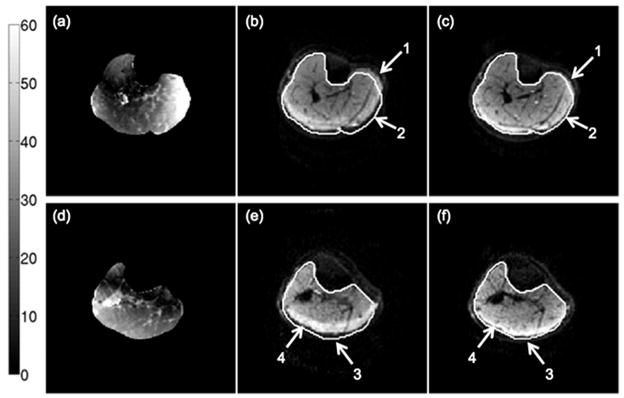
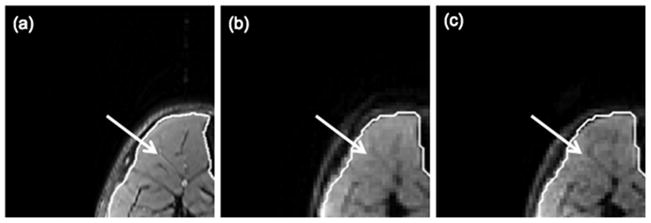
The calf muscle results show a significant benefit from the use of higher reduction factors towards reducing off-resonance-induced distortions and T2*-blurring. Figure 6 shows the effect of increasing the SENSE reduction factor on off-resonance-induced distortions on the b=0 echo planar images. Figures 6a and 6d show the variation of the absolute fieldmap across the imaging FOV. Depending on the performance of the shimming routines and the shape of the imaging site, significant variations of the fieldmap are observed as the distance from the center of the FOV increases. In regions where the fieldmap variation is strong, there are obvious B0-induced distortions (arrows 1–3 in Fig. 6) for the low reduction factor R=1.33. Additionally, strong fat-induced chemical shift artifacts (arrow 4 in Fig. 6) are observed in regions surrounding the subcutaneous fat for the low reduction factor R=1.33. Both chemical shift artifacts and B0-induced distortions are significantly reduced as the reduction factor increases from R=1.33 to R=2.86 (arrows 1–4 in Figs. 6c and 6f). Figure 7 shows the effect of SENSE reduction factor on T2*-induced blurring. The arrow in Fig. 7a points to some connective tissue structure in the tibialis anterior muscle of subject A. This high resolution feature is blurred in the b=0 echo planar image with low reduction factor (Fig. 7b) due to T2*-induced blurring in the phase encoding direction. The blurring effect is significantly reduced as the reduction factor increases from R=1.33 (Fig. 7b) to R=2.86 (Fig. 7c).
Figure 6.
Effect of B0-induced distortions on a middle calf slice (a–c) and a proximal calf slice (d–f) of subject A: (a,d) absolute fieldmap images, (b,e) b=0 images with the N=128 acquisition matrix and R=1.33, and (c,f) b=0 images with the N=128 acquisition matrix and R=2.86. The white line corresponds to the contour of the muscle drawn based on the FSE T2-weighted scan. The colorbar corresponds to the fieldmap values in Hz. The arrows 1, 2 and 3 point to regions affected by severe geometric distortions and the arrow 4 points to a region affected by the olefinic fat chemical shift artifact.
Figure 7.
Effect of T2*-induced blurring on a middle calf slice of subject A: (a) T2-weighted FSE image, (b) b=0 image with the N=128 acquisition matrix and R=1.33, and (c) b=0 image with the N=128 acquisition matrix and R=2.86. The white line corresponds to the contour of the muscle drawn based on the FSE T2-weighted scan. The arrows point to a high resolution feature in the tibialis anterior muscle.
Table 2 summarizes the SNR values for the b=0 images for the scans of both sites (middle calf region and proximal calf region) of the three subjects at the three acquisition matrices employed. Given the variability of the musculature size across the different subjects, the SNR varies depending on the position of the scanned calf region of every subject relative to the coil sensitivity profiles. A minimum SNR equal to 45 was measured in the scanned three subjects. This SNR corresponds to an elliptical cone of uncertainty with a major axis equal to 4.3° and a minor axis equal to 2.9° for the present diffusion encoding scheme and representative values for the muscle diffusion tensor eigenvalues (λ1/λ2/λ3=1.85/1.26/1.00 10−9 m2/s), according to the error propagation framework by Koay et al. (44,45).
Table 2.
SNR values of in vivo b=0 images of the three acquisitions with different matrix sizes of the two sites (mid-calf for middle calf and prox-calf for proximal calf) of the three scanned subjects.
| N | subject A | subject B | subject C | |||
|---|---|---|---|---|---|---|
| mid-calf | prox-calf | mid-calf | prox-calf | mid-calf | prox-calf | |
| 80 | 48 | 46 | 61 | 68 | 76 | 67 |
| 96 | 53 | 45 | 67 | 63 | 72 | 58 |
| 128 | 48 | 51 | 63 | 60 | 77 | 64 |
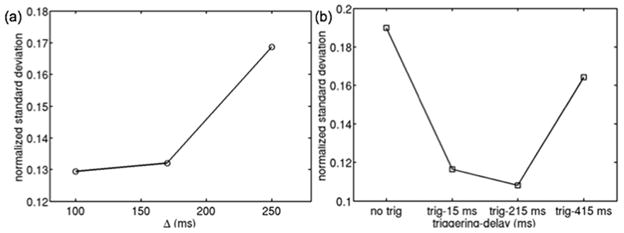
Figure 8a shows the dependence of the normalized standard deviation of DW-signal in a tibialis posterior ROI of subject D on diffusion time for a constant b-value in a non-triggered acquisition. As diffusion time increases, the standard deviation increases implying stronger tissue incoherent motion effects. Figure 8b shows the dependence of the normalized standard deviation of DW-signal in a soleus ROI of subject D on trigger delay for a constant b-value in a triggered acquisition. Triggered acquisitions show lower standard deviation values compared to the non-triggered acquisition. However, there is an increase in the standard deviation for long trigger delays.
Figure 8.
Effect of diffusion time and peripheral gating on DW-signal standard deviation in muscle regions close to vessels of subject D: (a) normalized standard deviation of DW-signal in tibialis posterior ROI for different diffusion times in a non-triggered acquisition, and (b) normalized standard deviation of DW-signal in posterior soleus ROI for Δ=170 ms in a non-triggered acquisition and triggered acquisitions with different trigger delays.
Figure 9 shows the spatial distribution of the percentage of data points identified as outliers by the RESTORE algorithm in the DTI acquisition for two slices of subject B. Regions where vessels are located are identified based on the FSE T2-weighted scans (arrows in Figs. 9a and 9c). Muscle regions close to the vessels are shown to have the highest percentage of outliers identified by the RESTORE algorithm (arrows in Figs. 9b and 9d), primarily due to the strong effect of cardiac pulsation in the muscle regions surrounding the leg vessels. Furthermore, a high percentage of outliers is observed in the muscle regions suffering from the chemical shift artifact induced by the insufficient suppression of the olefinic fat peak (47).
Figure 9.
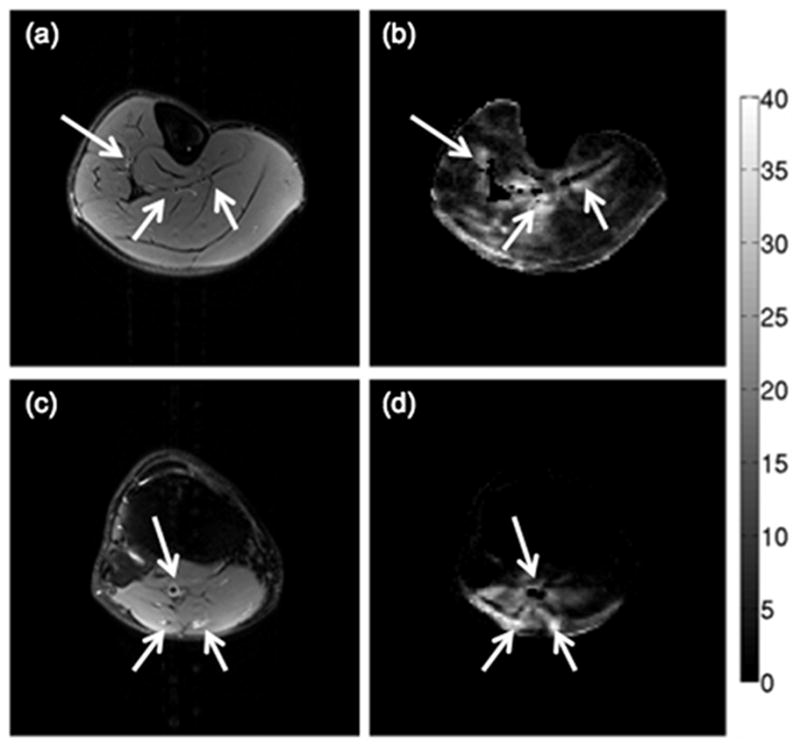
Regions with high percentage of outliers identified by the RESTORE algorithm for a middle calf slice (a–b) and a proximal calf slice (c–d) of subject B: (a,c) T2-weighted FSE images, and (b,d) maps of the percentage of data points identified as outliers by the RESTORE algorithm. The colorbar corresponds to the percentage of data points identified as outliers. The arrows point to vessels identified from the T2-weighted FSE images.
Figures 10 and 11 show the effect of spatial resolution on the derived DTI maps for a middle calf slice and a proximal calf slice of subject A respectively. The bipennate nature of the medial gastrocnemius (MG) muscle is better resolved with the higher resolution scan for the middle calf slice based on the map of the azimuth angle of the primary DTI eigenvector (white arrow in Fig. 10). High resolution DTI reduces partial volume effects in muscles with small muscle cross-sections such as the popliteus muscle in the proximal calf slice (white arrow in Fig. 11). The use of higher SENSE reduction factor in the high resolution scan also reduces the absolute displacement of the olefinic fat chemical shift artifact from the subcutaneous fat (yellow arrows in Figs. 10 and 11).
Figure 10.
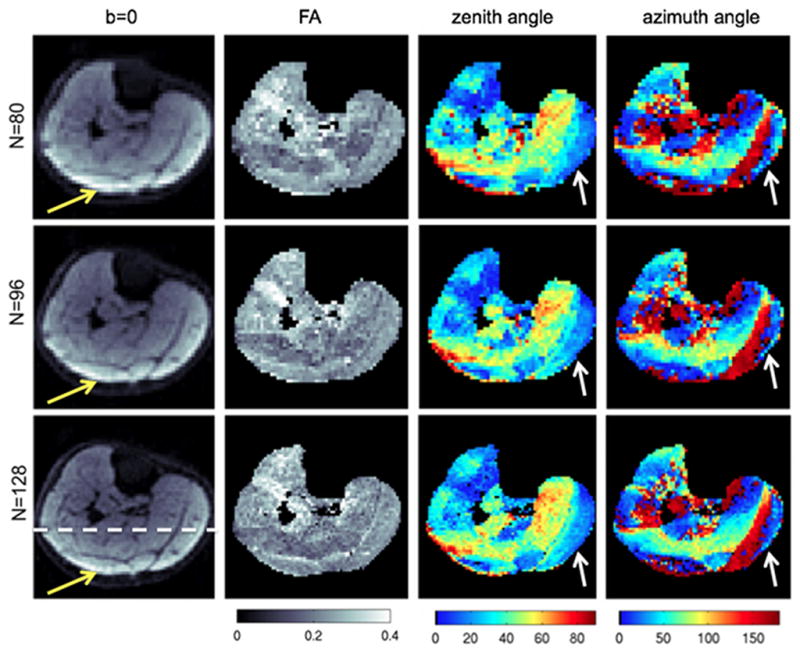
Partial volume effects on DTI maps on a middle calf slice of subject A. The first column shows the b=0 images, the second column shows the FA maps, the third column shows the zenith angle of the primary eigenvector, and the fourth column shows the azimuth angle of the primary eigenvector at three different acquisition matrices: N=80 (first row), N=96 (second row), and N=128 (third row). The white arrows point to the medial gastrocnemius region and the yellow arrows point to the region affected by the olefinic fat chemical shift artifact.
Figure 11.
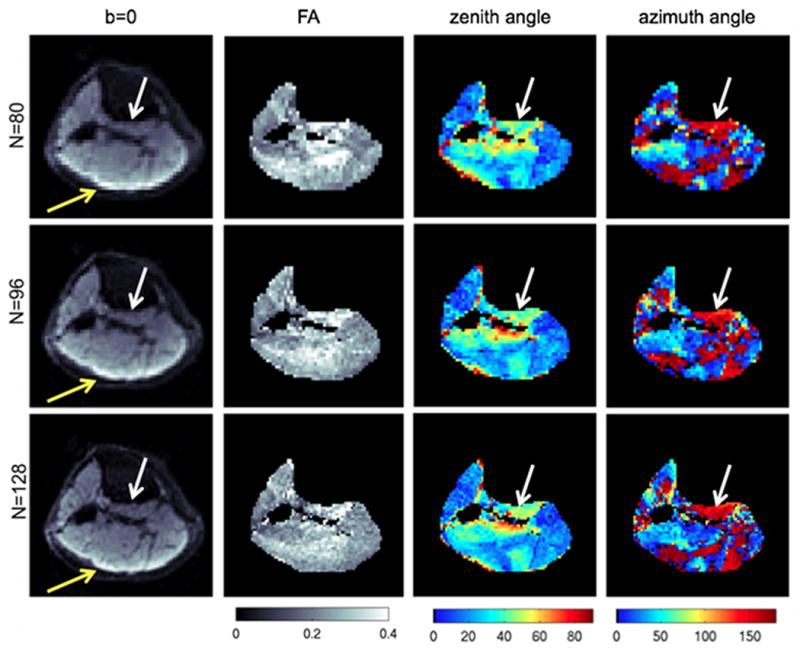
Partial volume effects on DTI maps on a proximal calf slice of subject A. The first column shows the b=0 images, the second column shows the FA maps, the third column shows the zenith angle of the primary eigenvector, and the fourth column shows the azimuth angle of the primary eigenvector at three different acquisition matrices: N=80 (first row), N=96 (second row), and N=128 (third row). The white arrows point to the popliteus muscle region and the yellow arrows point to the region affected by the olefinic fat chemical shift artifact.
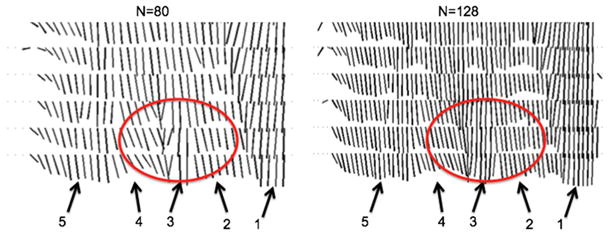
Figures 12 shows the effect of increasing in-plane spatial resolution on resolving the complex architecture of the soleus muscle (48) of subject A by plotting the projection of the primary eigenvector on the coronal plane at the level represented by the dashed line in Figure 10. The different muscles resolved in Figure 12 include the medial gastrocnemius, the medial and lateral parts of the posterior soleus and the medial and lateral parts of the anterior soleus. The medial part of the anterior soleus muscle (arrow 3) is located between the medial part of the posterior soleus (arrow 2) and the lateral part of anterior soleus (arrow 4). The medial part of the anterior soleus muscle (arrow 3) is considerably better resolved for the acquisition with N=128 compared to the acquisition with N=80 (region highlighted by red ellipse in Figure 12).
Figure 12.
Projection of the primary eigenvector on the coronal plane at the level of the dashed line of Figure 10 of subject A (only 6 slices shown) using different in-plane DTI acquisition matrices (80×80 and 128×128). The different muscles resolved include: medial gastrocnemius (arrow 1), medial part of posterior soleus (arrow 2), medial part of anterior soleus (arrow 3), lateral part of anterior soleus (arrow 4), lateral part of posterior soleus (arrow 5). The red circle highlights a soleus region with rapidly varying in space fiber architecture.
DISCUSSION
High resolution skeletal muscle DTI based on single-shot DW-EPI suffers from low SNR, sensitivity to eddy currents, off-resonance effects, T2* blurring and tissue incoherent motion effects. Steidle et al. have shown that eddy-current compensated stimulated echo preparation provides higher SNR compared to eddy-current compensated spin-echo preparation in low resolution DTI of skeletal muscle (30). The present work builds upon the work of Steidle et al. (30) and develops an analytical framework for the SNR-optimization of the stimulated echo preparation when combined with SENSE in order to achieve high resolution skeletal muscle DTI. The present framework does not focus only on maximizing SNR but takes into account the trade-off between SNR, off-resonance induced distortions, effective resolution induced by T2* blurring and signal contamination due to tissue incoherent motion. Based on the above considerations, imaging protocols are designed with variable acquisition matrices, number of averages and reduction factors in order to study the partial volume effect on muscle DTI datasets with different voxel size but with the same SNR, same relative B0-induced distortions and same relative T2*-blurring.
Previous works employing DW single-shot EPI studied how to optimize the SENSE reduction factor in spin-echo preparation and how to optimize the diffusion timing in stimulated echo preparation in order to maximize SNR. The work on the optimization of SENSE reduction factor to maximize SNR in spin echo preparation has demonstrated the balance between the effect of the decrease in T2-induced signal loss due to decrease in TE and the effect of the decrease in readout duration as the reduction factor increases (33,35). The work on the optimization of diffusion timing to maximize SNR in stimulated echo preparation has demonstrated the balance between the effect of the decrease in T2-induced signal loss due to decrease in TE and the effect of the increase in T1-induced signal loss due to increase in TM as the diffusion time increases (29,30). When stimulated echo preparation is employed with SENSE all the above effects should be studied in a combined manner in order to derive the optimal diffusion time and reduction factor to maximize SNR. Our results show that in stimulated echo preparation the use of parallel imaging affects minimally the diffusion time that maximizes SNR. Although the later observation means that the optimal diffusion time and reduction factor that maximize SNR can be independently determined, the present work shows that the design of the stimulated echo preparation should not simply aim to maximize SNR. First, increased diffusion times lead to stronger tissue incoherent motion artifacts and shorter diffusion times are in general favorable in order to reduce the sensitivity of the acquisition to tissue incoherent motion effects, that degrade image quality as well as deteriorate SNR. Second, high resolution muscle DTI scans suffer from B0-induced distortions, fat induced chemical shift artifacts and T2*-induced blurring. Increasing the parallel imaging reduction factor can decrease all three of these effects. Therefore, the design of the stimulated echo preparation in the presence of SENSE should consider SNR, off-resonance, T2* blurring and tissue incoherent motion effects. In the present acquisition with an 8-channel knee coil, a reduction factor of R=2.86 and a diffusion time equal to approximately 70% of the optimal diffusion time provided a good compromise between SNR and reduced distortions, chemical shift artifacts and T2* blurring without any strong aliasing patterns in the acquired in vivo calf muscle images. However, it should be emphasized that the selection of the diffusion time and reduction factor represents a trade-off that cannot be uniquely determined and is in general application-dependent.
Eddy currents compensation is another important aspect that is considered in the evaluation of any diffusion-weighted preparation methodology. The correction or compensation of eddy currents can be performed by either modifying the DW-EPI pulse sequence (38,49,50) or using post-processing approaches based on the DTI data itself (51,52). The insertion of additional gradients during the mixing time is an efficient way to compensate for eddy currents in DW-EPI sequences with stimulated echo preparation without any need to increase TE, and it has been shown to result in higher SNR for the stimulated echo preparation than the twice-refocused spin echo preparation for skeletal muscle (30). An alternative way for noise efficient eddy current compensation would be the use of a single-refocused spin-echo preparation without eddy current compensation, combined with post-processing methodology for eddy current correction (25,53).
Post-processing eddy current correction methods usually rely on registration of the eddy current-prone DW images to the b=0 reference images. Insufficient fat suppression can lead to difference in contrast between the DW images and the b=0 reference images. Therefore, the effect of insufficient suppression of the main (aliphatic) or the olefinic fat peak (47) could complicate the performance of post-processing eddy current correction methods in skeletal muscle DWI. Additionally, the use of short diffusion gradients in stimulated echo preparation reduces the effects of eddy currents when compared to the use of long diffusion gradients in spin echo preparation (30).
An important aspect of DTI processing not studied in previous muscle DTI datasets is the effect of tissue incoherent motion induced by cardiac pulsation and other sources (involuntary muscle contractions, table vibrations). Tissue incoherent motion induces local tissue deformation. This tissue deformation results in intravoxel dephasing and finally signal drop in the diffusion-weighted images. The present results show a significant reduction of diffusion-weighted signal dephasing in regions surrounding vessels when physiological gating is used. However, some areas of increased signal loss remain in the physiologically gated acquisitions suggesting the presence of other sources of tissue incoherent motion (potentially involuntary muscle contractions, table vibrations) (42).
The effect of blood pulsation can be avoided by using physiologically gated acquisitions (54) or by using post-processing methods to remove blood pulsation-induced artifacts (43,55,56). Physiological gating can lengthen the total scan time and the implementation of cardiac/peripheral gating in skeletal muscle can be complicated by the requirement to calibrate the delay between the external triggering signal and the scanned site. In terms of post-processing techniques, the rejection of diffusion-weighted images corrupted by cardiac pulsation has been proposed to overcome the effect of cardiac pulsation on brain DTI data (43). However, to our knowledge, there is only limited previous work on assessing the effect of cardiac pulsation on muscle diffusion-weighted measurements (41,42). The results of the present study show a need to reject up to 30% of the diffusion data points in areas in the vicinity of the calf muscle vessels. Employing the designed stimulated echo acquisition protocol and the DTI processing routine that rejects regions affected by tissue incoherent motion effects in the diffusion-weighted images, the present work provides a systematic analysis of the partial volume effect on calf muscle DTI with acquisitions of different voxels sizes but matched SNR and phase encoding bandwidth. The increase of spatial resolution shows an overall improvement on resolving skeletal muscle fiber architecture based on the colormaps of the Euler angles of the primary eigenvector. Specifically, the characterization of the bipennate nature of the medial gastrocnemius muscle and of the complex fiber architecture of the soleus muscle is shown to be facilitated by the use of high resolution maps of the zenith and azimuth angles of the primary eigenvector. Similarly, muscles with small cross-sectional areas like the popliteus muscle can be better resolved using the high resolution DTI acquisition protocol. Therefore, high resolution skeletal muscle DTI can be advantageous in the study of the multi-pennate muscles and in the study of muscles with reduced cross sectional areas.
Previous studies have employed parallel imaging to increase the spatial resolution of skeletal muscle DTI (20,22,24,25,48,53,57,58). However, to our knowledge there is no previous study assessing the effect of the acquisition voxel size on resolving multi-pennate muscles or muscles with small cross sectional areas. The minimum voxel volume employed in the present study is equal to 17 mm3, which is still within the order of voxel volumes used in previous studies (14,22,53,58,59). However, the present acquisition protocol has been designed to minimize B0-induced distortions and T2*-blurring and to assure an overall SNR that results to a cone of uncertainty for the fiber orientation of the order of only 3.6° on a voxel-by-voxel basis. This low uncertainty in the estimation of the fiber orientation would be also important in order to assure good quality fiber tracking results (23,26,58). However, the acquisition of DTI data with such a narrow cone of uncertainty for the fiber orientation at the minimum voxel size of the present acquisition (1.56×1.56×7 mm3) requires a relatively long scan time of the order of 15 minutes. Although no image registration procedure was employed in this work in an effort to prevent any additional confounding factor affecting the presented spatial resolution analysis, leg motion can be, in general, a problem in long scans making necessary the use of image registration correction procedures (24). Furthermore, if a higher uncertainty in the fiber orientation estimate is acceptable, the number of averages can be appropriately decreased to shorten the total scan time. This trade-off between the DTI metrics reproducibility needs of the application under study and scan time limitations should be considered in any application of skeletal muscle DTI (23,58).
The present work has four limitations. First, the dependence of muscle diffusion tensor eigenvalues and anisotropy on the employed diffusion time was not taken into consideration. Kim et al. (60) have shown with ex vivo measurements that as diffusion time increases, diffusion on the plane perpendicular to the mean fiber directions becomes more restricted, and the secondary and tertiary eigenvalues decrease whereas the fractional anisotropy increases. It has been also recently proposed to use a very long diffusion time (of the order of 1s) to increase the FA value and decrease the cone of uncertainty in skeletal muscle DTI (61). However, more studies would be required in order to characterize the SNR efficiency as well as the sensitivity to tissue incoherent motion effects of a DW stimulated echo approach with such a long diffusion time. Second, the employed high slice thickness results in anisotropic voxel shapes. Although the in-plane voxel dimensions are significantly decreased down to 1.56 mm, the through-plane voxel dimension remains relatively large and equal to 7 mm. In brain DTI, isotropic voxel shapes have been shown to reduce partial volume effects especially in areas with crossing fibers (37,62). Although no previous study has characterized the effect of voxel shape on muscle DTI results, the effect is expected to be less severe in the calf muscle than in white matter due to the general alignment of the muscle fibers along the leg axis direction. Third the employed parallel imaging SENSE reconstruction requires an additional calibration scan. The present methodology could be enhanced using integrated/internal calibration approaches to eliminate the potential effect of motion between calibration and the diffusion weighted scan (63). Fourth, based on the analysis of the 8-channel RF coil used in this study, the reduction factor can increase up to 3, but this is in general RF coil dependent. Moreover, the use of high parallel imaging reduction factors decreases the B0-induced distortions, the fat chemical shift artifacts, and the T2*-induced blurring, but it cannot totally eliminate the presence of these effects. Further reduction of B0-induced distortions and T2*-induced blurring at high spatial resolutions would require more advanced pulses sequences than the employed single-shot EPI approach, employing multi-shot imaging strategies (with cartesian or non-cartesian k-space trajectories) or reduced-FOV acquisition approaches (37,64,65). The reduction of fat induced chemical shift artifacts would require the adaptation of fat suppression strategies taking into account approaches for the suppression of both the aliphatic and olefinic fat peaks (47).
Finally, it should be emphasized that the reported optimized protocol parameter values are specific to the chosen b value, gradient strength and coil configuration. However, the presented arguments in the study of the compromise between SNR, distortions, blurring and sensitivity to tissue incoherent motion effects are general and should be considered in the design of any skeletal muscle DTI acquisition protocol.
CONCLUSION
An improved eddy-current compensated single-shot DW-EPI acquisition method using stimulated echo preparation and SENSE is developed allowing high spatial resolution skeletal muscle DTI. A theoretical formulation is first established for designing the stimulated echo preparation diffusion timing and the SENSE reduction factor to maximize SNR. The acquisition parameters are then selected taking into account SNR, B0-induced distortions, T2* blurring and tissue incoherent motion effects. Design choices for the skeletal muscle DTI acquisition protocol are made based on the theoretical formulation, and by taking into account application specific practical considerations. The designed acquisition protocol is applied in the calf muscle of three volunteers with variable voxel size but with the same SNR, same relative B0-induced distortions and same relative T2*-blurring. The in vivo results demonstrate the importance of minimizing the sensitivity to off-resonance effects and T2* blurring in addition to maximizing SNR performance in high resolution skeletal muscle DTI using single-shot DW-EPI. Moreover, the in vivo results show that high spatial resolution DTI can reduce partial volume effects close to muscle boundaries and aponeuroses, especially in bippenate muscles (medial gastrocnemius), in multi-pennate muscles (soleus) and in muscles with small cross sectional areas.
Acknowledgments
The present research was supported by NIH R01-AG17762 and NIH RC1-AR058405.
LIST OF ABBREVIATIONS
- DW
diffusion-weighted
- DWI
diffusion-weighted imaging
- DTI
diffusion tensor imaging
- EPI
echo planar imaging
- FOV
field-of-view
- FSE
fast spin-echo
- IDEAL
iterative decomposition of water and fat with echo asymmetry and least squares estimation
- MG
medial gastrocnemius
- RESTORE
robust estimation of tensors by outlier rejection
- RF
radio-frequency
- SENSE
sensitivity encoding
- SNR
signal-to-noise ratio
- TA
tibialis anterior
- TE
echo time
- TM
mixing time
- TR
repetition time
References
- 1.Basser PJ, Mattiello J, LeBihan D. MR diffusion tensor spectroscopy and imaging. Biophys J. 1994;66(1):259–267. doi: 10.1016/S0006-3495(94)80775-1. [DOI] [PMC free article] [PubMed] [Google Scholar]
- 2.Basser PJ, Pajevic S, Pierpaoli C, Duda J, Aldroubi A. In vivo fiber tractography using DT-MRI data. Magn Reson Med. 2000;44(4):625–632. doi: 10.1002/1522-2594(200010)44:4<625::aid-mrm17>3.0.co;2-o. [DOI] [PubMed] [Google Scholar]
- 3.Damon BM, Ding Z, Anderson AW, Freyer AS, Gore JC. Validation of diffusion tensor MRI-based muscle fiber tracking. Magn Reson Med. 2002;48:97–104. doi: 10.1002/mrm.10198. [DOI] [PubMed] [Google Scholar]
- 4.Heemskerk AM, Damon BM. Diffusion tensor MRI assessment of skeletal muscle architecture. Curr Med Imaging Rev. 2007;3:152–160. doi: 10.2174/157340507781386988. [DOI] [PMC free article] [PubMed] [Google Scholar]
- 5.Heemskerk AM, Strijkers GJ, Vilanova A, Drost MR, Nicolay K. Determination of mouse skeletal muscle architecture using three-dimensional diffusion tensor imaging. Magn Reson Med. 2005;53(6):1333–1340. doi: 10.1002/mrm.20476. [DOI] [PubMed] [Google Scholar]
- 6.Napadow VJ, Chen Q, Mai V, So PTC, Gilbert RJ. Quantitative analysis of three-dimensional-resolved fiber architecture in heterogeneous skeletal muscle tissue using NMR and optical imaging methods. Biophys J. 2001;80:2968–2975. doi: 10.1016/S0006-3495(01)76262-5. [DOI] [PMC free article] [PubMed] [Google Scholar]
- 7.Sinha S, Sinha U, Edgerton VR. In vivo diffusion tensor imaging of the human calf muscle. J Magn Reson Imag. 2006;24:182–190. doi: 10.1002/jmri.20593. [DOI] [PubMed] [Google Scholar]
- 8.Cleveland GG, Chang DC, Hazlewood CF, Rorschach HE. Nuclear magnetic resonance measurement of skeletal muscle anisotropy of the diffusion coefficient of the intracellular water. Biophys J. 1976;16:1043–1053. doi: 10.1016/S0006-3495(76)85754-2. [DOI] [PMC free article] [PubMed] [Google Scholar]
- 9.Galban CJ, Maderwald S, Uffmann K, de Greiff A, Ladd ME. Diffusive sensitivity to muscle architecture: a magnetic resonance diffusion tensor imaging study of the human calf. Eur J Appl Physiol. 2004;93:253–262. doi: 10.1007/s00421-004-1186-2. [DOI] [PubMed] [Google Scholar]
- 10.Karampinos DC, King KF, Chen D, Sutton BP, Georgiadis JG. Mapping cross-sectional skeletal muscle asymmetry via high angular resolution diffusion imaging. Proc of ISMRM; Hawaii, USA. 2009. p. 1928. [Google Scholar]
- 11.Karampinos DC, King KF, Sutton BP, Georgiadis JG. Myofiber ellipticity as an explanation for transverse asymmetry of skeletal muscle diffusion MRI in vivo signal. Ann Biomed Eng. 2009;37(12):2532–2546. doi: 10.1007/s10439-009-9783-1. [DOI] [PMC free article] [PubMed] [Google Scholar]
- 12.Schwenzer NF, Steidle G, Martirosian P, Schraml C, Springer F, Claussen CD, Schick F. Diffusion tensor imaging of the human calf muscle: distinct changes in fractional anisotropy and mean diffusion due to passive muscle shortening and stretching. NMR Biomed. 2009;22(10):1047–1053. doi: 10.1002/nbm.1409. [DOI] [PubMed] [Google Scholar]
- 13.Karampinos DC, King KF, Sutton BP, Georgiadis JG. Intravoxel partially coherent motion technique: characterization of the anisotropy of skeletal muscle microvasculature. J Magn Reson Imaging. 2010;31(4):942–953. doi: 10.1002/jmri.22100. [DOI] [PubMed] [Google Scholar]
- 14.Ababneh Z, Beloeil H, Berde CB, Gambarota G, Maier SE, Mulkern RV. Biexponential parameterization of diffusion and T2 relaxation decay curves in a rat muscle edema model: decay curve components and water compartments. Magn Reson Med. 2005;54:524–531. doi: 10.1002/mrm.20610. [DOI] [PubMed] [Google Scholar]
- 15.Fan RH, Does MD. Compartmental relaxation and diffusion tensor imaging measurements in vivo in lambda-carrageenan-induced edema in rat skeletal muscle. NMR Biomed. 2008;21(6):566–573. doi: 10.1002/nbm.1226. [DOI] [PMC free article] [PubMed] [Google Scholar]
- 16.Zhang J, Zhang G, Morrison B, Mori S, Sheikh KA. Magnetic resonance imaging of mouse skeletal muscle to measure denervation atrophy. Exp Neurol. 2008;212(2):448–457. doi: 10.1016/j.expneurol.2008.04.033. [DOI] [PMC free article] [PubMed] [Google Scholar]
- 17.Zaraiskaya T, Kumbhare D. Diffusion tensor imaging in evaluation of human skeletal muscle injury. J Magn Reson Imag. 2006;24:402–408. doi: 10.1002/jmri.20651. [DOI] [PubMed] [Google Scholar]
- 18.Heemskerk AM, Strijkers GJ, Drost MR, van Bochove GS, Nikolay K. Skeletal muscle degeneration and regeneration after femoral artery ligation in mice: monitoring with diffusion MR imaging. Radiology. 2007;243:414–421. doi: 10.1148/radiol.2432060491. [DOI] [PubMed] [Google Scholar]
- 19.Galban CG, Maderwald S, Stock F, Ladd ME. Age-related changes in skeletal muscle as detected by diffusion tensor magnetic resonance imaging. J Gerontol. 2007;62:453–458. doi: 10.1093/gerona/62.4.453. [DOI] [PubMed] [Google Scholar]
- 20.Kan JH, Heemskerk AM, Ding Z, Gregory A, Mencio G, Spindler K, Damon BM. DTI-based muscle fiber tracking of the quadriceps mechanism in lateral patellar dislocation. J Magn Reson Imaging. 2009;29(3):663–670. doi: 10.1002/jmri.21687. [DOI] [PMC free article] [PubMed] [Google Scholar]
- 21.Lansdown DA, Ding Z, Wadington M, Hornberger JL, Damon BM. Quantitative diffusion tensor MRI-based fiber tracking of human skeletal muscle. J Appl Physiol. 2007;48:97–104. doi: 10.1152/japplphysiol.00290.2007. [DOI] [PMC free article] [PubMed] [Google Scholar]
- 22.Budzik JF, Le Thuc V, Demondion X, Morel M, Chechin D, Cotten A. In vivo MR tractography of thigh muscles using diffusion imaging: initial results. Eur Radiol. 2007;17:3079–3085. doi: 10.1007/s00330-007-0713-z. [DOI] [PubMed] [Google Scholar]
- 23.Froeling M, Oudeman J, van den Berg S, Nicolay K, Maas M, Strijkers GJ, Drost MR, Nederveen AJ. Reproducibility of diffusion tensor imaging in human forearm muscles at 3. 0 T in a clinical setting. Magn Reson Med. 2010;64(4):1182–1190. doi: 10.1002/mrm.22477. [DOI] [PubMed] [Google Scholar]
- 24.Heemskerk AM, Sinha TK, Wilson KJ, Ding Z, Damon BM. Quantitative assessment of DTI-based muscle fiber tracking and optimal tracking parameters. Magn Reson Med. 2009;61(2):467–472. doi: 10.1002/mrm.21819. [DOI] [PMC free article] [PubMed] [Google Scholar]
- 25.Sinha S, Mishra C, Shin D, Kinugasa R, Hodgson J, Edgerton RV, Sinha U. Changes in pennation angle and fiber length of muscles under plantar- and dorsi-flexion and force production - in-vivo, DTI based fiber tractography in humans. Proc of ISMRM; Toronto, Canada. 2008. p. 571. [Google Scholar]
- 26.Damon BM. Effects of image noise in muscle diffusion tensor (DT)-MRI assessed using numerical simulations. Magn Reson Med. 2008;60:934–944. doi: 10.1002/mrm.21707. [DOI] [PMC free article] [PubMed] [Google Scholar]
- 27.Merboldt KD, Hanicke W, Frahm J. Self-diffusion NMR imaging using stimulated echoes. J Magn Reson. 1995;64:479–486. [Google Scholar]
- 28.Tanner JE. Use of stimulated echo in NMR diffusion studies. Chem Phys. 1970;52:2523–2526. [Google Scholar]
- 29.Schick F. Signal losses in diffusion preparation: comparison between spin-echo, stimulated echo and SEASON. MAGMA. 1998;6(1):53–61. doi: 10.1007/BF02662512. [DOI] [PubMed] [Google Scholar]
- 30.Steidle G, Schick F. Echoplanar diffusion tensor imaging of the lower leg musculature using eddy current nulled stimulated echo preparation. Magn Reson Med. 2006;55:541–548. doi: 10.1002/mrm.20780. [DOI] [PubMed] [Google Scholar]
- 31.Bammer R, Auer M, Keeling SL, Augustin M, Stables LA, Prokesch RW, Stollberger R, Moseley ME, Fazekas F. Diffusion tensor imaging using single-shot SENSE-EPI. Magn Reson Med. 2002;48(1):128–136. doi: 10.1002/mrm.10184. [DOI] [PubMed] [Google Scholar]
- 32.Bammer R, Keeling SL, Augustin M, Pruessmann KP, Wolf R, Stollberger R, Hartung HP, Fazekas F. Improved diffusion-weighted single-shot echo-planar imaging (EPI) in stroke using sensitivity encoding (SENSE) Magn Reson Med. 2001;46(3):548–554. doi: 10.1002/mrm.1226. [DOI] [PubMed] [Google Scholar]
- 33.Jaermann T, Crelier G, Pruessmann KP, Golay X, Netsch T, van Muiswinkel AM, Mori S, van Zijl PC, Valavanis A, Kollias S, Boesiger P. SENSE-DTI at 3 T. Magn Reson Med. 2004;51(2):230–236. doi: 10.1002/mrm.10707. [DOI] [PubMed] [Google Scholar]
- 34.Pruessmann KP, Weiger M, Scheidegger MB, Boesiger P. SENSE: sensitivity encoding for fast MRI. Magn Reson Med. 1999;42(5):952–962. [PubMed] [Google Scholar]
- 35.Jaermann T, Pruessmann KP, Valavanis A, Kollias S, Boesiger P. Influence of SENSE on image properties in high-resolution single-shot echo-planar DTI. Magn Reson Med. 2006;55(2):335–342. doi: 10.1002/mrm.20769. [DOI] [PubMed] [Google Scholar]
- 36.Skare S, Newbould RD, Clayton DB, Bammer R. Propeller EPI in the other direction. Magn Reson Med. 2006;55(6):1298–1307. doi: 10.1002/mrm.20890. [DOI] [PubMed] [Google Scholar]
- 37.Karampinos DC, Van AT, Olivero WC, Georgiadis JG, Sutton BP. High-resolution diffusion tensor imaging of the human pons with a reduced field-of-view, multishot, variable-density, spiral acquisition at 3 T. Magn Reson Med. 2009;62(4):1007–1016. doi: 10.1002/mrm.22105. [DOI] [PubMed] [Google Scholar]
- 38.Finsterbusch J. Double-spin-echo diffusion weighting with a modified eddy current adjustment. Magn Reson Imaging. 2010;28(3):434–440. doi: 10.1016/j.mri.2009.12.004. [DOI] [PubMed] [Google Scholar]
- 39.Dietrich O, Raya JG, Reeder SB, Reiser MF, Schoenberg SO. Measurement of signal-to-noise ratios in MR images: influence of multichannel coils, parallel imaging, and reconstruction filters. J Magn Reson Imaging. 2007;26(2):375–385. doi: 10.1002/jmri.20969. [DOI] [PubMed] [Google Scholar]
- 40.Reeder SB, Pineda AR, Wen Z, Shimakawa A, Yu H, Brittain JH, Gold GE, Beaulieu CH, Pelc NJ. Iterative decomposition of water and fat with echo asymmetry and least-squares estimation (IDEAL): application with fast spin-echo imaging. Magn Reson Med. 2005;54(3):636–644. doi: 10.1002/mrm.20624. [DOI] [PubMed] [Google Scholar]
- 41.Brandejsky V, Kreis R, Boesch C. Optimization of spectroscopy-based diffusion measurements of intramyocellular lipids. Proc of ISMRM; Stockholm, Sweden. 2010. p. 855. [Google Scholar]
- 42.Steidle G, Elbofner F, Schick F. Quantitative diffusion imaging of adipose tissue in the human lower leg at 1. 5 T. Magn Reson Med. 2011;65:1118–1124. doi: 10.1002/mrm.22699. [DOI] [PubMed] [Google Scholar]
- 43.Chang LC, Jones DK, Pierpaoli C. RESTORE: robust estimation of tensors by outlier rejection. Magn Reson Med. 2005;53(5):1088–1095. doi: 10.1002/mrm.20426. [DOI] [PubMed] [Google Scholar]
- 44.Koay CG, Chang LC, Pierpaoli C, Basser PJ. Error propagation framework for diffusion tensor imaging via diffusion tensor representations. IEEE Trans Med Imaging. 2007;26(8):1017–1034. doi: 10.1109/TMI.2007.897415. [DOI] [PubMed] [Google Scholar]
- 45.Koay CG, Nevo U, Chang LC, Pierpaoli C, Basser PJ. The elliptical cone of uncertainty and its normalized measures in diffusion tensor imaging. IEEE Trans Med Imaging. 2008;27(6):834–846. doi: 10.1109/TMI.2008.915663. [DOI] [PMC free article] [PubMed] [Google Scholar]
- 46.Stanisz GJ, Odrobina EE, Pun J, Escaravage M, Graham SJ, Bronskill MJ, Henkelman RM. T1, T2 relaxation and magnetization transfer in tissue at 3T. Magn Reson Med. 2005;54(3):507–512. doi: 10.1002/mrm.20605. [DOI] [PubMed] [Google Scholar]
- 47.Hernando D, Karampinos DC, King KF, Haldar JP, Majumdar S, Georgiadis JG, Liang ZP. Removal of olefinic fat chemical shift artifact in diffusion MRI. Magn Reson Med. 2011;65:692–701. doi: 10.1002/mrm.22670. [DOI] [PMC free article] [PubMed] [Google Scholar]
- 48.Sinha U, Sinha S, Hodgson JA, Edgerton RV. Human soleus muscle architecture at different ankle joint angles from magnetic resonance diffusion tensor imaging. J Appl Physiol. 2011;110:807–819. doi: 10.1152/japplphysiol.00923.2010. [DOI] [PMC free article] [PubMed] [Google Scholar]
- 49.Finsterbusch J. Eddy-current compensated diffusion weighting with a single refocusing RF pulse. Magn Reson Med. 2009;61(3):748–754. doi: 10.1002/mrm.21899. [DOI] [PubMed] [Google Scholar]
- 50.Reese TG, Heid O, Weisskoff RM, Wedeen VJ. Reduction of eddy-current-induced distortion in diffusion MRI using a twice-refocused spin echo. Magn Reson Med. 2003;49(1):177–182. doi: 10.1002/mrm.10308. [DOI] [PubMed] [Google Scholar]
- 51.Haselgrove JC, Moore JR. Correction for distortion of echo-planar images used to calculate the apparent diffusion coefficient. Magn Reson Med. 1996;36(6):960–964. doi: 10.1002/mrm.1910360620. [DOI] [PubMed] [Google Scholar]
- 52.Rohde GK, Barnett AS, Basser PJ, Marenco S, Pierpaoli C. Comprehensive approach for correction of motion and distortion in diffusion-weighted MRI. Magn Reson Med. 2004;51(1):103–114. doi: 10.1002/mrm.10677. [DOI] [PubMed] [Google Scholar]
- 53.Sinha U, Hodgson J, Sinha S. Diffusion tensor derived soleus architecture at rest and under plantarflexion. Proc of ISMRM; Honolulu, Hawaii. 2009. p. 3954. [Google Scholar]
- 54.Skare S, Andersson JL. On the effects of gating in diffusion imaging of the brain using single shot EPI. Magn Reson Imaging. 2001;19(8):1125–1128. doi: 10.1016/s0730-725x(01)00415-5. [DOI] [PubMed] [Google Scholar]
- 55.Mangin JF, Poupon C, Clark C, Le Bihan D, Bloch I. Distortion correction and robust tensor estimation for MR diffusion imaging. Med Image Anal. 2002;6(3):191–198. doi: 10.1016/s1361-8415(02)00079-8. [DOI] [PubMed] [Google Scholar]
- 56.Zwiers MP. Patching cardiac and head motion artefacts in diffusion-weighted images. Neuroimage. 2010;53(2):565–575. doi: 10.1016/j.neuroimage.2010.06.014. [DOI] [PubMed] [Google Scholar]
- 57.Hatakenaka M, Matsuo Y, Setoguchi T, Yabuuchi H, Okafuji T, Kamitani T, Nishikawa K, Honda H. Alteration of proton diffusivity associated with passive muscle extension and contraction. J Magn Reson Imag. 2008;27:932–937. doi: 10.1002/jmri.21302. [DOI] [PubMed] [Google Scholar]
- 58.Heemskerk AM, Sinha TK, Wilson KJ, Ding Z, Damon BM. Repeatability of DTI-based skeletal muscle fiber tracking. NMR Biomed. 2010;23(3):294–303. doi: 10.1002/nbm.1463. [DOI] [PMC free article] [PubMed] [Google Scholar]
- 59.Deux JF, Malzy P, Paragios N, Bassez G, Luciani A, Zerbib P, Roudot-Thoraval F, Vignaud A, Kobeiter H, Rahnmouni A. Assessment of calf muscle contraction by diffusion tensor imaging. Eur Radiol. 2008;18:2303–2310. doi: 10.1007/s00330-008-1012-z. [DOI] [PubMed] [Google Scholar]
- 60.Kim S, Chi-Fishman G, Barnett AS, Pierpaoli C. Dependence on diffusion time of apparent diffusion tensor of ex vivo calf tongue and heart. Magn Reson Med. 2005;54(6):1387–1396. doi: 10.1002/mrm.20676. [DOI] [PubMed] [Google Scholar]
- 61.Sigmund EE, Sui D, Hodnett PA, Liu K, McGorty KA, Mechlin M, Bencardino J. T2-weighted imaging and stimulated echo diffusion tensor imaging in chronic exertional compartment syndrome calf muscle. Proc of ISMRM; Monrteal, Canada. 2011. p. 3258. [DOI] [PMC free article] [PubMed] [Google Scholar]
- 62.Oouchi H, Yamada K, Sakai K, Kizu O, Kubota T, Ito H, Nishimura T. Diffusion anisotropy measurement of brain white matter is affected by voxel size: underestimation occurs in areas with crossing fibers. AJNR Am J Neuroradiol. 2007;28(6):1102–1106. doi: 10.3174/ajnr.A0488. [DOI] [PMC free article] [PubMed] [Google Scholar]
- 63.Skare S, Newbould RD, Clayton DB, Albers GW, Nagle S, Bammer R. Clinical multishot DW-EPI through parallel imaging with considerations of susceptibility, motion, and noise. Magn Reson Med. 2007;57(5):881–890. doi: 10.1002/mrm.21176. [DOI] [PMC free article] [PubMed] [Google Scholar]
- 64.Holdsworth SJ, Skare S, Newbould RD, Bammer R. Robust GRAPPA-accelerated diffusion-weighted readout-segmented (RS)-EPI. Magn Reson Med. 2009;62(6):1629–1640. doi: 10.1002/mrm.22122. [DOI] [PMC free article] [PubMed] [Google Scholar]
- 65.Karampinos DC, Banerjee S, King KF, Krug R, Link TM, Majumdar S. Reduced FOV spinal muscle DWI with single-shot interleaved multi-slice inner volume stimulated echo DW-EPI. Proc of ISMRM; Montreal, Canada. 2011. p. 1152. [Google Scholar]


