

Abstract
Trans -3,5,4′-trihydroxystilbene (trans-resveratrol, RES) exhibits very low bioavailability due to extensive conjugative metabolism. Whether RES metabolites exhibit pharmacologic activity is of great interest. The present study aimed at synthesis of monoconjugates of RES – the 3- and 4′ monosulfates (R3S and R4′S), and the 3- and 4′ monoglucuronides (R3G and R4′G). Synthesis, purification, and yield are described. Synthesized metabolites were utilized to develop a sensitive LC-MSn assay for direct quantitation of all analytes. The assay was validated for intra- and inter-day precision and accuracy. Synthesis of RES conjugates and development and validation of a sensitive bioanalytical assay were applied to pharmacokinetic evaluation of RES and its circulating monoconjugates in C57BL mice. The study is a first report of direct quantitation of RES monosulfates and monoglucuronides. These results will aid in characterizing the disposition of RES and its major or active metabolites in vivo.
Keywords: Resveratrol, metabolites, sulfates, glucuronides, LC-MS/MS, pharmacokinetics
1. Introduction
Trans-3,5,4′-trihydroxystilbene (trans-resveratrol, RES) is a dietary phytochemical thought to have beneficial health effects via pleitropic mechanisms [1, 2]. One major hurdle to its development is its extremely low oral bioavailability due to metabolism [3, 4]. RES is known to be efficiently and almost completely converted in humans to its glucuronidated and sulfated metabolites. Human studies indicate that systemic exposure of RES is predominantly in the form of its conjugated metabolites [5, 6]. This has led to the hypothesis that the conjugates of RES might themselves be active, and therefore need to be evaluated.
While a few studies have attempted evaluation of RES conjugates in vitro [7], it is critical to evaluate the in vivo disposition of these metabolites. The pharmacokinetics (PK) of metabolites are expected to be different from those of the parent. Thus, knowledge of systemic levels of metabolites is necessary in order to correlate metabolite exposure to any observed pharmacologic activity.
As stated above, one hypothesis is that conjugated metabolites of RES are themselves active. However, the possibility of inactive metabolites also exists. Conjugation of RES is a complex process. Sulfation and glucuronidation are reversible processes and reversible metabolism can result in these metabolites acting as ‘depots’ for the active parent. Further, these conjugates are good candidates for enterohepatic recirculation. Recirculation of RES metabolites has indeed been suggested in preclinical studies [8]. The pharmacokinetics and pharmacodynamics of RES and its metabolites is therefore complicated by extensive first-pass metabolism, reversible conjugation, and enterohepatic recirculation.
The comprehensive study of RES and its metabolites in vivo requires two critical tools: i) synthesis of adequate amounts of pure RES metabolites for in vivo dosing experiments, and ii) a validated bioanalytical assay with low detection capability in order to quantitate low circulating levels of RES and its metabolites. The present work aimed at developing these two tools. Synthetic methods were developed for four monoconjugates of RES: the 3- and 4′-monosulfates (R3S and R4′S respectively), and the 3- and 4′-monoglucuronides (R3G and R4′G respectively). Our synthetic methods allowed us to produce adequate levels of pure metabolites that had application in subsequent bioanalytical assay development as standards, as well as in vivo PK studies. It should be noted that while these monoconjugates have recently become commercially available, their cost is prohibitive to conducting in vivo studies in replicates necessary for statistical power. We developed and validated an LC-MSn assay for the quantitation of RES and each of its monoconjugates at low concentrations. While methods have been reported for the quantitation of RES and qualitative identification of its metabolites [9], to our knowledge direct quantitation of RES metabolites has not been conducted to date. RES metabolites have previously been evaluated by hydrolysis and against a RES standard curve. Finally, we applied our synthetic metabolite standards and validated bioanalytical assay to a pharmacokinetic analysis of RES and its metabolites in a mouse model.
2. Materials and Methods
2.1. Materials
Resveratrol (trans-resveratrol, purity > 99%; RES), chlorosulfonic acid, anhydrous pyridine, sulfur trioxide pyridine complex, sodium carbonate, acetobromo-alpha-D glucuronic acid methyl ester, sodium methoxide, acetic acid, tetrahydrofuran (THF) and methanol were purchased from Sigma-Aldrich (St Louis, MO). R3S, R3G and R4′G for initial calibration were purchased from Toronto Research Chemicals (North York, Canada). Ammonium acetate was purchased from ThermoFisher Scientific (Pittsburgh, PA). HPLC grade methanol was purchased from Mallinckrodt Baker (Phillipsburg, NJ). All chemicals used to prepare buffers and other reagents were of analytical grade and were used as such.
2.2. Synthesis of RES glucuronides
Initial attempts to synthesize RES glucuronides using a glycosyl donor in the presence of silver carbonate (as reported by Wang et al [10]) proved unsuccessful. The synthesis was accomplished by a direct substitution reaction between RES monosodium salt and a suitably protected glycosyl donor (acetobromo-alpha-D glucuronic acid methyl ester). The acetyl protecting groups on the glycosyl moiety ensured formation of the desired β-D-glucuronide products. Briefly, RES (100 mg, 1eq) was dissolved in dry MeOH (3.5 mL) at room temperature, Sodium methoxide (24 mg in 1.5 mL dry MeOH; 1 eq) was added dropwise and the solution was stirred. After 1.5 h, a solution of acetobromo-alpha-D glucuronic acid methyl ester (176 mg, 1 eq) in dry MeOH (1 mL) was added slowly and the reaction was stirred for 4 h. Dry diethyl ether (30 mL) was added and the mixture was centrifuged and the organic phase was collected and evaporated to dryness. The residue was redissolved in a solution of THF and 1M NaOH (1:1 ratio) and set to stir. After 6 h, the reaction was quenched with a 1% acetic acid in MeOH solution. The solvent was evaporated and the crude solid separated by semi-preparative chromatography to afford the desired monoglucuronides. Figure 1 depicts this reaction scheme.
Figure 1.
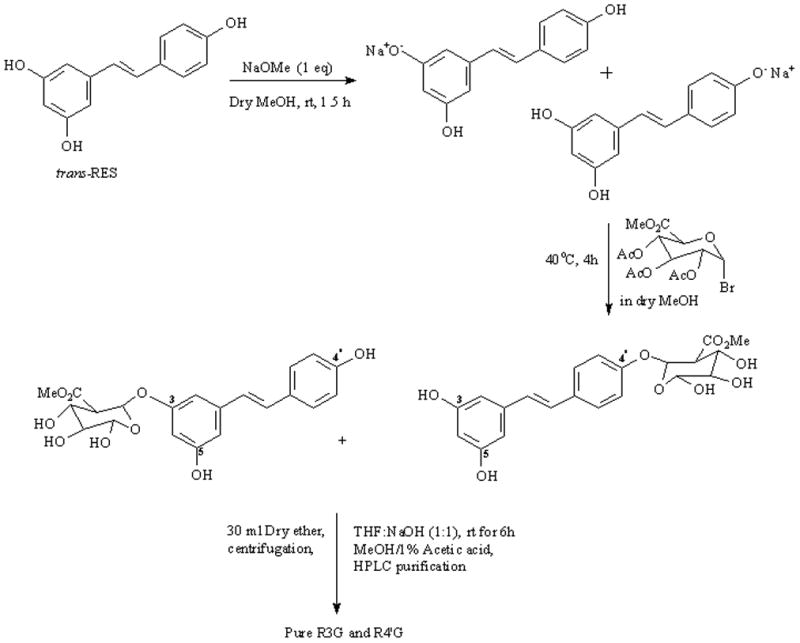
Reaction Scheme for RES glucuronidation using the glycosyl donor – acetobromo-alpha-D-glucuronic acid methyl ester.
2.3. Synthesis of RES sulfates
RES sulfation was carried out with two different procedures as described below. i) RES was treated with 1 equivalent (eq) of sulfur trioxide-pyridine complex in excess pyridine using controlled temperature conditions (35 – 45°C) [11, 12]. ii) RES was treated with 10 eq of chlorosulfonic acid in excess pyridine at −16 °C [13]. Details of the two methods are provided below. This is the first report on the use of chlorosulfonic acid for the synthesis of resveratrol sulfates.
2.3.1. Reaction with sulfur trioxide pyridine complex
To a stirred solution of RES (100 mg, 1 eq) in dry pyridine at 35 °C was added the SO3.Py complex (70 mg, 1 eq) dissolved in anhydrous pyridine and the solution was set to stir for 6 – 12 h. The reaction was quenched with an equal volume of water and the excess solvent was evaporated. The residue was then loaded onto a 30 g RediSep Rf Gold® High Performance HP C18 combiflash chromatography column (Teledyne Isco, Lincoln, NE) for pre-separation of the sulfates from the parent RES. A gradient separation over 9 min was run using a water: acetonitrile mobile phase. The fractions containing a mixture of monosulfates were combined and concentrated. Final separation and purification were carried out by semi-preparative chromatography to afford the monosulfates, R3S and R4′S. The reaction scheme is depicted in Figure 2.
Figure 2.
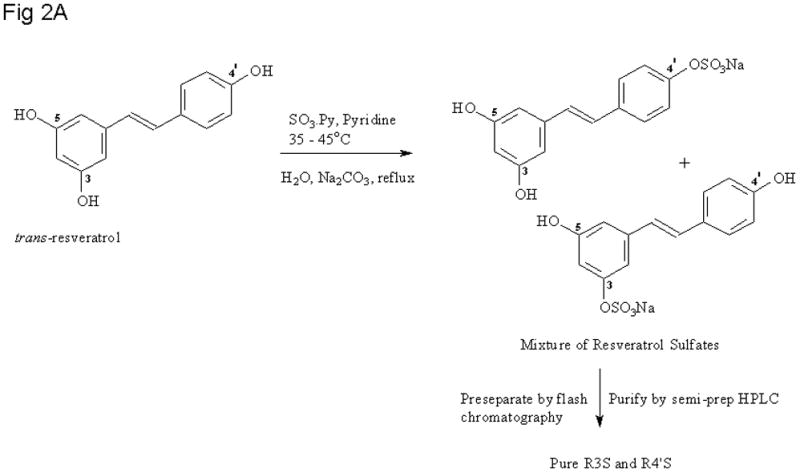
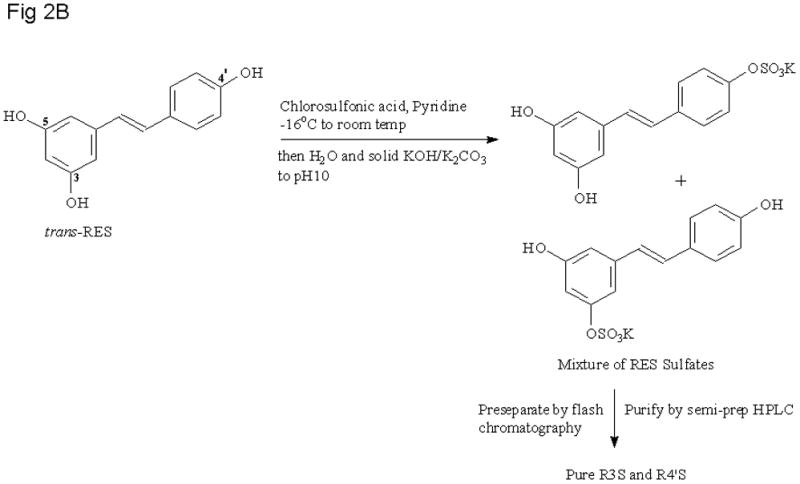
Reaction Schemes for RES sulfation with a) sulfur trioxide pyridine complex and b) chlorosulfonic acid.
2.3.2. Reaction with chlorosulfonic acid
To a chilled (−16 °C) solution of RES (100 mg, 1 eq) in dry pyridine was added chlorosulfonic acid (0.3 mL, 10 eq) with stirring. The mixture was allowed to warm to room temperature and after 12 h the reaction was stopped and the pyridine was evaporated under reduced pressure. The residue was dissolved in water, solid KOH or K2CO3 was added (to raise pH to 10) before loading onto the Combiflash column. Pre-separation and final purification was done as stated for the reaction with SO3.Py to provide the target mono sulfates in approximately 45% yield.
2.4. Semi-preparative HPLC purification of RES conjugates
The HPLC system (HP 1100 series; Agilent Technologies, Santa Clara, CA) consisted of a solvent delivery quaternary pump, an autosampler, a diode array detector with UV detection set at 303 nm and a Phenomenex Hyperclone ODS column (250 × 10 mm I.D., 5 μ particle size; Phenomenex, Torrance, CA) at a flow rate of 2.5 ml/min. A modification of the gradient method reported by Murias and coworkers [14] was used to elute the target compounds according to their lipophilicities in the following order – R4′G, R3G, R4′S, and R3S. All RES conjugates were separated and collected under the following conditions: Starting with a mixture of 90 % aqueous ammonium acetate (Solvent A) and 10 % methanol (Solvent B), the organic phase was linearly increased to 20% within 10 min, further increased to 35% B within 22 min and a final increase to 60% B at 25 min, where it remained constant until 30 min. Subsequently, the percentage of methanol (B) was decreased to 10% within 2 min, and the column was equilibrated for a further 8 min before application of the next sample. HPLC retention times for RES conjugates were 15, 18, 23.4 and 24.8 min for R4′G, R3G, R4′S and R3S respectively. Peaks corresponding to the respective RES metabolites were collected individually from each chromatographic run and pooled. The pooled fractions were then evaporated under reduced pressure and dried under vacuum. The metabolites synthesized herein were shown to be of 98% or greater purity as determined by HPLC analysis using two mobile phases (ammonium acetate/methanol gradient mobile phase detailed above, and an independent experiment with an acetonitrile /water gradient). Portions of the purified compounds were used for NMR spectroscopic measurements (see section 2.6 below). NMR spectra of the metabolites were consistent with this high level of purity.
2.5. Identification of RES conjugates by LC-MS
LC-MS analysis was performed using an Agilent HP 1200 series HPLC coupled to a 6100 series single quadrupole electrospray mass spectrometer (Agilent Tech, Santa Clara, CA) operating in both negative and positive ESI modes. UV spectra were recorded from 250–350 nm on the photodiode array detector. Negative and positive ion electrospray mass spectra were obtained with the electrospray capillary set at 3 kV. The flow rate of the nitrogen drying gas was 12.0 L/min at a temperature of 350 °C. Mass spectra were recorded over the range of m/z 100–1000. Alternatively, selected ion monitoring was used for greater sensitivity by recording signals for ions of m/z 307 for the sulfates and 403 for the glucuronides. Identification was done on an Agilent Zorbax SB-C18 column (30 × 2.1 mm ID, 3.5 μ particle size) using a water: acetonitrile (with 0.1%v/v formicacid) mobile phase set at a gradient of 5–100% B over 4 min and a flow rate of 1 ml/min.
2.6. NMR spectroscopic characterization
1H, 2D-COSY, 13C (DEPT-135) experiments (where appropriate) were performed on a Bruker Avance III 400MHz spectrometer (Bruker, USA). Samples were dissolved in appropriate deuterated solvents (DMSO or methanol) and all measurements were made at room temperature (298K). Evaluation of the experiments was carried out using Bruker’s automated software, TopSpin 2.1. Spectroscopic data for the metabolites reported herein were identical to those previously reported by others [15–18].
2.7. LC-MS assay development for analysis of RES and metabolites
2.7.1. Preparation of stock solutions, calibration standards (CS) and quality control (QC) samples
Stock solutions of RES, R4′G, R3G, R4′S, R3S and APAP (IS) were prepared separately in DMSO. CS samples were prepared by spiking stock standard working solution into heparinized mouse plasma to give eight CS in the concentration range of 2.46–2460 ng/ml for R3S, 3.57–3570 ng/ml for R3S and 10–10000 ng/ml for R4′G, R3G and RES. Similar to calibration standards, QC samples were prepared in replicates (n = 3 and n = 5 for the inter-day and intra-day validation respectively) at five concentration levels representing the entire range of concentrations (10, 20, 50, 1000 and 10000 ng/ml for RES, R4′G, and R3G; 3.57, 7.15, 17.9, 357 and 3570 ng/ml for R4′S and 2.46, 4.93,12.3, 246 and 2460 ng/ml for R3S).
2.7.2. Sample preparation
RES, R4′G, R3G, R4′S, and R3S were isolated from plasma with protein precipitation. To 10 uL of plasma sample, 2.5 uL of 15 % ascorbic acid was added and vortexed for 1 min. Then 30 uL of methanol containing 78 ng/ml APAP (internal standard) was added and again vortexed for 1 min and centrifuged at 15,000 rpm for 15 min at room temperature. Supernatant (10 μL) was injected into the liquid chromatography tandem mass spectrometry system.
2.7.3. LC-MS/MS conditions
The LC-MS/MS assay was carried out on an Agilent series 1100 high-performance liquid chromatography system equipped with a binary pump, autosampler and degasser coupled to an API 4000 triple-quadrupole tandem mass spectrometer from ABSciex with ESI source operated in the negative ion mode. Analyst software version 1.4.2 (ABSciex) was used for instrument control, data acquisition and data processing for both chromatography and mass spectrometry. The chromatographic separation system consisted of a guard column (Zorbax SB-C18, 5 um, 4.6 × 12.5 mm; Agilent Technologies), an analytical column (Zorbax SB-C18, 5 um, 4.6 × 150 mm; Agilent Technologies) and a gradient mobile phase of A: 5 mM ammonium acetate and B: methanol. The elution started with 90% A at 0 min to 80% at 2 min, 65% at min 10, 40% at min 12 to min 17 and 90% at min 19. Flow rate of the mobile phase was 1 ml/min and the flow from the column was split 1:3 into a ABSciex API4000 triple quadrupole mass spectrometer equipped with a Turbo ionspray source operating at 450°C. The column temperature was maintained at 35°C. The ESI instrument settings were optimized for the analysis and the appropriate MRM transitions and MS/MS parameters were determined for individual compounds by direct infusion into the mass spectrometer. Nitrogen was used as the curtain, collision and ion source gas.
2.8. Assay validation
The method was validated according to published recommendations for bioanalytical method validation [19]. Calibration curves were constructed from the peak area ratios of each analyte to internal standard versus plasma concentrations with linear least squares regression calculation and a weighting factor of 1/X2. Solvent (methanol) and blank were run after every two samples. Intra-day accuracy and precision were determined by analyzing five replicates of QC samples. Inter-day accuracy and precision were evaluated on five separate days. Precision was expressed as the relative standard deviation of the determined concentrations. Accuracy was calculated with the following equation: Accuracy = [(mean measured concentration – nominal concentration)/nominal concentration] × 100. Recovery of metabolites was investigated by analyzing five individual plasma samples at low, medium and high concentrations. These concentrations were: 20, 1000, and 10000 ng/ml for R3G and R4′G; 4.93, 246, and 2460 ng/ml for R3S; and 7.15, 357, and 3570 ng/ml for R4′S. The recovery was determined by comparing analyte: IS peak area ratio upon extraction from spiked plasma to analyte: IS peak area ratio in pre-prepared plasma matrix.
2.9. Application of synthesis and bioanalytical method: pharmacokinetics of RES and quantitation of its metabolites in vivo
Male C57BL/6 mice weighing between 20 and 25 g were supplied by Jackson labs and maintained in the American Association for the Accreditation of Laboratory Animal Care-accredited University Laboratory Animal Resources of Temple University. All animal studies were approved by the Institutional Animal Care and Use Committee. A carotid artery cannula was surgically implanted into the right carotid artery of each mouse, and animals were allowed to recover overnight. Carotid artery cannula was used for systemic drug administration and blood sampling. Heparin-saline (20 μL, 50 IU/ml) was used to flush the cannula after systemic administration or blood sampling. RES solubilized in 20% 2-hydroxypropyl-β-cyclodextrin in saline was administered intra-arterially (I.A.) at a dose of 60 mg/kg. The I.A. route was selected in order to achieve 100% systemic bioavailability. The dose was selected in order to achieve measurable concentrations of all RES conjugates including quantitatively minor metabolites. Blood (20 μl) was serially sampled at 2.5, 5, 10, 15, 45, 90, 180, 300, 420 and 600 min. Blood samples were centrifuged at 14,000 rpm for 2 min, the harvested plasma was collected and stored at −80 °C until LCMS/MS analysis. PK data analysis was performed with the software package WinNonlin Version 5.2 (Pharsight, Mountain View, CA). Pharmacokinetics of RES and metabolites were analyzed by standard non-compartmental methods that yielded individual animal estimates of total clearance, volume of distribution, elimination half-life, area under the RES plasma concentration-time curves from time 0 to 10 hrs (AUC0-10) and 0 to infinity (AUC0-inf), and metabolite plasma concentration-time curves from time 0 to 10 hrs (Metabolite AUC0-10) and 0 to infinity (Metabolite AUC0-inf).
3.0. Results
3.1. Synthesis of RES glucuronides and sulfates
The synthesis of the glucuronides was accomplished using a modification of the procedure reported by Vitaglione and coworkers[15]. The route used to prepare R3G and R4′G is shown in Figure 1. RES mono-sulfates were prepared using modifications to two precedented procedures [11–13, 20]. Figure 2A depicts the use of SO3.Py complex while Figure 2B involves the use of chlorosulfonic acid. Yields and spectroscopic data for RES mono-sulfates and glucuronides are listed in Table 1.
Table 1.
Yields and spectroscopic data for RES mono-sulfates and glucuronides
| Compound (Mol. Wt) | Theoretical Yield | Actual Yield (%) | H1NMR | LC-MS (m/z, RT, % Purity) |
|---|---|---|---|---|
| R4′S (308) | 135 mg | 23 mg (17%) | (MeOH-d4, DQF COSY): δ = 6.2 (t, J = 2.1Hz, H-4), 6.5 (d, J = 2.1Hz, H-2,6), 6.95 (d, J = 16.3Hz, trans-vinyl), 7.04 (d, J = 16.3 Hz, trans-vinyl), 7.29 (d, J = 8.7Hz, H-3′,5′), 7.50 (J = 8.7Hz, H-2′,6′) | 307 [M-H]+, 1.77 min, 99% |
| R3S (308) | 135 mg | 37 mg (27%) | (MeOH-d4, DQF COSY): δ = 6.66 (t, J = 2.1Hz, H-4), 6.74 (t, H-6), 6.76 (d, J = 8.6Hz, H-3′,5′), 6.85 (d, J = 16.2Hz, trans-vinyl), 6.97 (t, H-2), 7.05 (d, J = 16.2Hz, trans-vinyl), 7.37 (d, J = 8.6Hz, H-2′,6′) | 307 [M-H]+, 1.98 min, 98% |
| R4′Ga (404) | 176 mg | 20 mg (11%) | (MeOH-d4, DQF COSY): δ = 3.52 (m,3H, 3 × H, H2″-H4″), 3.78 (m, 1H, H5″), 4.93 (s, 1H, H1″) 6.16 (t, J = 2.1Hz, H-4), 6.46 (d, J = 2.1Hz, H-2,6), 6.85 (d, J = 16.3Hz, trans-vinyl), 6.96 (d, J = 16.3 Hz, trans-vinyl), 7.11 (d, J = 8.7Hz, H-3′,5′), 7.43 (J = 8.7Hz, H-2′,6′) |
403 [M-H]+, 1.78 min, 99% |
| R3Ga (404) | 176 mg | 34 mg (19%) | (MeOH-d4, DQF COSY): δ = 3.43 (m,3H, 3 × H, H2″-H4″), 3.68 (m, 1H, H5″), 4.82 (s, 1H, H1″) 6.40 (t, J = 2.1Hz, H-4), 6.52 (d, J = 2.1Hz, H-2,6), 6.67 (d, J = 8.7Hz, H-3′,5′), 6.75 (d, J = 16.3Hz, trans-vinyl), 6.91 (d, J = 16.3 Hz, trans-vinyl), 7.28 (J = 8.7Hz, H-2′,6′) |
403 [M-H]+, 1.95 min, 99% |
Quantity of starting material (RES) was 100 mg (0.44 mM)
- Numbering for glucuronic acid proton assignment
3.2. LC-MS/MS assay for quantitation of RES and its metabolites
ESI operated in negative ion mode was used for the LC-MS/MS analysis to provide optimum sensitivity and selectivity. The optimized tandem mass spectrometry conditions are summarized in Table 2. The following precursor-product ion transitions were observed: m/z 227→185 for RES, m/z 150→107 for acetaminophen (APAP, internal standard IS), 403→113 for R4′G and R3G and 307→227 for R4′S and R3S with a dwell time of 400 ms for each ion transition. The daughter ion for sulfated metabolites (227) corresponds to the RES moiety and the daughter ion for glucuronidated metabolites (113) corresponds to the glucuronide moiety fragment [21]. The retention time was ~ 5 min for APAP, ~ 5.9 min for R4′G, ~ 7.3 min for R3G, ~ 9.2 min for R4′S, ~ 10.2 min for R3Sand ~ 14.2 min for RES. A representative chromatogram is presented in Figure 3.
Table 2.
Optimized ESI-MS/MS operating, MRM and MS/MS parameters for RES, R4′G, R3G, R4′S, R3S and APAP (IS)
| Operating parameters | Setting | |||
|---|---|---|---|---|
| Collision gas (psi) | 6 | |||
| Curtain gas (psi) | 40 | |||
| Ion source gas 1 (psi) | 55 | |||
| Ion source gas 2 (psi) | 55 | |||
| Ion spray voltage (V) | −4500 | |||
| Temperature (°C) | 450 | |||
| EP (V) | −10 | |||
| Run duration (min) | 19 | |||
| RES | R4′G/R3G | R4′S/R3S | APAP(IS) | |
| Precursor ion (m/z) | 227 | 403 | 307 | 150 |
| Product ion (m/z) | 185 | 113 | 227 | 107 |
| Dwell time (ms) | 400 | 400 | 400 | 400 |
| DP (V) | −70 | −65 | −40 | −40 |
| CE (V) | −26 | −24 | −32 | −24 |
| CXP (V) | −11 | −5 | −5 | −5 |
Figure 3.
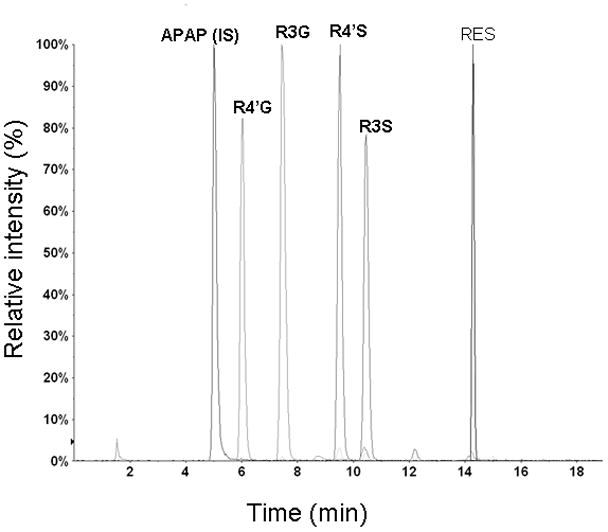
Representative chromatograms of RES, APAP (IS), R4′G, R3G, R4′S and R3S
In this study, the calculated peak area ratios of RES, R4′G, R3G, R4′S and R3S to APAP versus the nominal concentration of the analyte displayed a good linear relationship with coefficients of determination ≥ 0.99 over a concentration range of 10–10000 ng/ml for RES, R4′G, R3G, 3.57 to 3570 ng/ml for R4′S and 2.46 to 2460 ng/ml for R3S using a weighting factor of 1/X2. The limits of quantitation (LOQs) were established at the lowest points of the standard curves, i.e. 3.57 ng/ml for R4′S, 2.46 ng/ml for R3S and 10 ng/ml for R4′G, R3G and RES. The results of intra-day and inter-day accuracy and precision are presented in Table 3. The intra- and inter-day precision for all the analytes was less than 15%. The recovery of R3G and R4′G at low (20 ng/ml), medium (100 ng/ml) and high (10000 ng/ml) concentrations was 79.58, 91 and 90.98 % for R3G and 89.93, 86.15 and 94.83% for R4′G respectively. Recovery of R3S at low (4.93 ng/ml), medium (246 ng/ml) and high (2460 ng/ml) concentration was 105.13, 99.21 and 96.11 % respectively. R4′S recovery at low (7.15 ng/ml), medium (357 ng/ml) and high (3570 ng/ml) concentration was 97.31, 108.71 and 103.61 % respectively. The results indicate that the recovery, precision and accuracy of this method were adequate for bioanalytical purposes.
Table 3.
Intra-day (n = 5) and inter-day (n = 5) precision and accuracy for RES, R4′G, R3G, R4′S and R3S in mouse plasma
| Analytes | Nominal Concentration (ng/ml) | Intra-day (n = 5) Measured concentration ± SD (ng/ml) | Precision (%) | Accuracy (%) | Interday (n = 5) Measured concentration ± SD (ng/ml) | Precision (%) | Accuracy (%) |
|---|---|---|---|---|---|---|---|
| RES | 10a | 9.34 ± 0.93 | 10 | −6.64 | 9.83 ± 0.89 | 9.02 | −1.7 |
| 20 | 19.66 ± 1.81 | 9.2 | −1.7 | 20.80 ± 1.70 | 8.16 | 3.99 | |
| 50 | 54.82 ± 1.92 | 3.52 | 9.16 | 50.70 ± 4.18 | 8.24 | 1.41 | |
| 1000 | 1017.6 ± 81.99 | 8.06 | 1.76 | 1020.32 ± 59.84 | 5.86 | 2.03 | |
| 10000 | 10218 ± 501.12 | 4.9 | 2.18 | 10038.27 ± 780.66 | 7.78 | 0.38 | |
| R4′G | 10a | 9.01 ± 0.91 | 10.07 | −9.88 | 9.69 ± 0.83 | 8.52 | −3.09 |
| 20 | 18.68 ± 1.23 | 6.59 | −6.6 | 19.64 ± 1.25 | 6.34 | −1.82 | |
| 50 | 48.96 ± 2.11 | 4.32 | −2.08 | 47.73 ± 3.00 | 6.28 | −4.55 | |
| 1000 | 1053.20 ± 33.78 | 3.21 | 5.32 | 1058.11 ± 23.5 | 2.22 | 5.81 | |
| 10000 | 10254 ± 422 | 4.12 | 2.54 | 10202.8 ± 471.46 | 4.62 | 2.03 | |
| R3G | 10a | 9 ± 0.35 | 3.83 | −9.96 | 9.64 ± 0.56 | 5.84 | −3.58 |
| 20 | 17.64 ± 0.42 | 2.39 | −11.8 | 19.09 ± 1.21 | 6.33 | −4.56 | |
| 50 | 47 ± 1.96 | 4.16 | −6 | 46.49 ± 1.91 | 4.12 | −7.03 | |
| 1000 | 1047.60 ± 44.03 | 4.2 | 4.76 | 1075.65 ± 27.76 | 2.58 | 7.57 | |
| 10000 | 10366 ± 426.36 | 4.11 | 3.66 | 10351.20 ± 429.35 | 4.15 | 3.51 | |
| R4′S | 3.57a | 3.55 ± 0.32 | 8.89 | −0.5 | 3.73 ± 0.25 | 6.82 | 4.46 |
| 7.15 | 7 ± 0.71 | 10.19 | −2.07 | 7.12 ± 0.41 | 5.70 | −0.41 | |
| 17.9 | 17.76 ± 0.75 | 4.24 | −0.78 | 17.63 ± 1.35 | 7.68 | −1.5 | |
| 357 | 359.40 ± 12.18 | 3.39 | 0.67 | 378.68 ± 11.89 | 3.14 | 6.07 | |
| 3570 | 3708 ± 164.07 | 4.42 | 3.87 | 3826.93 ± 114.03 | 2.98 | 7.2 | |
| R3S | 2.46a | 2.30 ± 0.25 | 10.88 | −6.5 | 2.42 ± 0.14 | 5.97 | −1.63 |
| 4.93 | 5.03 ± 0.44 | 8.78 | 1.95 | 4.83 ± 0.28 | 5.88 | −2 | |
| 12.3 | 12.38 ± 0.40 | 3.25 | 0.65 | 11.79 ± 0.82 | 6.98 | −4.15 | |
| 246 | 255.40 ± 8.02 | 3.14 | 3.82 | 259.01 ± 3.62 | 1.4 | 5.29 | |
| 2460 | 2740 ± 140.36 | 5.12 | 11.38 | 2610 ± 162.48 | 6.23 | 6.1 |
: Concentrations determined to be LOQ
3.3. Application to pharmacokinetic studies
The mean plasma concentration-time profiles of RES and its metabolites are shown in Figure 4, with pharmacokinetic parameter and metric estimates listed in Table 4. RES exhibited a high steady-state volume of distribution and an elimination half life of 110 min. At the end of 10 h, R3G was quantitatively the most abundant metabolite, followed by R3S. Both R4′S and R4′G were quantitatively minor metabolites. The mean systemic clearance of RES was high (251.14 ml/min/kg) when compared with hepatic blood flow in the mouse (90 ml/min/kg) [22, 23].
Figure 4.
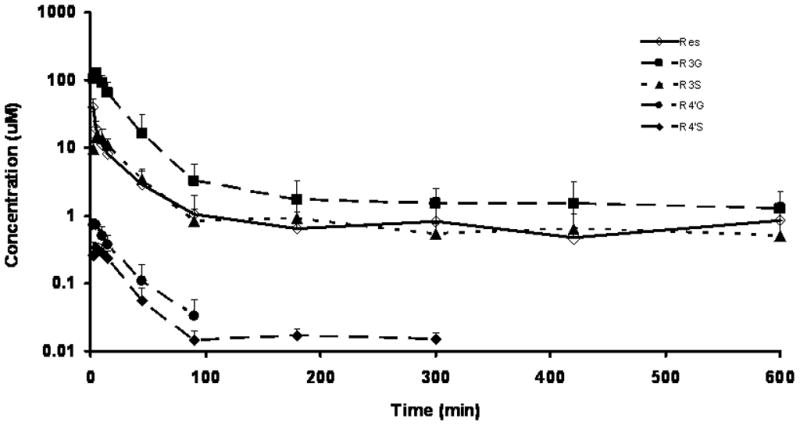
Plasma concentration-time profile of RES and its monoconjugated metabolites. RES and metabolite concentrations in plasma were determined in C57BL/6J mice (n = 6) receiving 60 mg/kg RES as an IA short infusion (10 sec). Data are represented as mean ± SD, n = 6.
Table 4.
Noncompartmental analysis of RES and its metabolites upon a single 60 mg/kg IA RES dose
| PK parameter/metric (units) | Estimate ± SD, n = 6 |
|---|---|
| AUC0-10 (min.μM) | 1065.93 ± 394.89 |
| AUC0-inf (min.μM) | 1206.87 ± 475.51 |
| Cl (ml/min/kg) | 251.14 ± 109.08 |
| Vss (L/kg) | 38.35 ± 13.56 |
| t1/2 (min) | 109.75 ± 22.90 |
| R3GAUC0-10 (min.μM) | 3891.47 ± 1179.42 |
| R3GAUC0-inf (min.μM) | 4191.01 ± 1297.29 |
| R3SAUC0-10 (min.μM) | 823.80 ± 214.63 |
| R3SAUC0-inf (min.μM) | 1023.86 ± 352.44 |
| R4′GAUC0-10 (min.μM) | 17.49 ± 7.30 |
| R4′GAUC0-inf (min.μM) | 18.78 ± 7.61 |
| R4′SAUC0-10 (min.μM) | 11.27 ± 3.75 |
| R4′SAUC0-inf (min.μM) | 12.17 ± 4.39 |
4.0. Discussion and Conclusions
4.1. Synthesis of RES metabolites
For RES glucuronidation, facile synthesis of the 3 and 4′ glucuronide products was achieved with the use of 1eq of acetobromo glucuronic acid methyl ester. This method is a modification of the procedure reported by Vitaglione and coworkers [15]. This one pot reaction involves the use of NaOMe in methanol which serves as the protonating agent for RES and the deprotecting agent for the acetyl groups.
The majority of reports on the chemical synthesis of RES sulfates [17, 24–26] use a modification of the sulfation procedure reported by Kawai et al (1 eq SO3.Py complex at 60°C) [11]. An exception is the work by Hoshino and coworkers[27]. Kawai et al stated that carrying out the reaction at room temperature yielded more monosulfated products and heating to 60°C ensured disulfation. In our hands, RES sulfation at 60°C yielded predominantly disulfated products (a finding confirmed by others [11, 12]) while at room temperature no measurable sulfates were isolated. However, when the temperature was carefully maintained at 35°C, RES monosulfates were obtained but with lower yields. Thus, the sulfation of RES using the SO3.Py complex was found to be highly temperature dependent. Hoshino et al [27] attempted to avoid the challenge of disulfate formation by selectively protecting the hydroxyl groups. This method was not used here due to the multiple steps involved in the approach and the modest increase in yields reported.
The synthesis of RES monosulfates reported herein was carried out using SO3.Py complex at 35°C. Removal of unreacted RES was accomplished by pretreating the reaction mixture with a reverse phase combiflash (RediSep™ Gold) column. The recovered RES was dried and used for future reactions thus improving reaction efficiency. Fractions containing the sulfates were pooled, concentrated and loaded directly onto a semi-prep column where an effective separation of the 3 and 4′ regio-isomers was achieved. (Evaporation of fractions to dryness was found to result in solvolysis, presumably due to the presence of sulfuric acid - the reaction byproduct).
Another sulfating agent reported for polyphenol sulfation is chlorosulfonic acid which has been used successfully for sulfating daidzein and other isoflavonoids such as quercetin, genistein and equol [13, 20]. The use of 10 eq of cholorosulfonic acid (more than 10 eq increased the non-selectivity) in excess pyridine at −16°C afforded the desired monosulfates of RES with less disulfate formation than the SO3.Py complex method. With respect to the separation and purification, the same measures applied for the work up of the SO3.Py complex reaction were utilized to obtain the final purified sulfated products. Both the SO3.Py complex reaction and the reaction involving chlorosulfonic acid afford the monosulfates in approximately 45% yield. However, sulfation using the SO3.Py complex was preferred due to the milder nature of the sulfating agent and the reduced reaction time.
4.2. Development and validation of LC-MSn method
There are reports of synthetic RES metabolites used as qualitative standards, but no study to date has directly quantitated these metabolites [6, 28, 29]. Studies to date have utilized a RES standard curve to quantitate its conjugates after their hydrolysis. Hydrolysis of conjugated metabolites to convert them to parent RES adds uncertainty to their quantitation due to experimental issues such as incomplete deconjugation, degradation, and error introduced due to additional sample preparation steps. Thus, quantitation of RES conjugates directly against their synthetic standards is a vast improvement. Table 3 shows the validation of our assay for the parent as well as all monoconjugate analytes. The LC method reported here was modified from a previously published method [14]. Our modified method had a shorter run time (19 min versus 30 min), and included an internal standard (APAP). The sensitivity of the present assay is greatly increased (2.46 ng/ml for R3S) as compared to the earlier method (100 ng/ml for R3S). This improved sensitivity is critical to evaluation of low levels of metabolites formed in vivo. The most important distinction in our assay is the resolution of R3S and R4′S metabolites, and quantitation of each metabolite against its synthetic standard. Given the purported activity of R4′S in cell-based assays [7], it is especially important to analyze this metabolite and understand its in vivo disposition. Finally, the direct quantitation of RES glucuronides has not been previously reported. The present method offers a major advantage over previous methods in being a highly sensitive and specific assay for concomitant determination of RES and all 4 of its monoconjugated metabolites.
4.3. Application to PK studies
RES pharmacokinetics have previously been reported in rats, pigs, and humans [6, 8, 9, 28, 30, 31]. Aspects of its disposition such as absorption, metabolism, and distribution have been evaluated in mouse models [32, 33]. Similar to disposition in rats, RES was highly metabolized to R3G in the present study with mice [9]. The systemic clearance of RES in the present study (251 ml/min/kg) was of a similar magnitude as that reported in rats (195 ml/min/kg by Marier et al, 183 ml/min/kg by Kapetanovic et al) [8, 28]. Previous studies in rodents did not report any RES 4′ conjugates. Quantitation of R4′G and R4′S in the present study was enabled by the synthesis of standards as well as development of a sensitive bioanalytical assay. Our results indicate the utility of our synthesis and bioanalytical methods in comprehensive PK evaluation of RES, to resolve issues such as its metabolism, enterohepatic recirculation, formation and disposition kinetics of potentially active metabolites, and reversible metabolism of potentially ‘depot’ conjugates. Studies are currently underway in our laboratories to evaluate the PK of not only RES but also its pre-formed synthetic sulfates and glucuronides.
5.0. Conclusion
All four monoconjugates of RES – R3S, R4′S, R3G, and R4′G – have been successfully synthesized, purified, and characterized. These metabolites were utilized as synthetic standards to develop and validate a highly sensitive LC-MSn assay for concomitant quantitation of RES and all its monoconjugates. Together, synthetic metabolites and validation of a bioanalytical method were applied to characterize the plasma PK of RES in mice. Future studies will include characterization of biological activity of RES metabolites, as well as the pharmacokinetics of these pre-formed metabolites. An understanding of RES disposition will allow better RES regimen design for increased efficacy, as well as design of analogs with improved PK characteristics such as increased bioavailability.
Supplementary Material
Highlights.
Synthesis and purification of R3S, R4′S, R3G, and R4′G
Development and validation of highly sensitive LC-MSn assay for all analytes
Application to pharmacokinetic studies in a mouse model
Acknowledgments
The work was partially supported by Award number R03CA133943 from the National Cancer Institute to SN and DJC. The content is solely the responsibility of the authors and does not necessarily represent the official views of the NIH or NCI. The authors are grateful also for support supplied by Temple University Graduate School (OFI) and to the School of Pharmacy (SS).
Abbreviation List
- APAP
acetaminophen
- CS
calibration standards
- IA
intra-arterial administration
- IS
internal standard
- LC-MS/MS
liquid chromatography with tandem mass spectrometry
- LOQ
limit of quantitation
- MRM
multiple reaction monitoring
- NaOMe
sodium methoxide
- PK
pharmacokinetics
- QC
quality control
- RES
Trans-3,5,4′-trihydroxystilbene; trans-resveratrol
- R3G
trans-resveratrol-3-O-glucuronide
- R4′G
trans--resveratrol-4′-O-glucuronide
- R3S
trans-resveratrol-3-sulfate
- R4′S
trans-resveratrol-4′-sulfate
- SO3.Py
sulfur trioxide pyridine complex
- THF
tetrahydrofuran
Footnotes
Publisher's Disclaimer: This is a PDF file of an unedited manuscript that has been accepted for publication. As a service to our customers we are providing this early version of the manuscript. The manuscript will undergo copyediting, typesetting, and review of the resulting proof before it is published in its final citable form. Please note that during the production process errors may be discovered which could affect the content, and all legal disclaimers that apply to the journal pertain.
Contributor Information
Otito F. Iwuchukwu, Email: otitof@temple.edu.
Satish Sharan, Email: Satish.sharan@temple.edu.
Daniel J. Canney, Email: Daniel.canney@temple.edu.
References
- 1.Resveratrol in Health and Disease. CRC Press, Taylor and Francis Group; Boca Raton FL: 2006. [Google Scholar]
- 2.Baur JA, Sinclair DA. Therapeutic potential of resveratrol: the in vivo evidence. Nat Rev Drug Discov. 2006;5:493–506. doi: 10.1038/nrd2060. [DOI] [PubMed] [Google Scholar]
- 3.Walle T, Hsieh F, DeLegge MH, Oatis JE, Jr, Walle UK. High absorption but very low bioavailability of oral resveratrol in humans. Drug Metab Dispos. 2004;32:1377–1382. doi: 10.1124/dmd.104.000885. [DOI] [PubMed] [Google Scholar]
- 4.Bertelli AAE. Pharmacokinetics and metabolism of resveratrol. In: Aggarwal BB, Shishodia S, editors. Resveratrol in Health and Disease. CRC Press; Boca Raton, FL: 2006. [Google Scholar]
- 5.Almeida L, Vaz-da-Silva M, Falcao A, Soares E, Costa R, Loureiro AI, Fernandes-Lopes C, Rocha JF, Nunes T, Wright L, Soares-da-Silva P. Pharmacokinetic and safety profile of trans-resveratrol in a rising multiple-dose study in healthy volunteers. Mol Nutr Food Res. 2009;53(Suppl 1):S7–15. doi: 10.1002/mnfr.200800177. [DOI] [PubMed] [Google Scholar]
- 6.Boocock DJ, Faust GE, Patel KR, Schinas AM, Brown VA, Ducharme MP, Booth TD, Crowell JA, Perloff M, Gescher AJ, Steward WP, Brenner DE. Phase I dose escalation pharmacokinetic study in healthy volunteers of resveratrol, a potential cancer chemopreventive agent. Cancer Epidemiol Biomarkers Prev. 2007;16:1246–1252. doi: 10.1158/1055-9965.EPI-07-0022. [DOI] [PubMed] [Google Scholar]
- 7.Calamini B, Ratia K, Malkowski MG, Cuendet M, Pezzuto JM, Santarsiero BD, Mesecar AD. Pleiotropic mechanisms facilitated by resveratrol and its metabolites. Biochem J. 2010;429:273–282. doi: 10.1042/BJ20091857. [DOI] [PMC free article] [PubMed] [Google Scholar]
- 8.Marier JF, Vachon P, Gritsas A, Zhang J, Moreau JP, Ducharme MP. Metabolism and disposition of resveratrol in rats: extent of absorption, glucuronidation, and enterohepatic recirculation evidenced by a linked-rat model. J Pharmacol Exp Ther. 2002;302:369–373. doi: 10.1124/jpet.102.033340. [DOI] [PubMed] [Google Scholar]
- 9.Juan ME, Maijo M, Planas JM. Quantification of trans-resveratrol and its metabolites in rat plasma and tissues by HPLC. J Pharm Biomed Anal. 2010;51:391–398. doi: 10.1016/j.jpba.2009.03.026. [DOI] [PubMed] [Google Scholar]
- 10.Wang LX, Heredia A, Song H, Zhang Z, Yu B, Davis C, Redfield R. Resveratrol glucuronides as the metabolites of resveratrol in humans: characterization, synthesis, and anti-HIV activity. Journal of pharmaceutical sciences. 2004;93:2448–2457. doi: 10.1002/jps.20156. [DOI] [PubMed] [Google Scholar]
- 11.Kawai N, Fujibayashi Y, Kuwabara S, Takao K-i, Ijuin Y, Kobayashi S. Synthesis of a Potential Key Intermediate of Akaterpin, Specific Inhibitor of PI-PLC. Tetrahedron. 2000;56:6467–6478. [Google Scholar]
- 12.Kawai N, Takao Ki, Kobayashi S. Synthetic study of akaterpin: Determination of the relative stereochemistry of the upper decalin moiety with disulfated hydroquinone. Tetrahedron Letters. 1999;40:4193–4196. [Google Scholar]
- 13.Fairley B, Botting NP, Cassidy A. The synthesis of daidzein sulfates. Tetrahedron. 2003;59:5407–5410. [Google Scholar]
- 14.Murias M, Miksits M, Aust S, Spatzenegger M, Thalhammer T, Szekeres T, Jaeger W. Metabolism of resveratrol in breast cancer cell lines: impact of sulfotransferase 1A1 expression on cell growth inhibition. Cancer Lett. 2008;261:172–182. doi: 10.1016/j.canlet.2007.11.008. [DOI] [PubMed] [Google Scholar]
- 15.Vitaglione P, Sforza S, Galaverna G, Ghidini C, Caporaso N, Vescovi PP, Fogliano V, Marchelli R. Bioavailability of trans-resveratrol from red wine in humans. Mol Nutr Food Res. 2005;49:495–504. doi: 10.1002/mnfr.200500002. [DOI] [PubMed] [Google Scholar]
- 16.Wenzel E, Soldo T, Erbersdobler H, Somoza V. Bioactivity and metabolism of trans-resveratrol orally administered to Wistar rats. Mol Nutr Food Res. 2005;49:482–494. doi: 10.1002/mnfr.200500003. [DOI] [PubMed] [Google Scholar]
- 17.Yu C, Shin YG, Chow A, Li Y, Kosmeder JW, Lee YS, Hirschelman WH, Pezzuto JM, Mehta RG, van Breemen RB. Human, rat, and mouse metabolism of resveratrol. Pharm Res. 2002;19:1907–1914. doi: 10.1023/a:1021414129280. [DOI] [PubMed] [Google Scholar]
- 18.Goodman and Gilman’s The Pharmacological Basis of Therapeutics. 10. McGraw-Hill; 2001. [Google Scholar]
- 19.Shah VP, Midha KK, Findlay JW, Hill HM, Hulse JD, McGilveray IJ, McKay G, Miller KJ, Patnaik RN, Powell ML, Tonelli A, Viswanathan CT, Yacobi A. Bioanalytical method validation--a revisit with a decade of progress. Pharm Res. 2000;17:1551–1557. doi: 10.1023/a:1007669411738. [DOI] [PubMed] [Google Scholar]
- 20.Soidinsalo O, Wähälä K. Synthesis of phytoestrogenic isoflavonoid disulfates. Steroids. 2004;69:613–616. doi: 10.1016/j.steroids.2004.03.015. [DOI] [PubMed] [Google Scholar]
- 21.Wang D, Hang T, Wu C, Liu W. Identification of the major metabolites of resveratrol in rat urine by HPLC-MS/MS. J Chromatogr B Analyt Technol Biomed Life Sci. 2005;829:97–106. doi: 10.1016/j.jchromb.2005.09.040. [DOI] [PubMed] [Google Scholar]
- 22.Boxenbaum H. Interspecies variation in liver weight, hepatic blood flow, and antipyrine intrinsic clearance: extrapolation of data to benzodiazepines and phenytoin. J Pharmacokinet Biopharm. 1980;8:165–176. doi: 10.1007/BF01065191. [DOI] [PubMed] [Google Scholar]
- 23.Davies B, Morris T. Physiological parameters in laboratory animals and humans. Pharm Res. 1993;10:1093–1095. doi: 10.1023/a:1018943613122. [DOI] [PubMed] [Google Scholar]
- 24.Kenealey JD, Subramanian L, van Ginkel P, Darjatmoko S, Lindstrom M, Somoza V, Ghosh S, Song Z, Hsung R, Kwon GS, Eliceiri K, Albert D, Polans A. Resveratrol Metabolites Do Not Elicit Early Pro-apoptotic Mechanisms in Neuroblastoma Cells. Journal of Agricultural and Food Chemistry. 2011;59:4979–4986. doi: 10.1021/jf104901g. [DOI] [PMC free article] [PubMed] [Google Scholar]
- 25.Miksits M, Wlcek K, Svoboda M, Kunert O, Haslinger E, Thalhammer T, Szekeres T, Jager W. Antitumor activity of resveratrol and its sulfated metabolites against human breast cancer cells. Planta medica. 2009;75:1227–1230. doi: 10.1055/s-0029-1185533. [DOI] [PubMed] [Google Scholar]
- 26.Wenzel E, Somoza V. Metabolism and bioavailability of trans-resveratrol. Mol Nutr Food Res. 2005;49:472–481. doi: 10.1002/mnfr.200500010. [DOI] [PubMed] [Google Scholar]
- 27.Hoshino J, Park EJ, Kondratyuk TP, Marler L, Pezzuto JM, van Breemen RB, Mo S, Li Y, Cushman M. Selective synthesis and biological evaluation of sulfate-conjugated resveratrol metabolites. J Med Chem. 2010;53:5033–5043. doi: 10.1021/jm100274c. [DOI] [PMC free article] [PubMed] [Google Scholar]
- 28.Kapetanovic IM, Muzzio M, Huang Z, Thompson TN, McCormick DL. Pharmacokinetics, oral bioavailability, and metabolic profile of resveratrol and its dimethylether analog, pterostilbene, in rats. Cancer chemotherapy and pharmacology. 2010;68:593–601. doi: 10.1007/s00280-010-1525-4. [DOI] [PMC free article] [PubMed] [Google Scholar]
- 29.Brown VA, Patel KR, Viskaduraki M, Crowell JA, Perloff M, Booth TD, Vasilinin G, Sen A, Schinas AM, Piccirilli G, Brown K, Steward WP, Gescher AJ, Brenner DE. Repeat dose study of the cancer chemopreventive agent resveratrol in healthy volunteers: safety, pharmacokinetics, and effect on the insulin-like growth factor axis. Cancer Res. 2010;70:9003–9011. doi: 10.1158/0008-5472.CAN-10-2364. [DOI] [PMC free article] [PubMed] [Google Scholar]
- 30.Nunes T, Almeida L, Rocha JF, Falcao A, Fernandes-Lopes C, Loureiro AI, Wright L, Vaz-da-Silva M, Soares-da-Silva P. Pharmacokinetics of trans-resveratrol following repeated administration in healthy elderly and young subjects. J Clin Pharmacol. 2009;49:1477–1482. doi: 10.1177/0091270009339191. [DOI] [PubMed] [Google Scholar]
- 31.Azorin-Ortuno M, Yanez-Gascon MJ, Pallares FJ, Vallejo F, Larrosa M, Garcia-Conesa MT, Tomas-Barberan F, Espin JC. Pharmacokinetic Study of trans-Resveratrol in Adult Pigs. J Agric Food Chem. 2010 doi: 10.1021/jf102799m. [DOI] [PubMed] [Google Scholar]
- 32.Vitrac X, Desmouliere A, Brouillaud B, Krisa S, Deffieux G, Barthe N, Rosenbaum J, Merillon JM. Distribution of [14C]-trans-resveratrol, a cancer chemopreventive polyphenol, in mouse tissues after oral administration. Life Sci. 2003;72:2219–2233. doi: 10.1016/s0024-3205(03)00096-1. [DOI] [PubMed] [Google Scholar]
- 33.Alfaras I, Perez M, Juan ME, Merino G, Prieto JG, Planas JM, Alvarez AI. Involvement of breast cancer resistance protein (BCRP1/ABCG2) in the bioavailability and tissue distribution of trans-resveratrol in knockout mice. J Agric Food Chem. 2010;58:4523–4528. doi: 10.1021/jf9042858. [DOI] [PubMed] [Google Scholar]
Associated Data
This section collects any data citations, data availability statements, or supplementary materials included in this article.