

Abstract
High-throughput screening (HTS) of large compound libraries has become a commonly used method for the identification of drug leads, and nonphysiological reducing agents have been widely used for HTS. However, a comparison of the difference in the HTS results based on the choice of reducing agent used and potency comparisons of selected inhibitors has not been done with the physiological reducing agent reduced glutathione (GSH). Here, we compared the effects of three reducing agents—dithiothreitol (DTT), β-mercaptoethanol (β-MCE), and tris(2-carboxyethyl)phosphine (TCEP)—as well as GSH against three drug target proteins. Approximately 100,000 compounds were computationally screened for each target protein, and experimental testing of high-scoring compounds (∼560 compounds) with the four reducing agents surprisingly produced many nonoverlapping hits. More importantly, we found that various reducing agents altered inhibitor potency (IC50) from approximately 10 μM with one reducing agent to complete loss (IC50 > 200 μM) of inhibitory activity with another reducing agent. Therefore, the choice of reducing agent in an HTS is critical because this may lead to the pursuit of falsely identified active compounds or failure to identify the true active compounds. We demonstrate the feasibility of using GSH for in vitro HTS assays with these three target enzymes.
Keywords: Reducing agent, Inhibitor screening, False positives, False negatives, Potency comparison
High-throughput screening (HTS) 1 of large compound libraries has become widely used for the identification of drug leads. Performing HTS is both expensive and time-consuming, and hence strict quality control is essential. To eliminate compounds causing protein aggregation that are generally false positive hits, detergents (Triton, Tween, and Chaps) are added to assay buffers [1]. A carrier protein such as bovine serum albumin (BSA) is also added to decrease enzyme loss on the pipette or other surfaces as well as to stabilize the target enzyme in the reaction. The addition of a reducing agent to the assay is very important to prevent the oxidation of cysteines in the target proteins [2], [3] and to avoid selecting compounds that covalently interact with cysteines. There are three reducing agents commonly used for HTS assays: dithiothreitol (DTT), β-mercaptoethanol (β-MCE), and tris(2-carboxyethyl)phosphine (TCEP). Studies have shown that strong reducing agents such as DTT and TCEP can generate H2O2 by a chain reaction of oxidation–reduction (redox) cycling in the presence of redox cycling compounds (RCCs), which can lead to false positives [4], [5], [6], [7], [8], [9], [10]. This is not the case for weaker reducing agents such as reduced glutathione (GSH), β-MCE, and cysteine [6], [11]. Extensive studies have been done to reduce false positives in the presence of strong reducing agents. However, very few studies have been performed to investigate the reduction of false negatives by reducing agent selection [12], and no study has been done yet to compare the difference on the outcome of HTS and potencies (IC50 values) of selected compounds with various reducing agents as compared with the physiological reducing agent GSH. Therefore, we have examined the effect of the reducing agents DTT, β-MCE, TCEP, as well as the physiological reducing agent GSH, against three drug target proteins: human SARS-CoV 3-chymotrypsin-like protease (3CLpro), papain-like protease (PLpro), and NS3 from hepatitis C virus (HCV).
3CLpro and PLpro are cysteine proteases, whereas NS3 is a serine protease with a wide and shallow active site. The active site pocket of 3CLpro is open, whereas that of PLpro is relatively constricted, causing them to have different characteristics. In addition to being a diverse system to test the effects of reducing agents on compound screening assays, these proteases are attractive targets for new antiviral drug design due to their crucial roles in the viral replication process [13], [14], [15], [16], [17], [18], [19]. HCV is a major cause of chronic liver disease, affecting more than 170 million people (∼3% of the world population) [20]. The human SARS-CoV was responsible for a large-scale epidemic in 32 different countries on five continents between 2002 and 2003, causing approximately 8400 infections and 800 deaths [21], [22], [23]. In this work, our goal was to ensure the quality of our screening campaigns by testing the effect of the different reducing agents on our assay results. To avoid both false positives and false negatives, enzyme assays were performed for all three proteases against approximately 560 computationally prescreened compounds (out of a library of 100,000 compounds that were virtually screened for each target). We performed five parallel assays: one for each of the four reducing agents and one with no reducing agent. Here we present the effects of the reducing agents on the primary screening results and the potencies of screened inhibitors.
Materials and methods
Plasmid construction and purification of HCV NS3/4A, SARS-CoV 3CLpro, and PLpro
The genes of full-length HCV NS3 (HCV polyprotein residues 1027–1657) with a His-tag at the N terminus and NS4A (residues 1658–1711) were codon optimized, synthesized (BioBasic), and cloned into a pETDuet-1 vector for coexpression. Rosetta 2(DE3) cells (Novagen) containing the recombinant plasmid were grown in Luria–Bertani (LB) medium, and the NS3 and NS4A were overexpressed together by 0.5 mM isopropyl β-d-1-thiogalactopyranoside (IPTG) for 16 h at 25 °C. Harvested cells were lysed by sonication in lysis buffer (1 mg/ml lysozyme and protease inhibitor cocktail in buffer A: 50 mM Hepes [pH 7.6], 500 mM NaCl, 20 mM imidazole, 5 mM β-MCE, 0.2% Triton X-100, and 20% glycerol). The His-tag fused NS3 was purified by a HisTrap HP column (GE Healthcare) with a gradient of buffer B (50 mM Hepes [pH 7.6], 500 mM NaCl, 500 mM imidazole, 5 mM β-MCE, 0.2% Triton X-100, and 20% glycerol) followed by S-200 size exclusion column chromatography for further purification with buffer C (50 mM Hepes [pH 7.6], 500 mM NaCl, 1 mM DTT, 0.2% Triton X-100, and 20% glycerol).
The 3CLpro (SARS-CoV polyprotein residues 3241–3544) and the PLpro (residues 1541–1855) genes were prepared by codon-optimized gene synthesis and cloned into pGEX6p-1 and pET15b vectors, respectively. Overexpression and purification of 3CLpro and PLpro were similar to that of NS3 with minor adjustments to buffer components and steps for each protein.
Computational screening methods for SARS-CoV PLpro and HCV NS3
The Vernalis lead-like library (96,000 compounds) of the ZINC database (version 7.0) [24] was screened using a multistep screening protocol to select 181 compounds for purchase and enzymatic assay-based testing for inhibitory activity against the papain-like protease of SARS-CoV. A dynamic pharmacophore model was developed based on a multiple protein structure ensemble extracted from extended molecular dynamic simulations on the PLpro enzyme. The 96,000 compounds were screened using this pharmacophore model followed by a second filtering step of flexible docking using GOLD (version 4.0). Clustering using MOE (MACCS) was performed on the top-scoring compounds from the previous two screening steps to select 181 compounds for purchase. Compounds screened for the inhibition of the NS3/4A protease of HCV were from the clean lead-like subsets of the ZINC database (version 7.0) [24]. A multitiered docking protocol was used, with Surflex–Dock and eHiTs progressively used to screen the library to choose 192 compounds for purchase and testing (details will be published elsewhere).
Computational screening methods for SARS-CoV 3CLpro
The Vernalis lead-like and Clean lead-like subsets of the ZINC database (version 7.0) were screened for prioritizing compounds for experimental testing against the 3CLpro enzyme. The screening protocol employed tiered docking with consensus scoring along with dynamic pharmacophore-based screening. The tiered docking protocol involved docking with Surflex–Dock, followed by clustering to generate a representative set of diverse compounds. The representative sets were further redocked with GOLD followed by rescoring using Amber–Dock. Finally, the compounds were ranked using a rank–sum consensus method. The pregenerated conformations of each molecule of the representative set were compared with the pharmacophore model generated using computational solvent mapping (CSM). The top-scoring commercially available compounds from the pharmacophore hits were visually inspected to eliminate reactive compounds and those that did not efficiently span the binding site. Finally, 186 compounds were ordered for experimental assays.
Kinetic parameter determination for the three proteases
The activity of the NS3/4A complex and of SARS-CoV 3CLpro was measured by continuous kinetic assay with fluorescence resonance energy transfer (FRET)-based substrates Ac-DE-Dap(QXL520)-EE-Abu-ψ-[COO]AS-C(5-FAMsp)-NH2 and 5-FAM-TSATLQSGFRK(QXL520)-NH2, respectively (both from Anaspec). Both substrates generate fluorescence signals (excitation λ = 492 nm, emission λ = 520 nm) when a quencher QXL520 is cleaved by the respective protease. The PLpro activity was also measured by continuous kinetic assay with ubiquitin-derived substrate Z-Arg-Leu-Arg-Gly-Gly-AMC (Bachem Bioscience) that generates a fluorescence signal (excitation λ = 360 nm, emission λ = 450 nm) when aminomethyl coumarin (AMC) is cleaved. The HCV NS3/4A assay was performed in the assay buffer containing 50 mM Tris (pH 7.6), 0.25% Chaps, 15% glycerol, and 0.01 mg/ml BSA. A series of substrate concentrations (0–50 μM) was prepared in triplicate, and the enzyme reaction was initiated by adding HCV NS3/4A (10 nM final concentration). The same series of substrate concentrations without any enzyme was also measured as a control. The two SARS-CoV proteases, 3CLpro (50 nM) and PLpro (30 nM), were analyzed in the buffer containing 50 mM Hepes (pH 7.5), 0.01% Triton X-100, and 0.1 mg/ml BSA with a series of different substrate concentrations (0–1 mM for PLpro and 0–200 μM for 3CLpro). Fluorescence intensity was monitored continuously for 10 min with a POLARstar OPTIMA microplate reader (BMG LABTECH). All three protease assays were performed in 20 μl of final assay volume in 384-well low-volume microplates (Corning), and 2 mM of each reducing agent was added to the assay buffer except for the control sets. The Michaelis constant (K M) and maximal activity (V max) were calculated by fitting the data with a hyperbolic equation,
where y is the initial velocity and x is the concentration of substrate.
Initial compound screening with each of the four reducing agents
For initial inhibitor screening, 10 mM stock solutions of the 560 compounds (Chembridge, Asinex, Bioscreen, ChemDiv, Life Chemicals, and Enamine) were prepared in 100% dimethyl sulfoxide (DMSO) and diluted to 50-μM final concentrations with assay buffer (50 mM Hepes [pH 7.5], 0.01% Triton X-100, 0.1 mg/ml BSA, and 2% DMSO) for 3CLpro and PLpro and then incubated with 50 and 30 nM of 3CLpro and PLpro, respectively, for 10 min. The reaction was initiated by adding substrate at concentrations of 1 μM (NS3/4A), 16 μM (3CLpro), and 100 μM (PLpro) and was monitored by fluorescence intensity with a POLARstar OPTIMA microplate reader (BMG LABTECH). HCV NS3/4A screening was done similarly but with a different assay buffer (50 mM Tris [pH 7.6], 0.25% Chaps, and 0.01 mg/ml BSA) with a 10-nM NS3/4A concentration. All compounds were tested in duplicate, and each plate contained a total of 32 positive and 32 negative controls.
IC50 value determination by dose–response curve
IC50 values were measured in the same concentration of enzyme and substrate as initial screening with a series of compound concentrations (0–200 μM) in assay buffer containing 2% DMSO to improve compound solubility. The enzyme reaction was initiated by adding fluorogenic substrate, and its activity was continuously monitored for at least 10 min. The IC50 values were calculated by fitting with the three-parameter Hill equation,
with OriginPro 8.1 (OriginLab), where y is the percentage inhibition, x is the inhibitor concentration, n is the slope of the concentration–response curve (Hill slope), and a is the maximal inhibition from three independent assays.
GSH stability assays
The amounts of GSH and glutathione disulfide (GSSG) in assay buffer were measured with a commercial glutathione assay kit (BioVision) per assay instructions. The assay kit contains o-phthalaldehyde (OPA) that reacts with GSH (not GSSG) and generates fluorescence (excitation/emission = 340/420 nm). Each assay buffer was prepared in a 20 μl final assay volume with 2 mM GSH and in the absence of GSH as a control. All other assay buffer components were the same as indicated for assays. Another set of assay buffers with each protease was also prepared for comparison. OPA (2 μl) was added to detect the GSH amount for each sample and was incubated for 40 min at room temperature. GSH concentration was measured by fluorescence intensity detection with a POLARstar OPTIMA microplate reader (BMG LABTECH). For GSSG amount detection, GSH was quenched first by adding 2 μl of GSH quencher from the assay kit for 10 min, and GSSG was reduced by 2 μl of reducing agent mix followed by the addition of OPA to detect GSH (actual GSSG amount). All samples were kept at room temperature with an open lid to allow exposure to the air in order to mimic the usual HTS assay conditions. Both GSH and GSSG amounts were monitored over a 6-h time period.
Results
Virtual screening of inhibitors with three proteases
Approximately 100,000 compounds from the Vernalis lead-like library and Clean lead-like subsets of the ZINC database (version 7.0) [24] were screened using a multistep screening protocol. Dynamic pharmacophore models were developed based on a multiple protein structure ensemble. These pharmacophore models for each target were used as a first pass screening tool for the compounds followed by a second filtering step where a multitiered docking was performed using various programs, including GOLD (version 4.0), Surflex–Dock, and/or eHiTs (details will be published elsewhere). A total of 192, 186, and 181 high-scoring compounds were purchased for NS3/4A, 3CLpro, and PLpro, respectively.
Reducing agent effect on kinetic parameters
Using the correct concentration of substrate is very important for identifying inhibitors with different modes of inhibition. If the substrate concentration is too high (much higher than the Michaelis constant, K M), competitive inhibitors might not be detected (false negatives); if the substrate concentration is too low (much lower than K M), uncompetitive inhibitors will be missed [25]. We determined the K M and maximum activity (V max) of NS3/4A, 3CLpro, and PLpro with four reducing agents (DTT, TCEP, GSH, and, β-MCE) and without any reducing agent as a control (Table 1 ). Two of these (DTT and TCEP) are strong reducing agents, and the other two (GSH and β-MCE) are weaker ones.
Table 1.
Effect of four reducing agents on maximal activity (Vmax) and Michaelis constant (KM) of the three proteases.
| No reducing agent | DTT | GSH | TCEP | β-MCE | ||
|---|---|---|---|---|---|---|
| HCV NS3/4A | Vmax (RFU/10 min) | 111 ± 19 | 181 ± 21 | 151 ± 8 | 75 ± 15 | 161 ± 8 |
| KM (μM) | 2.5 ± 0.7 | 2.6 ± 0.5 | 2.3 ± 0.3 | 3.1 ± 1.0 | 2.5 ± 0.1 | |
| Kcat/KM ratio | 1.0 | 1.6 | 1.5 | 0.5 | 1.4 | |
| SARS-CoV 3CLpro | Vmax (RFU/10 min) | 418 ± 21 | 435 ± 12 | 516 ± 9 | 472 ± 18 | 453 ± 24 |
| KM (μM) | 16.1 ± 1.1 | 15.8 ± 0.5 | 16.1 ± 0.8 | 16.3 ± 0.7 | 14.8 ± 1.2 | |
| Kcat/KM ratio | 1.0 | 1.1 | 1.2 | 1.1 | 1.2 | |
| SARS-CoV PLpro | Vmax (RFU/10 min) | 282 ± 6 | 813 ± 36 | 449 ± 14 | 441 ± 41 | 438 ± 30 |
| KM (μM) | 92.5 ± 1.9 | 399 ± 16 | 141 ± 9 | 240 ± 25 | 117 ± 7 | |
| Kcat/KM ratio | 1.0 | 0.7 | 1.0 | 0.6 | 1.2 | |
Note: Rates of each substrate cleavage by the three proteases were measured as a function of the substrate concentration with no reducing agent or in the presence of each of the four reducing agents by continuous kinetic assay. Enzyme concentrations of HCV NS3/4A, 3CLpro, and PLpro used were 10, 50, and 30 nM, respectively. The KM values were calculated by fitting the data to a Michaelis–Menten equation built into OriginPro 8.1 (OriginLab), and standard errors were calculated from four independent assays.
In the case of NS3/4A, we found that the different reducing agents affected the V max to different degrees ranging from −32 to +63% (relative to the V max with no reducing agent), whereas K M was not affected. Although both TCEP and DTT are classified as strong reducing agents, TCEP decreased the enzyme efficiency (K cat/K M) of the NS3/4A by half, whereas DTT increased it by 1.6-fold. The K M of 3CLpro was very similar with all four reducing agents, and the V max was slightly increased by all four reducing agents. In contrast, the K M of PLpro was affected to different degrees depending on which reducing agent was used. The K M of PLpro increased by 4-, 1.5-, and 2.5-fold in the presence of DTT, GSH, and TCEP, respectively, when compared with the K M without any reducing agent (Table 1). This demonstrates that the reducing agents significantly affect the enzyme kinetic constants to differing degrees in different enzyme systems. These effects need to be taken into consideration when designing HTS assays.
Nonoverlapping false positives and false negatives
Initial compound screening for the three target proteins was performed with a total of approximately 560 purchased compounds in the absence of reducing agent and with each of the four reducing agents present in the assay. Each enzyme activity was also analyzed with a series of reducing agent concentrations ranging from 0 to 10 mM (see Fig. S1 in Supplementary material). All initial screening assays were done in duplicate in 384-well plates, and replicate plots and Z factors are shown (Fig. 1 ). The Z factor was calculated from the mean and standard deviation of 32 positive and 32 negative controls in each plate. Z factors of 3CLpro and PLpro ranged from 0.69 to 0.86 and from 0.72 to 0.90, respectively, which were better than the Z factor range of HCV NS3/4A (0.46–0.71). The duplicate reproducibility of 95% of total tested compounds agreed within 10, 10, and 20% for 3CLpro, PLpro, and NS3/4A, respectively. Compounds showing more than 35% inhibition at a 50 μM concentration were considered to be positive hits (or “positives”) (Table 2 ). Surprisingly, many nonoverlapping positive hit compounds were identified with each reducing agent against all three proteases, clearly indicating that reducing agents can significantly affect the HTS assay outcome from the initial screening process. The number of positives in the presence of either DTT or β-MCE is smaller than that in the presence of GSH, whereas TCEP selected the most positives in the case of NS3/4A and PLpro. On the other hand, β-MCE detected the highest number of positives, whereas DTT and TCEP selected fewer positives than GSH, in 3CLpro screenings.
Fig.1.
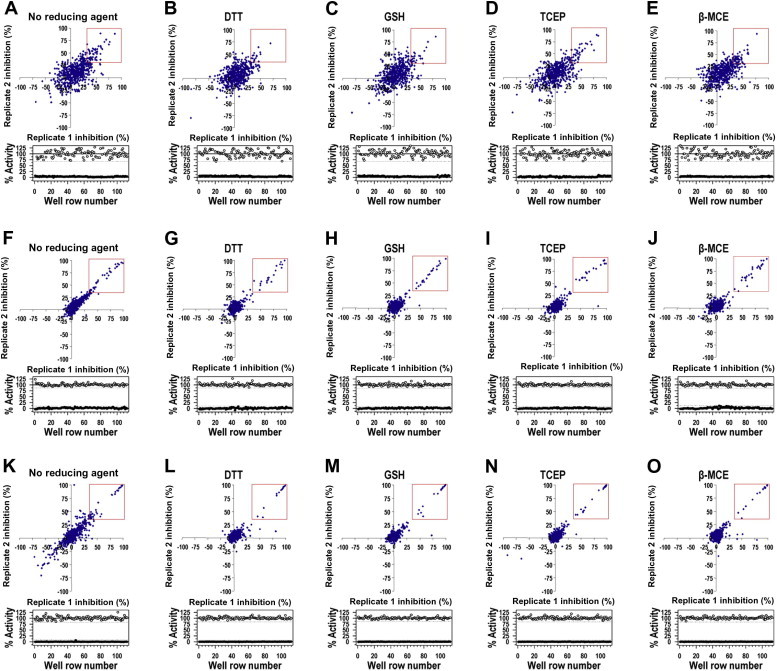
Initial compound screening results. Replicate plots (upper panels) and Z factors (lower panels) from 560 compounds for inhibition of NS3/4A (A–E), 3CLpro (F–J), and PLpro (K–O) are shown. All compounds were tested in duplicate by a continuous kinetic assay, and each plate contained a total of 32 positive (○) and 32 negative (●) controls. Compounds with more than 35% inhibition at a 50 μM concentration of compounds were considered to be positive hit compounds and are shown in red rectangles.
Table 2.
Numbers of hit compounds from primary screening.
| Overlapping positives | GSH positives | No reducing agent |
DTT |
TCEP |
β-MCE |
|||||||||
|---|---|---|---|---|---|---|---|---|---|---|---|---|---|---|
| Positives | False positives | False negatives | Positives | False positives | False negatives | Positives | False positives | False negatives | Positives | False positives | False negatives | |||
| HCV NS3/4A | 9 | 34 | 34 | 14 | 14 | 28 | 12 | 18 | 39 | 18 | 13 | 32 | 13 | 15 |
| SARS-CoV 3CLpro | 14 | 25 | 42 | 19 | 2 | 19 | 2 | 8 | 22 | 2 | 5 | 27 | 5 | 3 |
| SARS-CoV PLpro | 13 | 22 | 35 | 15 | 2 | 16 | 3 | 9 | 25 | 5 | 2 | 21 | 6 | 7 |
Note: Compounds with more than 35% inhibition at a 50 μM concentration were considered to be positive hit compounds for each reducing agent, and positives with GSH were considered to be true positive hits.
We define true positives to be the ones with GSH because GSH is the primary intracellular physiological reducing agent in human cells where all three of our target enzymes function. The goal of our compound screening is to identify inhibitors for viral enzymes that will be developed into antivirals. Thus, identifying inhibitors that are active in human cells where GSH is present at high concentration is most logical. In addition, it may be good to test the inhibitory activity of hit compounds against GSSG, which is predominant in serum, because compounds will likely pass through human serum before reaching the intracellular environment. Based on this definition of true positives, we found that TCEP produced the largest number of false positives in the case of NS3/4A. The most false positives were identified in the absence of reducing agent against the two cysteine proteases 3CLpro and PLpro, indicating the necessity of using reducing agents for these two enzymes (Table 2; see also Tables S1–S3 in Supplementary material). DTT showed the largest number of false negatives (compounds identified as positives with GSH) for NS3/4A, and TCEP showed the smallest number, although both are strong reducing agents. These two strong reducing agents showed more false negatives against 3CLpro. On the other hand, DTT showed 9 compounds to be false negatives for PLpro, whereas TCEP, the other strong reducing agent, showed only 2 false negatives. We also analyzed the same data with a 50% inhibition cutoff as compared with a 35% cutoff for positive hits. Overall, the results came out similar, although the numbers of hits are obviously smaller with a 50% cutoff. DTT still showed the most false negatives with all three proteases, and TCEP showed the least with NS3/4A and PLpro. The number of false negatives with TCEP and β-MCE was significantly reduced for both NS3/4A and PLpro with a 50% cutoff. In the case of 3CLpro, all three reducing agents had both false positives and false negatives, and the numbers are only slightly less than those for a 35% cutoff.
Potency (IC50) comparison of hit compounds in each reducing agent
To investigate the reducing agent effect on the potency of screened compounds, IC50 values were compared for each of the reducing agents studied. Surprisingly, the IC50 values of most positive hits from all three targets were significantly affected by the types of reducing agents (Fig. 2 ). In the case of NS3/4A, the IC50 values of 14 compounds were significantly affected, showing a loss of inhibitory activity for 9 compounds in the presence of DTT and/or β-MCE (inhibitors 1–6 in Fig. 2A and inhibitors 36–38 in Table S4 of Supplementary material). For example, the IC50 of inhibitor 3 against NS3/4A was 48.4 μM when no reducing agent was present. This IC50 did not change by much in the presence of GSH (IC50 = 69.4 μM), but it decreased by 5-fold in the presence of TCEP (IC50 = 12.8 μM). The same compound showed no inhibition (IC50 > 200 μM) in the presence of either DTT or β-MCE. Among the 3CLpro positives, there were 6 inhibitors (inhibitors 13–18 in Fig. 2B) that exhibited loss of inhibitory activity in the presence of either DTT or TCEP or even without any reducing agent, and 6 PLpro inhibitors (inhibitors 25–30 in Fig. 2C) were also not detected in the presence of either DTT or β-MCE.
Fig.2.
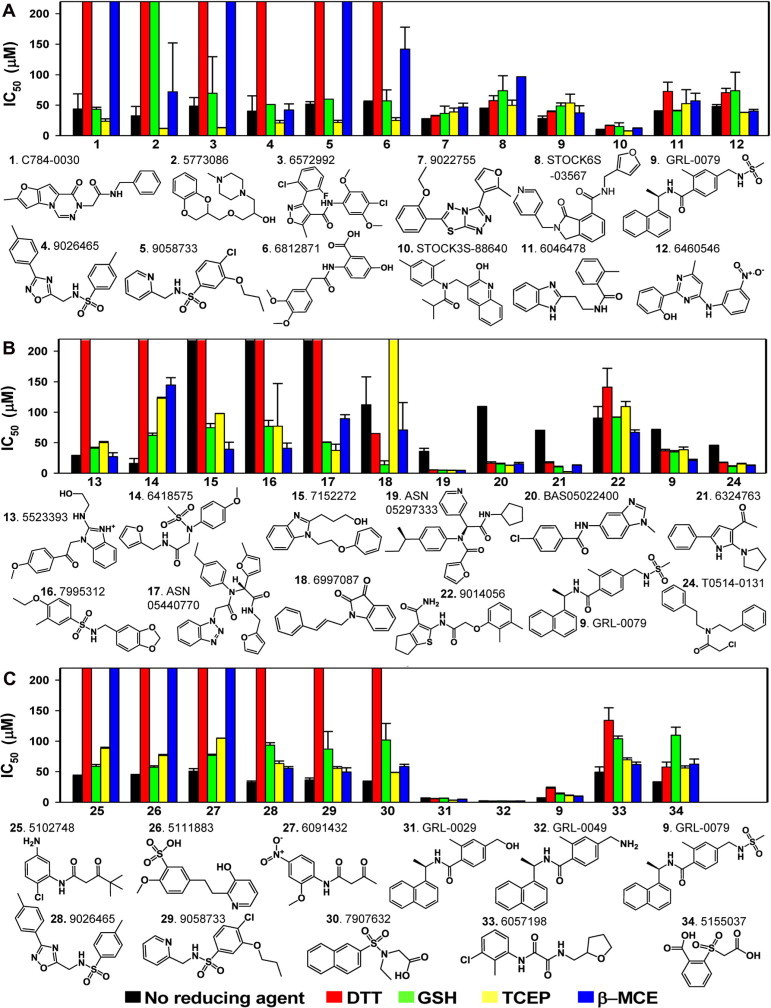
Comparisons of the IC50 values of active compounds against NS3/4A (A), 3CLpro (B), and PLpro (C) in the absence and in the presence of four reducing agents. All compounds were tested in triplicate for IC50 determination, and each plate contained a total of 32 positive and 32 negative controls. Bars that reach to the top represent IC50 values of more than 200 μM (no inhibitory effect). IC50 values were calculated by fitting the data to the three-parameter Hill equation with OriginPro 8.1 (OriginLab). See also Table S4 in Supplementary material.
DTT seems to produce the most false negatives in all three protease screenings. We compared the average Hill slope values of compounds that display dramatic shifts in IC50 values in the presence of DTT to determine whether DTT prevents inhibition in the assay by eliminating an aggregation-based inhibition. For NS3/4A, the average Hill slope values of all 9 compounds (compounds 1–6 and 36–38) were near 1 for all three reducing agents except for 1 compound (compound 6). The Hill slope of compound 6 was near 1 in the presence of GSH, but it was near 2 in the presence of both TCEP and β-MCE. Similarly, among 6 3CLpro hit compounds that lost their inhibitory activity in the presence of DTT (or TCEP), the Hill slope values of all those compounds were near 1 with at least one other reducing agent. In the case of PLpro hits, the Hill slopes of 3 compounds (compounds 25–27) increased with GSH and TCEP, but those of the other 3 compounds (compounds 28–30) were still near 1 with both GSH and β-MCE. Although a few compounds (3 of 20 negatives with DTT) may have produced aggregation-based inhibition, the majority of hit compounds that showed dramatic shifts in IC50 values did not produce the aggregation-based inhibition. According to this analysis, DTT does not generally appear to prevent aggregation-based nonspecific inhibition for the majority of the negatives.
Therefore, these data demonstrate that the inhibitory activity of the compounds screened against both serine and cysteine proteases were greatly affected by the reducing agent used in the assay.
Stability of GSH in assay buffers
Finally, we studied the stability of GSH in assay buffers. IC50 value comparisons revealed that reducing agents significantly affect inhibitory activities of screened compounds, and this leads to an important question: which IC50 values should we consider to be a true indicator of potency for inhibitors? We suggest that IC50 values with GSH should be considered to be the best indicator of in vivo efficacy, at least for intracellular enzyme targets, because GSH is the physiological reducing agent in the human body. However, GSH has not been used as a reducing agent in HTS assays due to concerns of potential oxidation under assay conditions. GSH is known to undergo oxidation in aqueous buffer conditions, forming the disulfide bonded GSSG. We carried out a detailed study on the stability of GSH by monitoring both GSH and GSSG amounts and found that only 10% of GSH was oxidized to GSSG over a 6-h time period at room temperature. The presence of NS3/4A in the assay buffer did not affect the stability of GSH (Fig. 3 A), whereas GSH was slightly stabilized by the two cysteine proteases, 3CLpro and PLpro, as compared with GSH alone (Fig. 3B and 3C). Thus, it is feasible to use GSH as a reducing agent in an HTS assay for up to a 6-h time period provided that fresh GSH is added to the assay buffer every 6 h.
Fig.3.
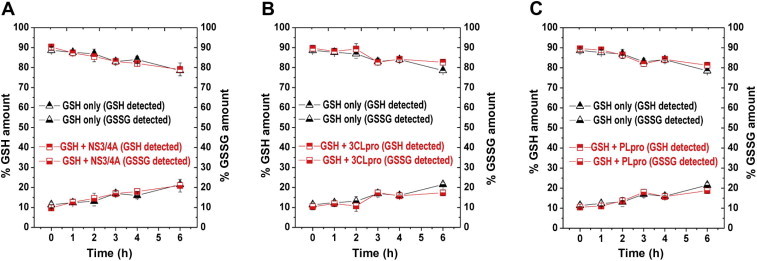
Stability of GSH in assay buffers. GSH and GSSG amounts in the absence (black triangles) and in the presence (red squares) of NS3/4A (A), 3CLpro (B), and PLpro (C) are shown. The commercial assay kit (BioVision) contains o-phthalaldehyde (OPA) that reacts with GSH (not GSSG) and generates fluorescence (excitation/emission = 340/420 nm). All measurements were done following assay instructions.
Discussion and conclusion
HTS can produce both false positives and false negatives. Although the former can be eliminated in secondary or tertiary assays with some time and effort, false negatives from the initial HTS assays can derail the efforts of drug discovery through the loss of potentially novel inhibitors. Our results suggest that each reducing agent could have different effects on substrate affinity and enzyme activity in the case of both cysteine and serine proteases. The enzyme efficiency of NS3/4A and PLpro was affected by the type of reducing agent, whereas 3CLpro efficiency was not affected. Both 3CLpro and PLpro contain cysteine residues in their active sites, but the reducing agents had very different effects on their kinetic parameters. The types of reducing agents affected the three proteases in different ways. This observation was not in keeping with the presumed role of the reducing agents as antioxidants. It has been suggested that reducing agents may have some additional functions other than working as simple antioxidants [12], [26], [27], [28]. A recent study showed that DTT weakened the monomer interaction of HIV-1 integrase (IN) when it forms a dimer [28]. For each target enzyme, additional roles of reducing agent remain to be discovered.
Our results show that both strong and weak reducing agents can produce both false positives and false negatives, and therefore both cases have potential risks of missing positive hit compounds that could lead to novel inhibitors. Although it remains to be determined exactly how reducing agents affect apparent activity, it is important to note that the outcome of any HTS assay can be seriously affected by the choice of reducing agent. In addition, as they pursue lead compounds, researchers rely on the IC50 value of an inhibitor as an indicator of compound potency. It also would be problematic if different reducing agents could alter the potency of screened compounds. We discovered that the potency of the same inhibitor was altered from approximately 10 μM with one reducing agent to the complete loss of inhibitory activity (IC50 > 200 μM) with another. This is a very significant difference, and hence the choice of a proper reducing agent is critical because this may lead to the pursuit of poor lead compounds (false positives) or to missing good potential lead candidates (false negatives).
Therefore, while performing an HTS run, it is important to be aware of the effect of different reducing agents on the enzyme system in order to pick the right condition for a specific HTS run. We suggest the use of GSH rather than other commonly used nonphysiological reducing agents. If GSH cannot be used for certain assays, performing a test set assay with a small number of compounds, including some known inhibitors with various reducing agents, may be useful for identifying a nonphysiological reducing agent that could detect the largest number of known inhibitors. This simple experiment could significantly improve the quality of the following HTS.
Contributions
H.L. performed all experiments with assistance from J.T. and L.T., R.C. performed computational selection of inhibitors for PLpro and NS3/4A, A.M. performed computational selection of inhibitors for 3CLpro, and H.L. and M.E.J. designed the experiments and wrote the manuscript.
Acknowledgment
We thank Kirk E. Hevener and Shahila Mehboob for helpful comments on this manuscript. This work was supported by National Institutes of Health (NIH) research grants P01 AI060915 and R56 AI089535 to M.E.J.
Footnotes
Abbreviations used: HTS, high-throughput screening; BSA, bovine serum albumin; DTT, dithiothreitol; β-MCE, β-mercaptoethanol; TCEP, tris(2-carboxyethyl)phosphine; RCC, redox cycling compound; GSH, reduced glutathione; 3CLpro, 3-chymotrypsin-like protease; PLpro, papain-like protease; HCV, hepatitis C virus; CSM, computational solvent mapping; DMSO, dimethyl sulfoxide; GSSG. glutathione disulfide; OPA, o-phthalaldehyde.
Supplementary data associated with this article can be found, in the online version, at doi:10.1016/j.ab.2012.01.006.
Appendix A. Supplementary data
Supplementary material
References
- 1.Feng B.Y., Shoichet B.K. A detergent-based assay for the detection of promiscuous inhibitors. Nat. Protoc. 2006;1:550–553. doi: 10.1038/nprot.2006.77. [DOI] [PMC free article] [PubMed] [Google Scholar]
- 2.Johnston P.A., Foster C.A., Shun T.Y., Skoko J.J., Shinde S., Wipf P., Lazo J.S. Development and implementation of a 384-well homogeneous fluorescence intensity high-throughput screening assay to identify mitogen-activated protein kinase phosphatase-1 dual-specificity protein phosphatase inhibitors. Assay Drug Dev. Technol. 2007;5:319–332. doi: 10.1089/adt.2007.066. [DOI] [PubMed] [Google Scholar]
- 3.Tierno M.B., Johnston P.A., Foster C., Skoko J.J., Shinde S.N., Shun T.Y., Lazo J.S. Development and optimization of high-throughput in vitro protein phosphatase screening assays. Nat. Protoc. 2007;2:1134–1144. doi: 10.1038/nprot.2007.155. [DOI] [PubMed] [Google Scholar]
- 4.Lor L.A., Schneck J., McNulty D.E., Diaz E., Brandt M., Thrall S.H., Schwartz B. A simple assay for detection of small-molecule redox activity. J. Biomol. Screen. 2007;12:881–890. doi: 10.1177/1087057107304113. [DOI] [PubMed] [Google Scholar]
- 5.Brisson M., Nguyen T., Wipf P., Joo B., Day B.W., Skoko J.S., Schreiber E.M., Foster C., Bansal P., Lazo J.S. Redox regulation of Cdc25B by cell-active quinolinediones. Mol. Pharmacol. 2005;68:1810–1820. doi: 10.1124/mol.105.016360. [DOI] [PubMed] [Google Scholar]
- 6.Johnston P.A., Soares K.M., Shinde S.N., Foster C.A., Shun T.Y., Takyi H.K., Wipf P., Lazo J.S. Development of a 384-well colorimetric assay to quantify hydrogen peroxide generated by the redox cycling of compounds in the presence of reducing agents. Assay Drug Dev. Technol. 2008;6:505–518. doi: 10.1089/adt.2008.151. [DOI] [PMC free article] [PubMed] [Google Scholar]
- 7.Smith G.K., Barrett D.G., Blackburn K., Cory M., Dallas W.S., Davis R., Hassler D., McConnell R., Moyer M., Weaver K. Expression, preparation, and high-throughput screening of caspase-8: discovery of redox-based and steroid diacid inhibition. Arch. Biochem. Biophys. 2002;399:195–205. doi: 10.1006/abbi.2002.2757. [DOI] [PubMed] [Google Scholar]
- 8.Crowe A., Ballatore C., Hyde E., Trojanowski J.Q., Lee V.M. High throughput screening for small molecule inhibitors of heparin-induced tau fibril formation. Biochem. Biophys. Res. Commun. 2007;358:1–6. doi: 10.1016/j.bbrc.2007.03.056. [DOI] [PMC free article] [PubMed] [Google Scholar]
- 9.Bova M.P., Mattson M.N., Vasile S., Tam D., Holsinger L., Bremer M., Hui T., McMahon G., Rice A., Fukuto J.M. The oxidative mechanism of action of ortho-quinone inhibitors of protein–tyrosine phosphatase alpha is mediated by hydrogen peroxide. Arch. Biochem. Biophys. 2004;429:30–41. doi: 10.1016/j.abb.2004.05.010. [DOI] [PubMed] [Google Scholar]
- 10.Keinan S., Paquette W.D., Skoko J.J., Beratan D.N., Yang W., Shinde S., Johnston P.A., Lazo J.S., Wipf P. Computational design, synthesis, and biological evaluation of para-quinone-based inhibitors for redox regulation of the dual-specificity phosphatase Cdc25B. Org. Biomol. Chem. 2008;6:3256–3263. doi: 10.1039/b806712k. [DOI] [PMC free article] [PubMed] [Google Scholar]
- 11.Soares K.M., Blackmon N., Shun T.Y., Shinde S.N., Takyi H.K., Wipf P., Lazo J.S., Johnston P.A. Profiling the NIH small molecule repository for compounds that generate H2O2 by redox cycling in reducing environments. Assay Drug Dev. Technol. 2010;8:152–174. doi: 10.1089/adt.2009.0247. [DOI] [PMC free article] [PubMed] [Google Scholar]
- 12.Okun I., Malarchuk S., Dubrovskaya E., Khvat A., Tkachenko S., Kysil V., Kravchenko D., Ivachtchenko A. Screening for caspase-3 inhibitors: effect of a reducing agent on identified hit chemotypes. J. Biomol. Screen. 2006;11:694–703. doi: 10.1177/1087057106289231. [DOI] [PubMed] [Google Scholar]
- 13.Simmonds P., Bukh J., Combet C., Deleage G., Enomoto N., Feinstone S., Halfon P., Inchauspe G., Kuiken C., Maertens G., Mizokami M., Murphy D.G., Okamoto H., Pawlotsky J.M., Penin F., Sablon E., Shin I.T., Stuyver L.J., Thiel H.J., Viazov S., Weiner A.J., Widell A. Consensus proposals for a unified system of nomenclature of hepatitis C virus genotypes. Hepatology. 2005;42:962–973. doi: 10.1002/hep.20819. [DOI] [PubMed] [Google Scholar]
- 14.Dubuisson J., Helle F., Cocquerel L. Early steps of the hepatitis C virus life cycle. Cell Microbiol. 2008;10:821–827. doi: 10.1111/j.1462-5822.2007.01107.x. [DOI] [PubMed] [Google Scholar]
- 15.Evans M.J., von Hahn T., Tscherne D.M., Syder A.J., Panis M., Wolk B., Hatziioannou T., McKeating J.A., Bieniasz P.D., Rice C.M. Claudin-1 is a hepatitis C virus co-receptor required for a late step in entry. Nature. 2007;446:801–805. doi: 10.1038/nature05654. [DOI] [PubMed] [Google Scholar]
- 16.Zheng A., Yuan F., Li Y., Zhu F., Hou P., Li J., Song X., Ding M., Deng H. Claudin-6 and claudin-9 function as additional coreceptors for hepatitis C virus. J. Virol. 2007;81:12465–12471. doi: 10.1128/JVI.01457-07. [DOI] [PMC free article] [PubMed] [Google Scholar]
- 17.Rocha-Perugini V., Montpellier C., Delgrange D., Wychowski C., Helle F., Pillez A., Drobecq H., Le Naour F., Charrin S., Levy S., Rubinstein E., Dubuisson J., Cocquerel L. The CD81 partner EWI-2wint inhibits hepatitis C virus entry. PLoS One. 2008;3:e1866. doi: 10.1371/journal.pone.0001866. [DOI] [PMC free article] [PubMed] [Google Scholar]
- 18.Yang H., Bartlam M., Rao Z. Drug design targeting the main protease, the Achilles’ heel of coronaviruses. Curr. Pharm. Des. 2006;12:4573–4590. doi: 10.2174/138161206779010369. [DOI] [PubMed] [Google Scholar]
- 19.Ziebuhr J. The coronavirus replicase. Curr. Top. Microbiol. Immunol. 2005;287:57–94. doi: 10.1007/3-540-26765-4_3. [DOI] [PMC free article] [PubMed] [Google Scholar]
- 20.Seeff L.B. Natural history of chronic hepatitis C. Hepatology. 2002;36:S35–S46. doi: 10.1053/jhep.2002.36806. [DOI] [PubMed] [Google Scholar]
- 21.Peiris J.S., Lai S.T., Poon L.L., Guan Y., Yam L.Y., Lim W., Nicholls J., Yee W.K., Yan W.W., Cheung M.T., Cheng V.C., Chan K.H., Tsang D.N., Yung R.W., Ng T.K., Yuen K.Y. Coronavirus as a possible cause of severe acute respiratory syndrome. Lancet. 2003;361:1319–1325. doi: 10.1016/S0140-6736(03)13077-2. [DOI] [PMC free article] [PubMed] [Google Scholar]
- 22.Ksiazek T.G., Erdman D., Goldsmith C.S., Zaki S.R., Peret T., Emery S., Tong S., Urbani C., Comer J.A., Lim W., Rollin P.E., Dowell S.F., Ling A.E., Humphrey C.D., Shieh W.J., Guarner J., Paddock C.D., Rota P., Fields B., DeRisi J., Yang J.Y., Cox N., Hughes J.M., LeDuc J.W., Bellini W.J., Anderson L.J. A novel coronavirus associated with severe acute respiratory syndrome. N. Engl. J. Med. 2003;348:1953–1966. doi: 10.1056/NEJMoa030781. [DOI] [PubMed] [Google Scholar]
- 23.Drosten C., Gunther S., Preiser W., van der Werf S., Brodt H.R., Becker S., Rabenau H., Panning M., Kolesnikova L., Fouchier R.A., Berger A., Burguiere A.M., Cinatl J., Eickmann M., Escriou N., Grywna K., Kramme S., Manuguerra J.C., Muller S., Rickerts V., Sturmer M., Vieth S., Klenk H.D., Osterhaus A.D., Schmitz H., Doerr H.W. Identification of a novel coronavirus in patients with severe acute respiratory syndrome. N. Engl. J. Med. 2003;348:1967–1976. doi: 10.1056/NEJMoa030747. [DOI] [PubMed] [Google Scholar]
- 24.Irwin J.J., Shoichet B.K. ZINC—a free database of commercially available compounds for virtual screening. J. Chem. Inf. Model. 2005;45:177–182. doi: 10.1021/ci049714. [DOI] [PMC free article] [PubMed] [Google Scholar]
- 25.Macarron R., Hertzberg R.P. Design and implementation of high throughput screening assays. Mol. Biotechnol. 2011;47:270–285. doi: 10.1007/s12033-010-9335-9. [DOI] [PubMed] [Google Scholar]
- 26.Lee D., Long S.A., Adams J.L., Chan G., Vaidya K.S., Francis T.A., Kikly K., Winkler J.D., Sung C.M., Debouck C., Richardson S., Levy M.A., DeWolf W.E., Jr., Keller P.M., Tomaszek T., Head M.S., Ryan M.D., Haltiwanger R.C., Liang P.H., Janson C.A., McDevitt P.J., Johanson K., Concha N.O., Chan W., Abdel-Meguid S.S., Badger A.M., Lark M.W., Nadeau D.P., Suva L.J., Gowen M., Nuttall M.E. Potent and selective nonpeptide inhibitors of caspases 3 and 7 inhibit apoptosis and maintain cell functionality. J. Biol. Chem. 2000;275:16007–16014. doi: 10.1074/jbc.275.21.16007. [DOI] [PubMed] [Google Scholar]
- 27.Lee D., Long S.A., Murray J.H., Adams J.L., Nuttall M.E., Nadeau D.P., Kikly K., Winkler J.D., Sung C.M., Ryan M.D., Levy M.A., Keller P.M., DeWolf W.E., Jr. Potent and selective nonpeptide inhibitors of caspases 3 and 7. J. Med. Chem. 2001;44:2015–2026. doi: 10.1021/jm0100537. [DOI] [PubMed] [Google Scholar]
- 28.Tsiang M., Jones G.S., Hung M., Samuel D., Novikov N., Mukund S., Brendza K.M., Niedziela-Majka A., Jin D., Liu X., Mitchell M., Sakowicz R., Geleziunas R. Dithiothreitol causes HIV-1 integrase dimer dissociation while agents interacting with the integrase dimer interface promote dimer formation. Biochemistry. 2011;50:1567–1581. doi: 10.1021/bi101504w. [DOI] [PubMed] [Google Scholar]
Associated Data
This section collects any data citations, data availability statements, or supplementary materials included in this article.
Supplementary Materials
Supplementary material