


Abstract
Compensatory mutations in RNA are generally regarded as those that maintain base pairing, and their identification forms the basis of phylogenetic predictions of RNA secondary structure. However, other types of compensatory mutations can provide higher-order structural and evolutionary information. Here, we present a helix-length compensation study for investigating structure–function relationships in RNA. The approach is demonstrated for stem-loop I and stem-loop V of the Neurospora VS ribozyme, which form a kissing–loop interaction important for substrate recognition. To rapidly characterize the substrate specificity (kcat/KM) of several substrate/ribozyme pairs, a procedure was established for simultaneous kinetic characterization of multiple substrates. Several active substrate/ribozyme pairs were identified, indicating the presence of limited substrate promiscuity for stem Ib variants and helix-length compensation between stems Ib and V. 3D models of the I/V interaction were generated that are compatible with the kinetic data. These models further illustrate the adaptability of the VS ribozyme architecture for substrate cleavage and provide global structural information on the I/V kissing–loop interaction. By exploring higher-order compensatory mutations in RNA our approach brings a deeper understanding of the adaptability of RNA structure, while opening new avenues for RNA research.
INTRODUCTION
Compensatory mutations play an important role in the evolution of macromolecular systems. Their identification has proven to be important for the characterization of macromolecular structure and for revealing important aspects of function. Studies of compensatory mutations in functional RNA molecules are particularly informative, because of the simple base-pairing rules that govern the formation of RNA helical structures. Compensatory mutations in RNA are therefore generally seen as those that maintain base pairing interactions, and their identification has been central for comparative sequence analyses in the prediction of RNA secondary structures and for phylogenetic analyses.
Compensatory mutations in RNA are not strictly limited to base-pairing interactions. Other types of structural compensations, such as helix-length compensation, can help provide higher-order structural and evolutionary information. The concept of helix-length compensation was first introduced in the prediction of coaxially stacked helices for rRNAs (1). It was suggested that since coaxially stacked helices are expected to maintain a constant overall length in a functional RNA architecture, comparative sequence analysis could support coaxially stacked helices when one helix in a group of organisms is shorter, while its partner helix in that group is longer by the same number of base pairs (1). In support of this theory, comparative sequence analysis previously predicted the existence of coaxially stacked helices in 23S rRNA [helices 2646–2652/2668–2674 and 2675–2680/2727–2732; (2)], which was subsequently confirmed in the X-ray structure of the 50S rRNA subunit (3). Coaxial stacking of the group I intron P1 and P2 helices were also previously inferred from helix-length variations (4) and later confirmed from crystal structures (5,6). A more elaborate investigation of tertiary structure compensation has been previously reported as part of a comparative sequence analysis of mitochondrial tRNA sequences that do not fit the standard cloverleaf consensus (7). 3D modeling helped describe several types of structural compensations, including helix-length compensations, that can help maintain the global L-shape in these atypical tRNAs (7).
In this work, we extend the concept of helix-length compensation for structure–function studies of RNA using the Neurospora Varkud satellite (VS) ribozyme as a model system [for reviews, see (8–10); Figure 1A]. Like other nucleolytic ribozymes, the VS ribozyme adopts a simple RNA architecture that allows phosphodiester cleavage activity. Notably, the VS ribozyme has the unique ability to specifically recognize its stem-loop I (SLI) substrate through formation of a kissing-loop interaction with stem-loop V [SLV; (11–13)]. This I/V kissing-loop interaction of the VS ribozyme is ideally suited for performing helix-length compensation studies since variant substrates and ribozymes can be synthesized separately and then mixed in various combinations for kinetic characterization (Figure 1B). Furthermore, in the 3D models of the VS ribozyme, helices I and V are extended away from each other in a similar manner as coaxially stacked helices (14–18). It is expected that adding (or removing) base pairs within stem Ib would disrupt productive docking of the SLI cleavage loop with the A730 loop of stem-loop VI to form the proposed active site (10,19–27) and significantly reduce cleavage activity, as previously observed for stem V length variants (16,28). We hypothesize that cleavage activity of stem Ib length variants could be restored by adjusting the number of base pairs within stem V of the ribozyme, such that the total number of base pairs within stems Ib and V is preserved (Figure 1B). To explore this possibility, we combined kinetic characterization of variants and 3D modeling. Our helix-compensation study with the VS ribozyme provides global structural information and reveals the adaptability of RNA architecture.
Figure 1.

Primary and secondary structures of the substrate/ribozyme (S/R) pairs characterized here. (A) Parental VS ribozyme (R0) and substrate (S0). Substrate recognition involves a kissing-loop interaction between residues 630-632 of S0 and 697–699 of R0. The arrowhead points to the cleavage site and the dashed box encloses the region under investigation. (B) Variant S/R pairs. Only the mutated regions are shown along with the nomenclature of the mutated substrates and ribozymes.
MATERIALS AND METHODS
Plasmids
The pAvapl plasmid used for transcription of Avapl (Figure 1A) was constructed by PCR from the A-3 clone (18,29). The plasmids for transcription of Avapl ribozyme variants (Figure 1B) were prepared by QuikChangeII site-directed mutagenesis from pAvapl (Stratagene, CA). All plasmids were validated by DNA sequencing.
Preparation of RNA for kinetic studies
The R0 ribozyme and variant sequences (Figure 1) were prepared by in vitro T7 RNA polymerase transcription from the pAvapl plasmid (or derivatives) linearized at the AvaI site. All ribozymes were purified as previously described (18). The S0 substrate and variant sequences (Figure 1) were synthesized in vitro using T7 RNA polymerase and a single-stranded synthetic oligonucleotide template (Integrated DNA Technologies, IA). They were purified by denaturing gel electrophoresis, dephosphorylated with calf alkaline phosphatase and 5′-end-labeled with γ-(32P) ATP (PerkinElmer, Ont.) using established procedures (18).
Single-substrate kinetic studies
All reactions were carried out at 30°C in reaction buffer (50 mM Tris pH 7.5, 25 mM KCl, 2 mM spermidine and 25 mM MgCl2). Prior to starting the cleavage reaction, the 5′-32P-labeled substrate was heated to 95°C for 1 min in storage buffer (10 mM Tris pH 7.6 and 1 mM EDTA) and snap-cooled to promote hairpin formation. Cleavage reactions were initiated by addition of equal volumes (20 µl) of the 5′-32P-labeled S and R, either the wild-type R (R0) or variants (Figure 1B), after a 5-min pre-incubation of S and R at 30°C in reaction buffer. Typically, about 10 aliquots of 3 µl were removed from the 40-µl reaction mixture at specific times, and the reaction was stopped by addition of 12 µl of stop mix (50 mM EDTA pH 8.0, 0.04% xylene cyanol, 0.04% bromophenol blue and ≥85% formamide) and transfer to 4°C. Samples were analyzed by denaturing gel electrophoresis [20% acrylamide:bisacrylamide (19:1) / 7 M urea gels]. For each time point, the amounts of substrate and product were quantified using a Molecular Imager FX and the Quantity One 1D analysis software version 4.6.2 (Bio-Rad Laboratories, Ont.).
Single-turnover kinetic experiments were typically performed with [S] = 250 pM and excess R (0.005–5 µM). The percentage of remaining substrate [F = St/(St+Pt)*100%; where St and Pt are the amount of substrate and product at time t] was plotted against time. The resulting time courses were fitted to the equation F = Ae−(kobs *t) + F∞, where A is the amplitude, kobs is the rate of the reaction and F∞ is a variable that represents the amount of substrate at the end point of the cleavage reaction. The value of kobs, the standard error for kobs, and F∞ were estimated by non-linear regression analysis within the OriginPro 8.1 software (OriginLab, MA). The F∞ values are <10% for all S/R combinations.
The dependence of kobs on [R] was analyzed by linear regression to derive the second order rate constant of the reaction, kcat/KM. The linear dependence of kobs on [R] was observed from 0.005 to 1 µM for S0/R0 and from 0.005 to 3 µM for both S+1 bp/R0 and S−1 bp/R0. The quality of the fit for the linear dependence of the kobs on [R] was obtained from the square of the correlation coefficient (R2), and in all cases R2 was ≥ 0.99. Single-substrate kinetic experiments were all performed from at least three independent experiments, and reported kcat/KM and their errors are average values and standard deviations, respectively, from these multiple measurements.
Multiple-substrate kinetic studies
Multiple-substrate kinetic studies were carried out as single-turnover reactions under the same conditions as the single-substrate kinetic studies. The main difference is that the cleavage reactions were initiated by addition of equal volumes (20 µl) of R (0.005–5 µM of either R0 or a variant) and a mixture of 5′-32P-labeled nucleic acids containing all substrates (S−2 bp, S−1 bp, S0, S+1 bp, S+2 bp, S+3bp and S+4 bp; 35 pM of each) and, in certain cases, a non-cleavable DNA hairpin control (5′- CGG CGA AGC ATC GTC GGC TTC GCC G -3′; 35 pM). In addition, the percentage of remaining substrate was expressed as F = (St/S0)*(C0/Ct)*100% and plotted against time, where S0 and C0 are respectively the amount of substrate and non-cleavable S−2bp control at time t = 0 and St and Ct represent the corresponding values at time t ≠ 0. Values for the reaction rate kobs, amount of uncleaved substrate F∞ and specificity constant kcat/KM were derived as for the single-substrate kinetic studies. All multiple-substrate kinetic experiments were performed at least three times, and reported kcat/KM and their errors are average values and standard deviations, respectively, from these multiple measurements.
Localization of the substrate cleavage site
The site of cleavage was determined for all S/R combinations where cleavage was observed. For this purpose, the substrates were subjected to cleavage in single-substrate kinetic conditions chosen to yield ~50% cleavage. Cleavage reactions were analyzed by denaturing gel electrophoresis [20% acrylamide:bisacrylamide (19:1) / 7 M urea gels] and by comparison with partial T1 nuclease digest and alkaline hydrolysis of S0.
Native gel studies of RNA substrates
Non-denaturing polyacrylamide gel electrophoresis was carried out on a 7.5% polyacrylamide bisacrylamide (37.5:1) gel in TB buffer (50 mM Tris borate pH 8.0 and 5 mM magnesium acetate). Prior to loading, the RNA substrates were heated at 95°C for 2 min in storage buffer and transferred on ice for 5 min. The gel was pre-run for 30 min at 200 V, run for 2 h at 250 V and 4°C and then stained with Stains All (Sigma-Aldrich, Ont.).
Structural modeling of SLI/SLV complexes
3D models of the SLI/SLV complex were generated using a stepwise procedure (Supplementary Figure S3). As a first step, RNA fragments were modeled using the constraint-satisfaction software MC-Sym 3.3.2 (30). Several models of the I/V kissing-loop junction core (residues 626–634 and 695–701) were first obtained separately using the NMR structure of magnesium-bound SLV (31) and constraints derived from biochemical studies, as previously described (18). A unique structural model was obtained for each type of SLI stems (S−1bp to S+4bp ; residues 619–625 and 635–640 for S0), in accordance with the secondary structure model (Figure 1) and the NMR structure of the active conformation of the cleavage site internal loop (32). A unique structural model was also obtained for each type of SLV stems (R−4bp to R+1bp ; residues 689–694 and 702–707 for R0), in accordance with the secondary structure model (Figure 1). Before being grafted together, the core and stem models were energy minimized using the molecular dynamics software Sander (33) based on the Amber force field and including covalent, electrostatic, Van der Waals energies, as well as implicit solvation in the form of a Generalized Born model (34). Several rounds of minimization (100 000) were first applied including restraints to maintain Watson-Crick base pairing and followed by fewer rounds of minimization (1000) without these restraints. The minimized core and stem models were then filtered using a custom C++ program based on the freely accessible C++ library MC-Core (30). The filter-selected models that preserved global structural integrity (heavy-atom rmsd between the pre- and post-minimization model <2.0 Å) and key structural features (covalent integrity of backbone, Watson-Crick base pairs at the I/V kissing-loop junction, and hydrogen bonds typical of U-turn structure in SLI between U628 2′-O and G630 N7 and between U628 N3 and U631). Each remaining core model was then assembled using MC-Sym with all possible combinations of stem I (S−1bp to S+4 bp) and stem V (R−4bp to R+1 bp), energy minimized and filtered to create 36 sub-models that form a common-core group.
For all sub-models, helical axes were computed using Curves+ for stem Ib and V (35). The interhelical angle (θI−V) and axial displacement (dI−V) between these two axes were computed by vector methods within Pymol using Python scripts. For calculation of dI−V, a reference point O was first set midway between atoms corresponding to A698 N3 and U631 N1 of the kissing-loop interaction. Two segments OA and OB were calculated that start at this reference point to reach the two helical axes at point A and B in a perpendicular orientation. The distance of the AB segment was taken to represent the axial displacement. The reported values of θI−V and dI−V are average values of all sub-models from a common-core group.
Selection of SLI/SLV models compatible with kinetic data
In order to select common-core groups that are compatible with the kinetic data, the sub-models of each common-core group were first compared to their reference S0/R0 sub-model using an rmsd criteria. The sub-models were first superposed to the S0/R0 sub-model based on alignment of the first base pair of SLV (residues 689 and 707 in S0/R0). Heavy atoms pairwise rmsds between the SLI cleavage site region of the S0/R0 sub-model (residues 619–623 and 637–640) and that of each sub-models were then computed. For each common-core group, the rmsd distributions for the high-activity [(kcat/KM)/(kcat/KM) ≥ 0.25)] and low-activity [(kcat/KM)/(kcat/KM) ≤ 0.01)] classes of S/R pairs were compared using a Welch's t-test (36). The normality assumption was verified using the Shapiro-Wilks test (37) on each distribution, and no significant violation was found (α = 0.05). Common-core groups compatible with kinetic data were selected when statistically significant differences (at α = 0.02) were observed between the mean rmsd values of high-activity and low-activity classes of S/R pairs.
RESULTS
For helix-length compensation studies, we performed kinetic studies of trans cleavage with the Avapl VS ribozyme and an SLI substrate, herein termed R0 and S0, respectively (Figure 1A). The S0 substrate adopts a pre-shifted active state (Figure 1A) that is rapidly cleaved by the VS ribozyme (18). Helix-length mutations were introduced within stem Ib of S0 (Figure 1B) that remove up to 2 bp (S−1bp and S−2 bp) or add up to 4 bp (S+1 bp, S+2 bp, S+3bp and S+4 bp). Helix-length mutations were also introduced within stem V of R0 (Figure 1B) that add up to 2 bp (R+1bp and R+2 bp) or remove up to 4 bp (R−1 bp, R−2 bp, R−3bp and R−4 bp). Compensatory substrate/ribozyme (S/R) variant pairs are those for which the total number of base pairs in stems Ib and V is identical to the S0/R0 reference pair (Figure 1B). We hypothesize that, in the simplest scenario, compensatory S/R variant pairs would retain cleavage activity, whereas other S/R variant pairs would not.
Single-substrate kinetic studies
We first examined the specificity of R0 for each substrate individually by determining the second-order rate constant (kcat/KM) under single-turnover conditions (18), as illustrated for S0 in Figure 2. Cleavage reactions were performed with 32P-labeled S0 and excess R0 and monitored by denaturing gel electrophoresis (Figure 2A). The percentage of remaining substrate was plotted against time to derive the value of the first-order rate constant kobs (Figure 2B). For S−1 bp, S0 and S+1bp a linear relationship is observed when kobs is plotted as a function of R0 concentration, and the values of catalytic efficiency (kcat/KM) were obtained from the slope of this graph (Figure 2C and Table 1). For all other substrates (S−2 bp, S+2 bp, S+3bp and S+4 bp), the value of kobs is below the detection limit (≤ 0.001 min−1) at R0 concentrations up to 5 µM, and therefore the value of kcat/KM cannot be determined (Table 1). To insure that the lack of reactivity of certain substrates is not due to major folding defects, they were analyzed by native gel electrophoresis (Supplementary Figure S1). All substrates, with exception of S−2 bp, migrate as a single band on the gel, at a position typical of small RNA hairpins, in agreement with the predicted secondary structure (38). Most of the S−2bp substrate migrates slower, indicating that it adopts a duplex conformation that is incompatible with cleavage by R0.
Figure 2.

Single-substrate kinetic analysis of R0. (A) Cleavage of 5′-32P-labeled S0 by R0 (at 37.5 nM) monitored by denaturing gel electrophoresis. (B) The percentage of remaining substrate was plotted against time. The data were fitted to the non-linear equation F = Ae−(kobs *t) + F∞, to extract the value of kobs (kobs = 0.332 ± 0.008 min−1; R2 = 1.00). (C) Cleavage reactions were performed at various concentrations of R0, and the value of kobs was plotted against ribozyme concentration. For all kobs values, error bars are smaller than the data point on the graph. The data were fitted to a single exponential equation, and the kcat/KM is extracted by linear regression (kcat/KM = value of the slope = 11.2 min−1µM−1 and R2 = 0.99).
Table 1.
Summary of kinetic data for R0a
| Values of kcat/KM (min−1μM−1) |
||
|---|---|---|
| Single-substrate kinetics | Multiple-substrate kinetics | |
| S−2bp | n.d.a | n.d. |
| S−1bp | 5.2 ± 0.8 | 5.9 ± 0.7 |
| S0 | 11 ± 1 | 11 ± 2 |
| S+1bp | 2.7 ± 0.3 | 2.7 ± 0.4 |
| S+2bp | n.d. | n.d. |
| S+3bp | n.d. | n.d. |
| S+4bp | n.d. | n.d. |
aThe kcat/KM and their errors (in min−1μM−1) are average values and standard deviations, respectively, from at least three independent experiments. For several S/R pairs cleavage activity was not detected (n.d.; kobs ≤ 0.001 min−1) at [R] ≤ 5 µM.
For R0, the highest value of kcat/KM is obtained with S0 (11 ± 1 min−1µM−1). Surprisingly, the kcat/KM values for S−1 (5.2 ± 0.8 min−1µM−1) and S+1 (2.7 ± 0.3 min−1µM−1) are reduced by only 2- and 4-fold, respectively, with respect to S0 (Table 1). The similar substrate specificities of R0 for S−1, S0 and S+1 point to the adaptability of the VS ribozyme architecture to cleave a range of substrates with 3–5 bp in stem Ib, indicating a certain level of promiscuity in substrate selection.
Multiple-substrate kinetic studies
Single-substrate kinetic studies performed with R0 are fairly tedious and time-consuming, especially given that several time-courses are needed to derive kcat/KM values for an individual substrate, each kcat/KM are determined at least three times, and multiple substrates are being investigated. To accelerate the kinetic characterization of the remaining S/R variant pairs (Figure 1B), we set up a multiple-substrate kinetic procedure in which one enzyme is simultaneously incubated with a mixture of substrates (29). Single-turnover conditions were chosen for our studies because the enzyme is in excess with respect to all substrates, and there should be no competition between the various substrates. Given the different sizes of substrates investigated (Figure 1B), the disappearance of any given substrate is easily monitored by denaturing gel electrophoresis (Figure 3). The percentage of remaining substrate can be reliably estimated from the ratio of substrate remaining at time t to that at time zero provided that normalization of input RNA in each lane can be achieved. For normalization, we initially added a non-cleavable DNA control in the cleavage reaction, but later found that quantification is more reliable using the non-cleavable S−2bp RNA that gives a better-defined band on the gel (Figure 3).
Figure 3.

Simultaneous kinetic characterization of R−3bp with multiple substrates. The cleavage reactions of 5′-32P-labeled substrates (S) by R−3bp (at 100 nM) were monitored by denaturing gel electrophoresis. A DNA hairpin was used as a normalization control (C).
The multiple-substrate kinetic procedure was first performed with R0, revealing essentially identical kcat/KM values to those obtained with the single-substrate kinetic method (Table 1). These results confirm the reliability of the multiple-substrate procedure and, thus, similar studies were conducted with the variant ribozymes, except for R+2bp because its helix-length complementary substrate S−2bp is not cleavable. Interestingly, substrate cleavage is observed for several S/R pairs, with many having similar kcat/KM values as the S0/R0 pair (Table 2). To verify that substrate cleavage for all functional S/R pairs yields the same product, the reaction products were analyzed by comparing their migration with alkaline and T1 digests on denaturing gels. The results clearly demonstrate that cleavage occurs between G620 and A621 for all substrates cleaved by either R0 or variant ribozymes (Supplementary Figure S2). Thus, the helix-length mutations investigated here have no effect on cleavage site selection.
Table 2.
Summary of multiple-substrate kinetic dataa
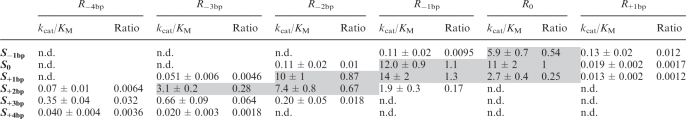 |
aThe kcat/KM and their errors (in min−1μM−1) are average values and standard deviations, respectively, from at least three independent experiments. The ratios correspond to (kcat/KM)/(kcat/KM)0, where (kcat/KM)0 is the value obtained using R0 and S0. Data for high-activity S/R pairs with ratios ≥ 0.25 are highlighted in grey. For several S/R pairs cleavage activity was not detected (n.d.; kobs ≤ 0.001 min−1) at [R] ≤ 5 µM.
As expected, helix-length compensation is observed for all variant ribozymes, since the highest values of kcat/KM are observed with the compensatory substrate or one that differs by a single base pair. More precisely, the most active S/R combinations for each ribozyme are: S−1 bp/R+1 bp, S0/R0, S+1 bp/R−1 bp, S+1 bp/R−2 bp, S+2 bp/R−3bp and S+3 bp/R−4 bp. However, kcat/KM values similar to that of S0/R0 (within 4-fold; shaded in Table 2) are observed only for four of the six ribozymes (R0, R−1 bp, R−2bp and R−3 bp). For the R+1bp and R−4bp ribozymes, the maximal kcat/KM values are reduced significantly, ~80- and ~30-fold, respectively, compared to S0/R0.
Structural modeling of SLI/SLV complexes compatible with kinetic data
Catalysis generally requires the precise positioning of chemically active groups within the active site, which in the VS ribozyme results from the precise docking of the cleavage site and A730 internal loops (10,19–27). Thus, it is likely that the cleavage site loop is presented in a favorable position for productive docking in the most active S/R combinations, but not in the inactive or poorly active S/R combinations. To explore how the relative positioning of the cleavage site loop is affected by helix-length mutations, a structural modeling approach was used. We chose to model an SLI/SLV complex as opposed to models of complete S/R pairs to simplify the modeling procedure and limit the structural consequences of helix-length mutations. Furthermore, the SLI/SLV models allow us to examine the effect of helix-length variations on the positioning of the scissile phosphate in SLI relative to a common base pair in SLV. This approach is consistent with our kinetic studies of S/R pairs in which ribozyme variants retain a common core sequence and interact with the free substrates primarily through the I/V kissing-loop interaction (Bouchard, P., Delfosse, V. and Legault, P., unpublished data). We assumed that realistic 3D models would be compatible with the kinetic data, such that the relative positioning of the cleavage site loop in active S/R combinations would be distinct from that found with inactive S/R combinations.
3D models of the SLI/SLV complexes were generated using a stepwise procedure (Supplementary Figure S3). First, several models of the I/V kissing-loop junction core were obtained using previously described constraints (18). Of these core models, 56 were then selected because each could be used to build a common-core group of 36 sub-models that contain all combinations of SLI (S−1bp to S+4 bp) and SLV stems (R−4bp to R+1 bp) and remain consistent with input structural constraints after energy minimization. For all selected sub-models (56 × 36), the interhelical angle and axial displacement between stems Ib and V were computed and average values were determined for each common-core group. A wide range of axial displacements (dI−V = 12–24 Å), and interhelical angles (θI−V = 108° to 175°; Figure 4) are observed among the common-core groups, pointing to the extensive conformational sampling of the modeling procedure.
Figure 4.

Identification of SLI/SLV models compatible with the kinetic data. Plot of the P-value (Welch's t-test) against the mean interhelical angle. The P-value was obtained from a Welch's t-test that compared the rmsd distributions of the high-activity and low-activity classes of S/R pairs for a given common core group. The mean interhelical angle was obtained by computing the average interhelical angles of the 36 S/R pairs for each common-core group. All common-core groups showing a P-value < 0.02 are numbered. Standard deviations on the interhelical angles vary between 2° and 7°, but were omitted from the graph for clarity.
We hypothesized that for common-core groups compatible with the kinetic data, the sub-models of the high-activity class [(kcat/KM)/(kcat/KM)0 ≥ 0.25); Table 2] should be significantly different than those of the low-activity class [(kcat/KM)/(kcat/KM) 0 ≤ 0.01); Table 2] of S/R pairs. In order to compare the structures of the sub-models, pairwise rmsd's were calculated between the sub-models of each common-core group and their reference S0/R0 sub-model. For each common-core group, the rmsd distributions for the high-activity and low-activity classes of S/R pairs were compared using a Welch's t-test (36). Interestingly, we observe a good correlation between P-values and interhelical angles (Figure 4), where common-core groups with average interhelical angles (θI−V) closer to 180° show smaller P-values and are thus more likely to be consistent with the kinetic data. Group 13 (θI−V = 166.0° ± 3.6) was selected for structural analysis, but similar conclusions are obtained for other common-core groups with P-values smaller than the α threshold value of 0.02 (group 12: θI−V = 165.4° ± 3.5° and group 20: θI−V = 171.4° ± 4.5°).
The 3D structure of the S0/R0 sub-model from the selected group reveals that, although the helical axes of stems Ib and V are more or less colinear, the two stems are not coaxial (Figure 5A). Rather, there is a significant perpendicular displacement (dI−V ~ 20 Å) between these axes that results from the structure of the kissing-loop junction. The spatial relation between these two axes is reflected in the structure of variant S/R pairs, as illustrated in Figure 5B–D. The superposition of all S/R pairs containing R0 shows that the scissile phosphates of the high-activity substrates (deep orange spheres in Figure 5B) cover a ~7.5 Å distance on one side of stem Ib, whereas those of low-activity substrates (white spheres in Figure 5B) rotate around the helical axis towards a different side of the helix. Thus, this superposition indicates that limited helical displacements of the scissile phosphate are compatible with productive docking of the substrate internal loop with the catalytic domain.
Figure 5.

Model of an SLI/SLV complex compatible the kinetic data (common-core group 13). (A) Stick representation of the S0/R0 sub-model. (B) Cartoon representation of a superposition of the five variant S/R0 sub-models on the S0/R0 sub-model. The black arrow points at the scissile phosphate of S0/R0. The scissile phosphates of the following substrates are shown from bottom to top: S−1, S0, S+1, S+2, S+3, S+4. (C) Top-down and (D) front views of the superposition of the most catalytically efficient sub-models of each ribozyme. The following S/R pairs are shown from left to right: S−1/R+1, S0/R0, S+1/R−1, S+1/R−2, S+2/R−1, S+3/R−4. In (B), (C) and (D), the sub-models were superposed to the S0/R0 sub-model based on heavy atom alignment of the first base pair of SLV (residues 689 and 707 in S0/R0). SLI and SLV are represented in deep blue and orange, respectively. Helical axes are represented as red rods and the phosphorus atom at the cleavage site is shown as a sphere. The phosphorus atoms are color-coded according to the catalytic efficiency of the sub-models {[(kcat/KM)/(kcat/KM) ≥ 0.25]: deep orange; [0.25 > (kcat/KM)/(kcat/KM) > 0.01]: light orange and [(kcat/KM)/(kcat/KM) ≤ 0.01]: white}.
To better understand the helix-length compensation observed between selected S/R pairs, we superposed the S/R pairs that produce maximal cleavage activity for each ribozyme (Figure 5C and D). It is clear from both the top-down (Figure 5C) and front views (Figure 5D) of this superposition that the scissile phosphates are distributed along the arc of a circle. Those of the high-activity S/R pairs (deep orange in Figure 5C and D) span a chord length of ~22 Å. This superposition suggests that large, but restricted displacements of the scissile phosphate along this arc are compatible with productive docking of the substrate internal loop with the catalytic domain.
DISCUSSION
In this study, we explored an unusual type of compensatory mutations in RNA, termed helix-length compensations, using the VS ribozyme as a model system. VS substrate and ribozyme variants were prepared in which the number of base pairs in stems Ib and V were either reduced or increased compared to the reference S0/R0 pair. Several S/R combinations were found to be nearly as active as the reference pair, with precise and efficient cleavage obtained for substrate derivatives that contain 3–6 bp in stem Ib. Thus, this work expands the substrate specificity of the VS ribozyme architecture, while revealing its adaptability for efficient substrate cleavage. Two interesting aspects of this adaptability are limited substrate promiscuity with respect to stem Ib length and helix-length compensation between stems Ib and V.
Substrate promiscuity in the VS ribozyme
Substrate cleavage by R0 occurs most efficiently with a stem Ib containing 3–5 potential base pairs, whereas the catalytic efficiency for substrates with 6–8 bp in stem Ib is reduced at least 50 000-fold compared to S0. Thus, there is limited substrate promiscuity with respect to stem Ib length for cleavage by R0, and comparable results are obtained with R−1 and R−2. A similar phenomenon has previously been observed for the 5′-splicing reaction of the group I intron ribozyme, where the cleavage site coincides with a G–U wobble pair in the first stem-loop (P1) of the intron (39). Cleavage at the correct site was observed when the G–U wobble pair was inserted within a 3-bp window of the P1 stem (39). Although the cleavage mechanisms of the group I intron and VS ribozymes differ significantly, both require productive docking of a hairpin substrate with the catalytic domain. Thus, for both ribozymes, helical displacement of the scissile phosphate within a window equivalent to 3 bp is compatible with productive docking and cleavage at the correct site.
Helix-length compensation between stems Ib and V
We initially hypothesized that the reduced cleavage activity of defective stem Ib variants by R0 could be restored by adjusting the number of base pairs within stem V, such that the total number of base pairs within the two stems would be preserved. Examination of the kinetic data indicates that there is, as predicted, helix-length compensation between stems Ib and V. Indeed, substrates for which cleavage is not detected with R0 (S+2 bp, S+3 bp, S+4 bp) are cleaved by a ribozyme variant. However, the cleavage activities of the compensatory S/R pairs are not all restored to the reference level. In agreement with these results, 3D modeling of the I/V kissing-loop complex indicates that the global orientation of stems Ib and V significantly affects the position of the scissile phosphate in the variant S/R pairs.
An unexpected aspect of this helix-length compensation study is that it helps provide global structural information on the I/V kissing-loop interaction. From an ensemble of SLI/SLV models that display a wide range of interhelical angles (108° ≤ θI−V ≤ 175°) and axial displacements (dI−V = 12–24 Å), three models were selected that best fit the kinetic data. These selected models display a much smaller range of interhelical angles and axial displacements (θI−V = 165°–171° and dI−V = 18–21 Å), with near colinearity of their helical axes. By comparison, our previously reported model of the SLI/SLV complex (18) exhibits interhelical parameters (θI−V = 106° and dI−V = 16 Å) that are somewhat compatible with the ensemble of models, but not with our selected models. In contrast, the approximate colinearity of stems Ib and V is consistent with a 3D model of the VS ribozyme derived from biochemical and mutational data (14,28), however sufficient constraints were not available to precisely define the interhelical angle between these two stems nor to rule out alternative models (Collins, R.A., personal communication). Similarly, the global model of the VS ribozyme based on fluorescence resonance energy transfer data does not incorporate sufficient constraints, particularly for the SLI/SLV interaction, to allow a fair comparison with our selected models (15,16). Interestingly, the model of the complete VS ribozyme derived from small-angle X-ray scattering (SAXS) shows an interhelical angle close to that of our selected models [θI−V = 154° and dI−V = 25 Å; (17)]. This similarity between our selected models and the SAXS model is particularly surprising given that the folding of the complete ribozyme was not accounted for in our modeling studies. In addition, the SAXS model includes helix VII that is not present in the VS ribozyme used for our kinetic study. The small difference in axial displacement between our selected models and the SAXS model likely reflects structural differences at the kissing-loop junction. Nevertheless, this comparison with the SAXS model suggests that the combination of kinetic data from helix-length variants with 3D modeling represents a potentially powerful approach to extract interhelical parameters.
Adaptability of the VS ribozyme architecture for substrate cleavage
Given the intrinsic adaptability of the VS ribozymes architecture for substrate cleavage, the modeling results give an appreciation of the level of structural adaptation that is likely at stake for productive docking of the SLI cleavage site internal loop with the A730 loop of SLVI. However, these models do not explain how high-activity S/R pairs move relative to the wild-type S/R pair to allow formation of the active site and efficient cleavage.
An emerging view in RNA structure formation is that tertiary interactions form as a result of conformational sampling of helical domains within a distribution of conformations that is limited, in part, by the inherent flexibility of helical connectivities [for recent reviews see (40,41)]. It is likely that in the VS ribozyme, flexible elements such as its bulges, internal loops, three-way junctions and even its I/V kissing-loop junction (42,43) allow conformational sampling of helical domains, including SLI and SLVI, through which a well-defined active site can emerge. According to this view, the ability to sample the active conformation may be conserved in high-activity S/R pairs but not in those with lower activity. Future investigations are needed to help identify the dynamic features responsible for the conformational adaptability of the VS ribozyme and determine if a similar adaptability exists in other functional RNAs.
Prospects for RNA research
Helix-length compensation represents an alternative approach for investigating the sequence and structural repertoire of functional RNAs that could be applied to other helix pairs. In principle, helix-length compensation could be observed for helices that are more or less coaxially stacked (1–6) or those that are not coaxial but nearly colinear as observed for the VS ribozyme. Although helix-length compensations have been previously identified by comparative sequence analysis (1–6), such analysis may not identify all possible helix-length mutants. Indeed, the genetic mechanism through which such complex mutation pattern evolves likely requires multiple mutational events with an overall lower probability than simple covariation of base-pairing residues. Moreover, sequence searches may not always take into account the possibility for helix-length compensation. Systematic helix-length compensation studies could help improve the consensus sequence and structural model for a given functional RNA. Subsequently, revised RNA consensus sequence could be used for bioinformatics database search of additional representatives of known functional RNAs (44–47). Helix-length compensation studies could also help reveal the inherent adaptability of other complex RNA architectures and be useful for the design of RNAs with novel functions.
SUPPLEMENTARY DATA
Supplementary Data are available at NAR Online: Supplementary Figures S1–S3.
FUNDING
The Canadian Institutes of Health Research (CIHR MOP-86502 to P.L.); CIHR and the Université de Montréal Ph.D. scholarships (to J.L.-L.); Canada Research Chair in Structural Biology and Engineering of RNA (to P.L.). Funding for open access charge: Canadian Institutes of Health Research.
Conflict of interest statement. None declared.
Supplementary Material
ACKNOWLEDGMENTS
The authors thank D.M.J. Lilley for providing the atomic coordinates for the SAXS model of the complete VS ribozyme, J. G. Omichinski for critical reading of the manuscript and R. Richter for computer support.
REFERENCES
- 1.Woese CR, Gutell R, Gupta R, Noller HF. Detailed analysis of the higher-order structure of 16S-like ribosomal ribonucleic acids. Microbiol. Rev. 1983;47:621–669. doi: 10.1128/mr.47.4.621-669.1983. [DOI] [PMC free article] [PubMed] [Google Scholar]
- 2.Gutell RR. In: Ribosomal RNA: Structure, Evolution, Processing, and Function in Protein Biosynthesis. Zimmermann RA, Dahlberg AE, editors. Boca Raton, Florida: CRC Press; 1995. pp. 109–126. [Google Scholar]
- 3.Ban N, Nissen P, Hansen J, Moore PB, Steitz TA. The complete structure of the large ribosomal subunit at 2.4 Å resolution. Science. 2000;289:905–920. doi: 10.1126/science.289.5481.905. [DOI] [PubMed] [Google Scholar]
- 4.Michel F, Westhof E. Modelling of the three-dimensional architecture of group I catalytic introns based on comparative sequence analysis. J. Mol. Biol. 1990;216:585–610. doi: 10.1016/0022-2836(90)90386-Z. [DOI] [PubMed] [Google Scholar]
- 5.Adams PL, Stahley MR, Kosek AB, Wang J, Strobel SA. Crystal structure of a self-splicing group I intron with both exons. Nature. 2004;430:45–50. doi: 10.1038/nature02642. [DOI] [PubMed] [Google Scholar]
- 6.Golden BL, Kim H, Chase E. Crystal structure of a phage Twort group I ribozyme-product complex. Nat. Struct. Mol. Biol. 2004;12:82–88. doi: 10.1038/nsmb868. [DOI] [PubMed] [Google Scholar]
- 7.Steinberg S, Leclerc F, Cedergren R. Structural rules and conformational compensations in the tRNA L-form. J. Mol. Biol. 1997;266:269–282. doi: 10.1006/jmbi.1996.0803. [DOI] [PubMed] [Google Scholar]
- 8.Collins RA. The Neurospora Varkud satellite ribozyme. Bioch. Soc. Trans. Rev. 2002;30:1122–1126. doi: 10.1042/bst0301122. [DOI] [PubMed] [Google Scholar]
- 9.Lilley DM. The Varkud satellite ribozyme. RNA. 2004;10:151–158. doi: 10.1261/rna.5217104. [DOI] [PMC free article] [PubMed] [Google Scholar]
- 10.Wilson TJ, Lilley DM. Do the hairpin and VS ribozymes share a common catalytic mechanism based on general acid-base catalysis? A critical assessment of available experimental data. RNA. 2011;17:213–221. doi: 10.1261/rna.2473711. [DOI] [PMC free article] [PubMed] [Google Scholar]
- 11.Rastogi T, Beattie TL, Olive JE, Collins RA. A long-range pseudoknot is required for activity of the Neurospora VS ribozyme. EMBO J. 1996;15:2820–2825. [PMC free article] [PubMed] [Google Scholar]
- 12.Andersen A, Collins RA. Rearrangement of a stable RNA secondary structure during VS ribozyme catalysis. Mol. Cell. 2000;5:469–478. doi: 10.1016/s1097-2765(00)80441-4. [DOI] [PubMed] [Google Scholar]
- 13.Andersen AA, Collins RA. Intramolecular secondary structure rearrangement by the kissing interaction of the Neurospora VS ribozyme. Proc. Natl Acad. Sci. USA. 2001;98:7730–7735. doi: 10.1073/pnas.141039198. [DOI] [PMC free article] [PubMed] [Google Scholar]
- 14.Hiley SL, Collins RA. Rapid formation of a solvent-inaccessible core in the Neurospora Varkud satellite ribozyme. EMBO J. 2001;20:5461–5469. doi: 10.1093/emboj/20.19.5461. [DOI] [PMC free article] [PubMed] [Google Scholar]
- 15.Lafontaine DA, Norman DG, Lilley DM. Structure, folding and activity of the VS ribozyme: importance of the 2-3-6 helical junction. EMBO J. 2001;20:1415–1424. doi: 10.1093/emboj/20.6.1415. [DOI] [PMC free article] [PubMed] [Google Scholar]
- 16.Lafontaine DA, Norman DG, Lilley DM. The global structure of the VS ribozyme. EMBO J. 2002;21:2461–2471. doi: 10.1093/emboj/21.10.2461. [DOI] [PMC free article] [PubMed] [Google Scholar]
- 17.Lipfert J, Ouellet J, Norman DG, Doniach S, Lilley DM. The complete VS ribozyme in solution studied by small-angle X-ray scattering. Structure. 2008;16:1357–1367. doi: 10.1016/j.str.2008.07.007. [DOI] [PMC free article] [PubMed] [Google Scholar]
- 18.Bouchard P, Lacroix-Labonté J, Desjardins G, Lampron P, Lisi V, Lemieux S, Major F, Legault P. Role of SLV in SLI substrate recognition by the Neurospora VS ribozyme. RNA. 2008;14:736–748. doi: 10.1261/rna.824308. [DOI] [PMC free article] [PubMed] [Google Scholar]
- 19.Lafontaine DA, Wilson TJ, Norman DG, Lilley DM. The A730 loop is an important component of the active site of the VS ribozyme. J. Mol. Biol. 2001;312:663–674. doi: 10.1006/jmbi.2001.4996. [DOI] [PubMed] [Google Scholar]
- 20.Lafontaine DA, Wilson TJ, Zhao Z-Y, Lilley DMJ. Functional group requirements in the probable active site of the VS ribozyme. J. Mol. Biol. 2002;323:23–34. doi: 10.1016/s0022-2836(02)00910-5. [DOI] [PubMed] [Google Scholar]
- 21.Sood VD, Collins RA. Identification of the catalytic subdomain of the VS ribozyme and evidence for remarkable sequence tolerance in the active site loop. J. Mol. Biol. 2002;320:443–454. doi: 10.1016/s0022-2836(02)00521-1. [DOI] [PubMed] [Google Scholar]
- 22.Jones FD, Strobel SA. Ionization of a critical adenosine residue in the Neurospora Varkud satellite ribozyme active site. Biochemistry. 2003;42:4265–4276. doi: 10.1021/bi020707t. [DOI] [PubMed] [Google Scholar]
- 23.Zhao ZY, McLeod A, Harusawa S, Araki L, Yamaguchi M, Kurihara T, Lilley DM. Nucleobase participation in ribozyme catalysis. J. Am. Chem. Soc. 2005;127:5026–5027. doi: 10.1021/ja0502775. [DOI] [PubMed] [Google Scholar]
- 24.Wilson TJ, McLeod AC, Lilley DM. A guanine nucleobase important for catalysis by the VS ribozyme. EMBO J. 2007;26:2489–2500. doi: 10.1038/sj.emboj.7601698. [DOI] [PMC free article] [PubMed] [Google Scholar]
- 25.Smith MD, Collins RA. Evidence for proton transfer in the rate-limiting step of a fast-cleaving Varkud satellite ribozyme. Proc. Natl Acad. Sci. USA. 2007;104:5818–5823. doi: 10.1073/pnas.0608864104. [DOI] [PMC free article] [PubMed] [Google Scholar]
- 26.Jaikaran D, Smith MD, Mehdizadeh R, Olive J, Collins RA. An important role of G638 in the cis-cleavage reaction of the Neurospora VS ribozyme revealed by a novel nucleotide analog incorporation method. RNA. 2008;14:938–949. doi: 10.1261/rna.936508. [DOI] [PMC free article] [PubMed] [Google Scholar]
- 27.Wilson TJ, Li NS, Lu J, Frederiksen JK, Piccirilli JA, Lilley DM. Nucleobase-mediated general acid-base catalysis in the Varkud satellite ribozyme. Proc. Natl Acad. Sci. USA. 2010;107:11751–11756. doi: 10.1073/pnas.1004255107. [DOI] [PMC free article] [PubMed] [Google Scholar]
- 28.Rastogi T, Collins RA. Smaller, faster ribozymes reveal the catalytic core of Neurospora VS RNA. J. Mol. Biol. 1998;277:215–224. doi: 10.1006/jmbi.1997.1623. [DOI] [PubMed] [Google Scholar]
- 29.Guo HCT, Collins RA. Efficient trans-cleavage of a stem-loop RNA substrate by a ribozyme derived from Neurospora VS RNA. EMBO J. 1995;14:368–376. doi: 10.1002/j.1460-2075.1995.tb07011.x. [DOI] [PMC free article] [PubMed] [Google Scholar]
- 30.Major F, Turcotte M, Gautheret D, Lapalme G, Fillion E, Cedergren R. The combination of symbolic and numerical computation for three-dimensional modeling of RNA. Science. 1991;253:1255–1260. doi: 10.1126/science.1716375. [DOI] [PubMed] [Google Scholar]
- 31.Campbell DO, Bouchard P, Desjardins G, Legault P. NMR structure of Varkud satellite ribozyme stem-loop V in the presence of magnesium ions and localization of metal-binding sites. Biochemistry. 2006;45:10591–10605. doi: 10.1021/bi0607150. [DOI] [PubMed] [Google Scholar]
- 32.Hoffmann B, Mitchell GT, Gendron P, Major F, Andersen AA, Collins RA, Legault P. NMR structure of the active conformation of the Varkud satellite ribozyme cleavage site. Proc. Natl Acad. Sci. USA. 2003;100:7003–7008. doi: 10.1073/pnas.0832440100. [DOI] [PMC free article] [PubMed] [Google Scholar]
- 33.Pearlman DA, Case DA, Caldwell JW, Ross WS, Cheatham TE, Debolt S, Ferguson D, Seibel G, Kollman P. Amber, a package of computer-programs for applying molecular mechanics, normal-mode analysis, molecular-dynamics and free-energy calculations to simulate the structural and energetic properties of molecules. Comput. Phys. Commun. 1995;91:1–41. [Google Scholar]
- 34.Still WC, Tempczyk A, Hawley RC, Hendrickson T. Semianalytical treatment of solvation for molecular mechanics and dynamics. J. Am. Chem. Soc. 1990;112:6127–6129. [Google Scholar]
- 35.Lavery R, Moakher M, Maddocks JH, Petkeviciute D, Zakrzewska K. Conformational analysis of nucleic acids revisited: Curves+ Nucleic Acids Res. 2009;37:5917–5929. doi: 10.1093/nar/gkp608. [DOI] [PMC free article] [PubMed] [Google Scholar]
- 36.Satterthwaite FE. An approximate distribution of estimates of variance components. Biometrics. 1946;2:110–114. [PubMed] [Google Scholar]
- 37.Shapiro SS, Wilk MB. An analysis of variance test for normality (complete samples) Biometrika. 1965;52:591–611. [Google Scholar]
- 38.Beattie TL, Olive JE, Collins RA. A secondary-structure model for the self-cleaving region of Neurospora VS RNA. Proc. Natl Acad. Sci. USA. 1995;92:4686–4690. doi: 10.1073/pnas.92.10.4686. [DOI] [PMC free article] [PubMed] [Google Scholar]
- 39.Doudna JA, Cormack BP, Szostak JW. RNA structure, not sequence, determines the 5′ splice-site specificity of a group I intron. Proc. Natl Acad. Sci. USA. 1989;86:7402–7406. doi: 10.1073/pnas.86.19.7402. [DOI] [PMC free article] [PubMed] [Google Scholar]
- 40.Woodson SA. Compact intermediates in RNA folding. Annu. Rev. Biophys. 2010;39:61–77. doi: 10.1146/annurev.biophys.093008.131334. [DOI] [PMC free article] [PubMed] [Google Scholar]
- 41.Bailor MH, Mustoe AM, Brooks CL, 3rd, Al-Hashimi HM. Topological constraints: using RNA secondary structure to model 3D conformation, folding pathways, and dynamic adaptation. Curr. Opin. Struct. Biol. 2011;21:296–305. doi: 10.1016/j.sbi.2011.03.009. [DOI] [PMC free article] [PubMed] [Google Scholar]
- 42.Szewczak AA, Cech TR. An RNA internal loop acts as a hinge to facilitate ribozyme folding and catalysis. RNA. 1997;3:838–849. [PMC free article] [PubMed] [Google Scholar]
- 43.Bailor MH, Sun X, Al-Hashimi HM. Topology links RNA secondary structure with global conformation, dynamics, and adaptation. Science. 2010;327:202–206. doi: 10.1126/science.1181085. [DOI] [PubMed] [Google Scholar]
- 44.Ferbeyre G, Smith JM, Cedergren R. Schistosome satellite DNA encodes active hammerhead ribozymes. Mol. Cell. Biol. 1998;18:3880–3888. doi: 10.1128/mcb.18.7.3880. [DOI] [PMC free article] [PubMed] [Google Scholar]
- 45.Gräf S, Przybilski R, Steger G, Hamman C. A database search for hammerhead ribozyme motifs. Biochem. Soc. Trans. 2005;33:477–478. doi: 10.1042/BST0330477. [DOI] [PubMed] [Google Scholar]
- 46.Hammann C, Westhof E. Searching genomes for ribozymes and riboswitches. Genome Biol. 2007;8:210. doi: 10.1186/gb-2007-8-4-210. [DOI] [PMC free article] [PubMed] [Google Scholar]
- 47.McCown PJ, Roth A, Breaker RR. An expanded collection and refined consensus model of glmS ribozymes. RNA. 2011;17:728–736. doi: 10.1261/rna.2590811. [DOI] [PMC free article] [PubMed] [Google Scholar]
Associated Data
This section collects any data citations, data availability statements, or supplementary materials included in this article.