


Abstract
Advances in high-throughput characterization of protein networks in vivo have resulted in large databases of unexplored protein interactions that occur during normal cell function. Their further characterization requires quantitative experimental strategies that are easy to implement in laboratories without specialized equipment. We have overcome many of the previous limitations to thermodynamic quantification of protein interactions, by developing a series of in-solution fluorescence-based strategies. These methods have high sensitivity, a broad dynamic range, and can be performed in a high-throughput manner. In three case studies we demonstrate how fluorescence (de)quenching and fluorescence resonance energy transfer can be used to quantitatively probe various high-affinity protein–DNA and protein–protein interactions. We applied these methods to describe the preference of linker histone H1 for nucleosomes over DNA, the ionic dependence of the DNA repair enzyme PARP1 in DNA binding, and the interaction between the histone chaperone Nap1 and the histone H2A–H2B heterodimer.
INTRODUCTION
Cells are complex systems that require the stable or transient interaction of thousands of proteins with other proteins, nucleic acids or chromatin. Such signaling networks dictate development, differentiation and proper responses to environmental cues, and are thus essential for survival. Systems biology advocates that cataloguing each existing interaction within the cell (the ‘interactome’) enables computational modeling of responses to specific stimuli (1). Recent developments in qualitatively measuring large numbers of interactions in vivo, as well as advances in computational approaches, have resulted in the description of interaction networks. These shed light on critical clusters of proteins involved in specific cellular responses and disease states (1). However, to systematically test the hierarchies of specific interactions within any given network, the discrete physical parameters governing each interaction must be known.
Many methodologies are available to study the thermodynamic, kinetic and structural parameters of protein–protein and protein–nucleic acid interactions. However, common biochemical techniques, such as affinity pull-down assays, electrophoretic mobility-shift assays, filter binding, etc. are limited. They often fail to discern differences in affinity and specificity since they are routinely conducted at high concentrations or are dependent upon radioisotope labeling; therefore secondary experimental processing is required, potentially leading to data misrepresentation (2,3). Ideally, experiments used to quantify macromolecular interactions should be performed on freely diffusing molecules that are free of conjugated labels; they should be highly sensitive and have a broad dynamic range to capture high, medium and low affinity interactions; they should be adaptable to a high-throughput format; and be easily implemented without the requirement for overly specialized or expensive equipment. Advances in high-power imaging systems have greatly enhanced detection sensitivity, leading to several techniques that combine many of these features. For example, fluorescence anisotropy, fluorescence resonance energy transfer (FRET), surface plasmon resonance (SPR) and photonic crystal (PC) biosensors (4,5) have all been used to quantify intermolecular interactions. Each of these approaches has its own set of advantages and limitations (3,6,7).
Here we describe a set of methodologies, which we term HI-FI (High-throughput Interactions by Fluorescence Intensity), for increasing throughput and sensitivity in probing protein–protein and protein–DNA interactions by fluorescence (de)quenching and FRET in a 384-well microplate format. The use of in-solution analysis allows samples to be subsequently analyzed by native PAGE for an independent readout of complex formation. The use of microplates obviates the requirement for a specialized fluorometer. For quantitative measurements of macromolecular complexes, the HI-FI system contains all the elements listed above, except that that it relies on the common practice of conjugating fluorescent dye(s) to the protein and/or nucleic acid. In three case studies, we demonstrate the versatility of HI-FI assays and present novel data on complex systems that have, until recently, eluded quantitative characterization. First, we determine the affinity of linker histone H1 to nucleosomes and free DNA using fluorescence quenching. Second, we investigate the salt-dependent interaction of poly(ADP-ribose) polymerase 1 (PARP1) with DNA using FRET. Third, we compare the interaction between the histone chaperone Nucleosome assembly protein 1 (Nap1) (full-length and deletion mutants) and histones H2A–H2B using a competition FRET assay. The approaches described here provide a quantitative toolset to replace commonly used qualitative assays for the exploration of protein interactions with other cellular components.
METHODS
Preparation of fluorescently labeled histone H1
Mus musculus H10 serine 20 was mutated to cysteine (H10S20C); counting from the start Met and including the additional Ala at position 2 in our construct. pET 11d containing H10S20C was transformed into Bl21 (DE3)pLysS cells. Following growth (OD 0.6-0.8) and induction (2–3 h), cells were flash frozen and subsequently re-suspended lysis buffer (25 mM Tris pH 8.3, 2.5 mM EDTA, 1 M NaCl, 0.5 mM PMSF, 1 μM pepstatin A and 1 mM DTT). Resuspended cells were sonicated, centrifuged and then diluted slowly with constant stirring to 0.3 M NaCl in buffer containing 25 mM Tris (pH 8.3), 2.5 mM EDTA, 0.5 mM PMSF, 1 μM pepstatin A and 1 mM DTT. Freshly hydrated and de-gassed CM Sephadex resin (Sigma-Aldrich) was added to the lysate and incubated overnight at 4°C while rocking. The sample was centrifuged and the supernatant removed from the sample. The sample with resin was then packed into a column and purified by FPLC with loading Buffer A (10 mM Tris pH8.3, 1 mM EDTA, 0.1 mM PMSF, 300 mM NaCl, and 1 mM DTT) and elution buffer B (10 mM Tris pH8.3, 1 mM EDTA, 0.1 mM PMSF, 2 M NaCl, and 1 mM DTT). The protein was concentrated and then dialyzed into H1 storage buffer (20 mM Tris pH 7.5, 1 mM EDTA, 1 mM DTT, 50 mM NaCl and 0.1 mM PMSF). In a final purification step, the protein was applied to a Superdex 200 column and eluted with H1 storage buffer.
For fluorescent labeling, the purified H10 derivative protein was concentrated and exchanged into TCEP buffer (20 mM Tris pH7.5, 1 mM EDTA, 50 mM NaCl and 0.1 mM PMSF, 1 mM TCEP). H1 S20C was labeled with iodoacetamide Oregon Green 488 (Molecular Probes; OG488) by the addition of 2:1 molar ratio of Oregon Green iodoacetamide:H10 and incubated at 4°C for 3 hours on a rotator. Removal of excess fluorophore was achieved by applying the sample to a G15 sepharose spin-column (Sigma-Aldrich), followed by concentration of the eluate. H10 concentration and labeling efficiency was determined by uv/vis absorption spectroscopy. The extinction coefficient at 280 nm for H1 was 4470 M−1 cm−1, which was corrected for fluorophore absorption by subtracting the absorption of OG488 using the following equations:
| (1) |
| (2) |
where A indicates the absorption at the specified wavelength, and Equation (2) defines how much OG488 absorbs at 280 nm based upon its absorption at 495 nm, assuming the spectra doesn't change significantly upon conjugation. The specificity of labeling was verified by mass spectrometry.
DNA purification and nucleosome reconstitution
The 207 bp 601 DNA sequence was purified as previously described (8) with the following variations: after EcoRV digestion the desired insert was removed from digested plasmid via PEG 6000 precipitation at a final PEG concentration of 6.3%, followed by purification over a DEAE column. For nucleosome reconstitutions, histones were expressed, purified and refolded into histone octamer. Nucleosomes were formed by adding 207 bp DNA and histone octamer at 2 M KCl and slowly dialyzed into 250 mM KCl as previously described (8).
Microplate passivation
The 384-well microplates (SensoPlate Plus, Greiner Bio-One) were cleaned with 1% Hellmanex™ for 20–30 min, rinsed with deionized water, followed by a 20–30 min incubation with 1 M KOH. Plates were rinsed with water and allowed to dry overnight. Plates were then treated with 100 µl of a 2% solution of 1, 7 Dichlorooctamethyl-tetrasiloxane (Sigma) in Heptane (Sigma) for 1–2 min then rinsed with water and allowed to dry overnight. Cleaning agents can be dispensed with a wash bottle and silane solution with a multichannel pipettor; for high-throughput, all procedures can be performed in a standard microplate washer (BioTek).
H1 binding assays
For assays used to determine the binding affinity of H1 to nucleosomes and DNA, labeled H10 was diluted into binding buffer, consisting of 10 mM Tris pH 7.5, 150 mM KCl, 1 mM DTT, 5% Glycerol, 0.01% CHAPS, 0.01% NP-40 (nonidet p40 substitute; Fluka), to a concentration 2-fold greater than the desired final reaction concentration. The final H1 reaction concentration was 0.1 nM and 0.5 nM for nucleosomes and DNA, respectively. Nucleosomes or DNA were serially diluted in binding buffer into multiple master stocks for each order of magnitude (e.g. 0.2 nM, 2 nM, 20 nM, etc.). Each master stock was then used to create an experimental titration series 2-fold greater than the desired final concentration; typically performed in 200 µl PCR tubes (Genemate) or 384-deepwell low binding polypropylene plates (Eppendorf). For each replicate titration series, 20 µl of every 2-fold substrate dilution was then pipetted into a single row of the microplate using a 12-channel pipettor followed by 20 µl of the 2× H1 stock. The microplate was then quick spun at 500–2000 rpm, shaken for 2 min (VortexGenie 2) at speed no higher than 2, allowed to incubate 15–20 min at room temperature, and then imaged on a Typhoon Trio multimode imager (GE Healthcare). Images were collected with a 488 nm excitation laser and a 520 bp40 emission filter at 600 V PMT and scanned at +3 mm with press ‘on’ at 100 µm. Images were analyzed with the Array Analysis function of ImageQuant TL software by making an array with squares slightly smaller than the dimensions of each well. The data from each well were plotted in GraphPad Prism software and fit to a single exponential binding curve with a Hill coefficient using the following equation, based upon Reaction Scheme 1, where P is protein and L is the ligand:
REACTION SCHEME 1
| (3) |
where Ymin is signal of H1 in the absence of substrate, Ymax is the signal at saturation, Lt is the total concentration of ligand titrated and n is the Hill coefficient.
Stoichiometric measurements were performed as described above, but with H10 at 10 nM or 20 nM for nucleosome and DNA, respectively. Stoichiometry data were plotted in prism and each linear phase fit with a line. The intersection between the lines indicates the stoichiometric equivalency point.
Native PAGE
Samples were loaded onto a running 5% gel using 22 × 20 cm borosilicate plates and a 1.5 mM spacer (CBS scientific), which was pre-run for 30 min. Samples were run at 300 V at 4°C for 1-2 hrs. The sandwiched gel was then placed on Typhoon Trio imager with water making a layer between the gel's glass plates and the scanner glass platen, and scanned with the settings described for plate imaging, except at 200 µm resolution. Gels were then removed and stained with ethidium bromide and imaged with UV light on a Gel Doc XR (Bio-Rad). Quantification of bands within the gel was performed in ImageQuant TL software.
FRET methodology
Ideally, FRET measurements are performed by using three different titration series; (i) donor labeled probe + unlabeled substrate (donor only); (ii) unlabeled probe + acceptor-labeled substrate (acceptor only); (iii) donor-labeled probe + acceptor-labeled substrate (FRET pair) (9,10). Practically, however, unlabeled binding partners are not required, because the overlap controls measure the properties of the fluorophores and the instrument, not the protein system. Each of these three sample sets are then imaged to obtain raw values for Donor (D), Acceptor (A) and FRET (F) signals.
Donor (D; 488 ex., 520 em.)
Acceptor (A; 633 ex., 670 em.)
FRET (F; 488 ex., 670 em.)
To extract accurate binding affinities, the raw FRET value must be corrected for spectral overlap to obtain a corrected FRET value (Fcorr) when illuminated with the donor excitation; spectral overlap consists of (i) donor bleed-through into acceptor emission (χD) and (ii) acceptor direct excitation (χA).
χD is obtained from the ratio between F and D with donor only sample (i):
 |
(4) |
χA is obtained from the ratio between F and A with acceptor only sample (ii):
 |
(5) |
χD and χA can then be used to subtract the overlap values from the FRET pair sample (iii) to obtain the value (Fcorr) using the following equation:
| (6) |
We perform a complete titration series of the acceptor only (Equation 5) for direct excitation and use the calculated ratio for that specific concentration and use this ratio for the same concentration in the FRET (Equation 6) sample. It is preferable to obtain Fcorr from the ratio χA at each titration point rather than directly subtracting the raw F-value from the acceptor only (Equation 5) as previously described (11). This is because direct subtraction propagates both pipetting error between acceptor only labeled and FRET pair labeled titraions, whereas using a ratio at each point is dependent only upon instrumentation error; which is significantly less than pipetting error (i.e. if subtraction were used, one would have to assume that the concentration of the acceptor only sample (Equation 5) is identical to that of the FRET pair sample (Equation 6); which is likely not the case). We find that performing a titration series across the full range of acceptor concentrations is necessary for determining χA because the observed value of χA changes slightly between initial and final acceptor concentrations; ultimately creating large differences in Fcorr values at saturation if a single χA value is used for all points. The contribution to spectral overlap is highlighted in Supplementary Figure S5. Alternatively, to obtain correction values, a few points of the titration could be used and fit to a line, with χA determined from the slope of the line at each titration point. For further evidence that spectral overlap has been removed, we performed image calculator function in ImageJ (NIH) using the spectral overlap values (χD and χA). Figure 1A and B show that the FRET signal plateaus upon acceptor titration, whereas the raw-uncorrected FRET signal continues to rise in a linear fashion. Further, Supplementary Figure S5 shows the spectral overlap contributions to the FRET signal. Using this methodology, we typically can titrate the acceptor molecule 100- to 1000-fold above the donor concentration, which defined by the point at which the error of overlap signal exceeds the Fcorr signal. This point is regulated by factors such as instrumentation noise, pipetting error, labeling efficiency, and the amount of energy transfer (i.e. the distance between the dyes when bound).
Figure 1.

Calculating spectrally-corrected FRET values (Fcorr) is essential to determining accurate binding affinities. (A) A plot showing the fluorescent intensities (F.I.) of the raw (black filled circles with solid lines) and overlap corrected (Fcorr; on left black filled sqaure with dashed line and right red filled sqaure with dashed line y-axis) FRET values; graphics correspond with the same colored axis. Data were obtained from binding nPARP1 to DNA at 250 mM NaCl. (B) The same data as in (A), but x-axis plotted on a log-scale. (C) A plot showing what happens when efficiency transfer (E) is used to calculate binding isotherms. Various theoretical curves were generated by changing γ and/or E-values; the curves are based on a KD of 10 nM for a γ = 1.
Quenching or anisotropy changes of the donor and acceptor are not accounted for in this assay, because we assume that any signal in Fcorr arises only from energy transfer. Assuming a two-state system, we are simply measuring the final state of the fluorophores once they are bound and do not worry what state they are initially in. Due to potential changes in fluorophore properties upon binding and differences in detection efficiency between D and F channels, it is also not ideal to plot either the donor signal or efficiency transfer (E); disproportionate changes in D and F will change the denominator of the FRET calculation [E = F/(D + F)] at each point, thus changing the observed KD (Supplementary Methods S3; Figure 1C). However, with the proper set of controls and mathematical corrections, E can be correctly calculated (12). Further, maximizing the labeling efficiency for both donor and acceptor molecules significantly reduces noise and increases the dynamic range of the HI-FI assay. If spectral overlap is corrected for, a donor titration with constant acceptor can be used as an alternative experiment or control (as explained in Supplementary Methods and Supplementary Figure S4).
Preparation of fluorescently labeled nPARP1
nPARP1 (residues 1–486) containing the three zinc finger domains and BRCT domain was expressed and purified as previously described (13). nPARP1 was fluorescently labeled with alexa-488 in a buffer containing 300 mM NaCl, 25 mM Tris pH 7.5 and 1 mM TCEP. Alexa-488 maleimide was added in equal molar equivalents of dye:nPARP1 three times over three hours. Reactions were then mixed overnight at 4°C. Remaining un-conjugated dye was removed by running the sample on a Hitrap-heparin HP cation-exchange column (GE Healthcare). nPARP1 has an extinction coefficient of 58480 M−1 cm−1 at 280 nm, and 0.12 was used for the A280/A495 correction factor for Alexa-488 dye; concentrations were determined as described above (Equation 1). Specific labeling of nParp1 was verified by mass spectrometry.
PARP1 binding assays
Fluorescently labeled DNA oligonucleotides containing a single 5′ Cy5 were diluted as described in the H1 section and added to a microplate. The sequence of the oligonucleotides used is as follows (the asterisk indicates the labeling site):
5′-*ATCAGATAGCATCTGTGCGGCCGCTTAGGG-3′
nPARP1Donor was diluted to 10-fold below the KD and added to each well of the DNA titration and incubated for 20 min. Titrations were performed as described for H1. All titrations contain two wells with no DNA present as a donor only control. Additionally, a titration with acceptor only sample was added as a control for spectral overlap, with each sample set performed in duplicate. Plates were scanned at +3 mm, 100 µm, with press ‘on’ for donor, acceptor and FRET channels. Voltages are optimized to achieve maximum sensitivity while avoiding oversaturation. Since only Fcorr is plotted and acceptor and donor signals are only used to achieve overlap values, the raw data values for each channel do not matter, thus voltage ratios need not be retained. Each channel was background subtracted and quantified in ImageQuant TL software. Fcorr was then plotted and fit to the previously defined Equation (3).
The number of ionic bonds involved in the (PARP-1)-DNA interaction was determined by the following Equation (14):
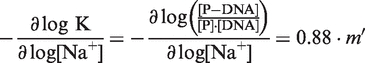 |
(7) |
| (8) |
where, K is the observed binding affinity, and [P] is the concentration of free protein, and [P-DNA] is the concentration of the protein–DNA complex. Therefore, the slope of the line from a plot containing log [Na+] versus log K can be used to extract the number of ionic interactions (14).
Preparation of fluorescently labeled Nap1 and histone H2A-H2B
Saccharomyces cerevisiae Nap1 containing a single endogenous cysteine residue at position 414 was expressed and purified as previously described (all other cysteine residues were mutated to alanine) (15). Purified Nap1 was then fluorescently labeled with Atto-647N maleimide (Sigma) by dialyzing into a buffer containing 300 mM NaCl, 20 mM Tris (pH 7.5) and 0.2 mM TCEP at 4°C. To this a 2- to 3-fold molar excess of dye to Nap1 was added and incubated overnight at 4°C. Labeled Nap1 was then dialyzed into the same buffer overnight at 4°C. The labeled Nap1 was then run over a G-25 spin column to remove unreacted dye. Nap1 deletion mutants were expressed with a histidine-tag on the N-terminus and purified using nickel-NTA affinity column. Nap1 has an extinction coefficient of 36 900 M−1 cm−1 at 280 nm and 0.05 was used for the A280/A644 correction factor for Atto-647 N, according to the manufacturer's guidelines; concentrations were determined as described above (Equation 1).
Xenopus laevis or S. cerevisiae histone H2A-H2B was expressed and purified as two independent subunits with H2B mutated at T112C for labeling purposes. H2B was labeled with Alexa-488 maleimide and refolded with H2A, as previously described, to form the H2A-H2B heterodimer (15). H2A–H2B has an extinction coefficient of 11 920 M−1 cm−1 at 280 nm and 0.12 was used for A280/A644 correction factor for Alexa-488, according to the manufacturer's guidelines; concentrations were determined as described above (Equation 1).
Nap1 binding assays
To determine the binding affinity of Nap1 to histone H2A–H2B using FRET, reactions were performed similarly to those described above for nPARP-1 binding with the following changes. H2A–H2BDonor was kept constant at 1 nM, while Nap1Acceptor was titrated in binding buffer consisting of 10 mM Tris pH 7.5, 300 mM KCl, 5% glycerol, 1 mM DTT, 0.01% CHAPS detergent and 0.01% NP-40. All titrations contain at least two wells with no Nap1 present as a donor-only control; a titration with acceptor-only sample was added as a control for spectral overlap, with each sample set performed in duplicate. Plates were scanned, and then quantified as described above.
Competition assays were performed similar to the FRET binding affinity assay, but with a constant 10 nM concentration of H2A–H2BDonor and 50 nM of Nap1Acceptor, while titrating unlabeled Nap1 protein. H2A–H2BDonor was kept at 10 nM to ensure that excess H2A–H2BDonor was not present in the reaction. Titrations were performed as described above; we have found Nap1Acceptor can be added to either each 2-fold titration reaction before addition of H2A–H2BDonor or with H2A–H2BDonor. Fcorr was then plotted and fit to the following IC50 binding Equation (16):
| (9) |
If the binding interaction is totally competed for, Ymin should ideally equal zero. Using the combination of the IC50 value for the mutant protein and the determined KD of the wild-type protein, the KD of the mutant protein can be calculated as follows:
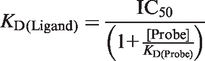 |
(10) |
Probe is Nap1Acceptor. If the [Probe] is ≫ than the KD:
| (11) |
In the case of competition with the same molecule that is labeled and unlabeled (assuming identical affinities) the equation becomes:
| (12) |
Protein/DNA fluorescent labeling
When selecting fluorescent labels for a particular system, various considerations must be taken into account. For example, the type and location of fluorophore determines the degree and direction of fluorescence (de)quenching. For (de)quenching studies of H1, we found Oregon Green 488 to be most suitable because of its sensitivity to environmental changes and its high quantum yield. A high quantum yield allows more photons to be emitted, thus increasing the sensitivity of the system. Other fluorophores that may be suitable for quenching are: Alexa-488, Tetramethylrhodamine-based dyes, fluorescein, and Cy3. We found in some instances that the detergents mentioned above can reduce the magnitude of fluorescence change upon binding. If no (de)quenching is observed in pilot experiments, we substitute detergent with 100 µg/mL of BSA to suppress sticking.
For FRET experiments, suitable donor and acceptor dye pairs must be selected. To reduce spectral overlap, dyes should be selected for low overlap between the acceptor emission spectra and the donor excitation spectra of both dyes. However to increase the distance in which the interaction can be observed (i.e. putting fewer restrictions on the position of the dyes) R0 should be relatively high (>50 Å), thus a large overlap between donor emission and acceptor excitation is ideal. As a good compromise, we selected Alexa-488 (DONOR) and Atto-647N or Cy5 (acceptor) as donor–acceptor pairs. By selecting dyes with high quantum yield for both donor and acceptor, the sensitivity and dynamic range of the assay are increased. Alternatively, Atto-532 can be substituted for Alexa-488 with good results.
Selecting the position of the label on the protein also requires consideration. While many methods for protein labeling exist (17), we prefer maleimide or iodoacetamide conjugation to a single surface-exposed cysteine. Other techniques lack the specificity of cysteine conjugation or require tagging a fluorescent protein or specific domain to a terminal end of the protein, potentially far from the interaction site. Quenching studies require a cysteine somewhere near the expected site of interaction, but not within the interacting region. For FRET experiments, sites where quenching is minimized and that are close enough to achieve suitable efficiency transfer should be chosen (ideally <70 Å apart). In some cases (e.g. for nPARP11-486) naturally occurring free cysteines can be used for derivatization, but more commonly a single cysteine will be introduced by site directed mutagenesis with additional exposed cysteines mutated to serine, threonine or alanine. Care must be taken to keep the sulfhydryl group reduced prior to labeling. When conjugating the protein to the dye, the labeling efficiency should be optimized for maximum dynamic range and sensitivity. Importantly, the fluorescently labeled protein should be assayed for its activity to ensure the fluorophore does not affect the properties of the protein. It is ideal to remove as much free dye as possible (e.g. using a G-25 resin); failure to do so will result in excess background, which can be overlap-subtracted, but will reduce the overall dynamic range of the system.
DNA or RNA can either be labeled with a 5’ C6 amine, 5’ or 3’ C6 thiol, or internally via an amino modifier dT or dA (18). Other linkages also exist. We suggest using a minimal fragment with labels on the end, which is more cost-effective than an internal label. However, if a longer DNA construct is required, an internal label closer to the binding site is ideal. PCR with fluorescently labeled primers is a well-established approach to obtain labeled DNA (19).
RESULTS
Approach
We find that fluorescence (de)quenching and FRET are versatile techniques for performing high-throughput equilibrium binding measurements. A common practice for determining binding affinities is to monitor the changing environment around a fluorophore within a protein upon substrate binding; either through internally fluorescent amino acids or through conjugation with an organic dye. Upon binding, the fluorescence signal either decreases (quenching) or increases (dequenching) due to various photophysical effects (20). Historically, internal fluorescence has been used to characterize protein interactions (21), however we find it advantageous to use conjugated organic dyes because they have greater specificity (we know exactly where and which molecule is being changed) and sensitivity, and aren't effected by optical phenomena such as the inner filter effect (20). To obtain thermodynamic binding constants between two molecules, fluorescence (de)quenching experiments are performed by titrating an unlabeled molecule into a labeled probe molecule that is present at low (sub-KD) concentration. Fluorescence quenching has been widely used to measure high-affinity protein-protein and protein-nucleic acid interactions [e.g. Andrews et al. (15)], but to our knowledge has not been adapted to a high-throughput format.
FRET is not widely used to determine binding affinities. FRET relies upon the distance-dependent transfer of energy from an excited donor to an acceptor fluorophore, where the efficiency of transfer is strongly dependent on the distance between the two fluorophores (6,22). Therefore, FRET is observed only when an interaction between distinct donor and acceptor labeled molecules occurs, providing a direct readout of the interaction. For most applications, the strong dependence on the distance results in a binary readout (i.e. FRET or no FRET). Compared to quenching, FRET has the distinct quantitative advantages of greater signal change and signal-to-background ratio. It allows one to change conditions (i.e. salt concentration), without affecting the ability to observe the interaction; in contrast, (de)quenching can be sensitive to salt or buffer changes. FRET is limited by the requirement for labeling both binding partners, which may not always be practical. Additional controls to correct for spectral overlap must be performed (see below). While FRET has been utilized to measure high-affinity interactions inferred from intramolecular distance changes (9,23,24), it has not been widely used for measuring intermolecular interactions between labeled components. Several recent descriptions for quantitative intermolecular FRET affinity measurements have been published; however these experiments rely upon high probe concentrations and are not amenable to high-affinity interactions (11,25,26).
While fluorescence measurements can be performed in a variety of platforms, we have optimized our experiments for 384-well, glass bottom microplates, followed by fluorescence imaging on a standard Typhoon Trio multimode imager. The use of passivated microplates (compared to cuvettes) reduces sample consumption, obviates the need for serial additions of samples over extended periods of time, and allows experiments to be performed at the benchtop, rather than at a fluorometer. To perform microplate-based experiments, surface passivation with a hydrophobic silane, along with NP-40 and CHAPS detergents, minimizes fluorescence changes due to adsorption of labeled macromolecules to the surface (Supplementary Methods 1; Supplementary Figure S1); a common source of data artifacts. For protein–DNA interactions, we demonstrate that titrating DNA rather than protein is preferable, as it limits the buildup of nonspecific protein–DNA complexes, allowing for the selection of the most specific interaction(s) (Supplementary Methods 2; Supplementary Figure S2). We further demonstrate that FRET can be used in a competition assay to measure relative binding affinities of different components or mutants. This is particularly useful when amino acids are systematically mutated to map interaction interfaces (e.g. alanine scanning). In a competition assay, many mutant proteins can be screened for their effect on the interaction, while requiring labeling of only the wild-type protein and its interaction partner. Importantly, quantitative rather than binary information is obtained. Specific experimental details regarding the three case studies presented here are described in the ‘Methods’ section. Notably, all variations of the HI-FI assay require the fluorescent labeling of one or both components. Specific details regarding the labeling of H1, PARP1, Nap1 and histone H2A–H2B and general labeling methodologies are available in the ‘Methods’ section. Here, we successfully applied the HI-FI system to three distinct and biologically interesting case studies, highlighting its usefulness for quantitatively characterizing protein–DNA and protein–protein interactions.
Case study 1: HI-FI dequenching reveals linker histone H1 specificity and stoichiometry for DNA substrates
Fluorescence (de)quenching represents the simplest form of the HI-FI assay. The experiments are performed by titration of an unlabeled molecule (in this case, DNA or nucleosome) into a labeled molecule (in this case, H1) that is present at a constant, low (sub-KD), concentration. Upon interaction, an increase (or, for some systems, a decrease) in fluorescence emission intensity due to changes in the local environment of the fluorophore is observed (Figure 2A).
Figure 2.

H1 binds 207 bp nucleosomes with higher affinity than free DNA. (A) Cartoon representation depicting the fluorescence (de)quenching of labeled histone H1 upon binding of DNA. (B) Pseudo-color overlay of a microplate assay showing fluorescence enhancement of H1 (green) upon binding to nucleosome or DNA. A total of 0.5 nM Alexa-647 (red) was added to each well for easier visualization and as pipetting control. (C) H1 binding curves to DNA (black filled square with solid lines) and 207 bp nucleosomes (red filled circles with solid lines) derived from data in (B). Data were globally fit with equation (3) with R2 values being or exceeding 0.91. Norm. F.I. is normalized fluorescence intensity. (D) Native PAGE of samples taken from a microplate assay visualized by fluorescence (top) and ethidium bromide (bottom). Numbers 1–4 indicate band positions for H1-nucleosome, H1-DNA, nucleosome, and DNA, respectively. (E) Measurements at higher concentrations reveal 2:1 DNA:H1 (black filled square with solid lines) and 1:1 nucleosome:H1 (red filled circles with solid lines) stoichiometries. Points and error bars represent the average and SD of four replicates. Nuc., nucleosome.
We have used HI-FI quenching to study the interaction of linker histone H1 with DNA and nucleosomes. H1 is an abundant, highly basic nuclear protein that stabilizes higher order chromatin structure and regulates transcription and other nuclear processes (27–29). H1 binds free DNA, but prefers nucleosomes and nucleosome arrays (30–34). In vitro, H1 is difficult to work with as it has a propensity to precipitate DNA and chromatin due to high-affinity, nonspecific interactions. Thus, to achieve probe concentration <10-fold below the KD, H1 affinity experiments have nearly exclusively been derived from gel-shift assays, where H1 is titrated onto radiolabeled DNA (34,35). While this approach has been useful for characterizing certain aspects of the H1–nucleosome interaction, it can be misleading. This is because gel data can miss binding information due to subtle changes in migration, accumulation of multiple bands arising from multiple H1 binding events, and be influenced by kinetic dissociation (e.g. a transition from slow exchange to fast exchange may be interpreted as a loss of interaction) (2). Furthermore, gel-shift assays are limited in throughput.
Thermodynamic binding constants were obtained by fluorescently labeling H1 and measuring fluorescence de-quenching upon titration of DNA or nucleosomes (Figure 2A). In this setup, H1 binds only to the highest affinity site(s), eliminating the buildup of H1 on a single substrate due to non-specific interactions (Supplementary Methods 2; Supplementary Figure S2). The raw image of the titrations shows an increase in H1 fluorescence intensity (F.I.) upon binding to the substrate (Figure 2B). The quantified data is fit using Equation (3) to extract apparent binding affinities (KD) and Hill coefficients (n) (Figure 2C). The data shows that H1 binds with 4-fold higher affinity to nucleosomes with linker DNA (1.2 ± 0.3 nM) than to the same non-nucleosomal 207 bp DNA fragment (4.9 ± 0.6 nM) (Supplementary Table S1).
Fluorescence changes can be caused by phenomena other than a direct and specific interaction between two macromolecules, thus careful controls need to be implemented. To verify that an interaction between the components has indeed occurred, and that nucleosomes remain intact under assay conditions, we removed samples from the microplate after scanning and analyzed them by native PAGE. The gel was scanned for fluorescence to verify the presence of H1, followed by staining with ethidium bromide to visualize nucleosomes and DNA (Figure 2D). We do not observe the higher migrating bands upon titration of DNA or nucleosome that were seen in previously published protein titrations (34,36), indicating lower affinity interactions are minimized in our approach.
The number of H1 molecules bound per nucleosome or DNA fragment was determined by increasing the H1 concentration to greater than 5-fold the KD. The stoichiometric point is located at the transition between the two linear phases of the curve (Figure 2E). Under our conditions, one H1 molecule is bound per nucleosome, whereas two 207 bp DNA fragments bind to a single molecule of H1. This is consistent with the notion that H1 has two DNA-binding sites (33,34,37), which can be satisfied in a single nucleosome with two protruding segments of linker DNA, or by two separate DNA molecules. This is likely the basis for its preference of nucleosomal over free DNA (33). Unlike nucleosome binding, the binding of the two DNA molecules to H1 is cooperative (n = 2; Supplementary Table S1).
Case study 2: HI-FI FRET of PARP1–DNA reveals a strong ionic dependence on DNA binding
Depending on the location of the fluorophore, not all interactions result in significant fluorescence (de)quenching. To overcome this, we have adapted the HI-FI assay for FRET. FRET is the distance-dependent non-radiative transfer of energy from an excited donor to an acceptor fluorophore, where the efficiency of transfer is strongly dependent on the distance between the two fluorophores (4). FRET is, therefore, observed only when an interaction occurs between distinct donor- and acceptor-labeled molecules (Figure 3A) (22). While the error of FRET experiments is usually small, they require fluorescent labeling of both binding partners.
Figure 3.

FRET analysis reveals salt-dependent binding of PARP1 to DNA. (A) A cartoon representation showing FRET as a result of protein–DNA interaction. (B) Representative microplate images showing the binding of donor-labeled nPARP1Donor to DNAAcceptor. Top three images are raw data showing acceptor, donor and FRET channels for acceptor only samples (A) and samples containing a donor–acceptor pair (DA). Fcorr is the FRET image which has been mathematically corrected for spectral overlap using ImageJ software; a high contrast image of Fcorr exemplifies the lack of signal in the DNAAcceptor only titration and that signal arises only from nPARP1Donor being present. (C) Representative binding curves showing the interaction between nPARPDonor to DNAAcceptor using FRET. Curves show binding reactions performed in 200 (red filled circles with solid lines) and 250 mM (black filled squares with solid lines) NaCl, respectively. Data were fit to a single binding curve (Equation 3). R2 values for shown curves meet or exceed 0.97. (D) A log–log plot of salt concentration versus binding affinity reveals a linear dependence on binding between nPARPDonor and DNAAcceptor, indicating an ionic dependence to binding. The data are fit to a line to extract the ionic dependence on binding. (E) Stoichiometric measurements of nPARPDonor to DNAAcceptor performed at elevated protein concentrations (200 nM) at 175 mM NaCl. Each of the three linear phases was fit to lines, with intersections indicating both 1:1 and 2:1 DNA:PARP stoichiometries. Points and error bars represent the average and range of two replicates.
In a proof-of-principle study, we determined the affinity of the PARP1 DNA-binding domain (residues 1–486; nPARP1) to DNA. PARP1 associates with chromatin as well as with damaged DNA, and plays important roles in initiating the DNA damage repair response and in transcription regulation (29). Only a limited set of studies have quantitatively probed the DNA-PARP1 interaction, with conflicting results (13,38,39). These studies all primarily relied on measuring changes in fluorescence anisotropy of a fluorescently labeled DNA upon titration of PARP1.
nPARP1 was labeled with a donor fluorophore at an endogenous cysteine (nPARP1Donor) and titrated with a 30 bp acceptor-labeled DNA fragment (DNAAcceptor). Upon excitation of donor, a decrease in nPARP1Donor signal and concomitant increase in DNAAcceptor signal was observed, indicating energy transfer due to complex formation (Figure 3B). Obtaining quantitative information from FRET requires a variety of controls to correct for signal arising from spectral overlap between the dyes (spectral overlap corrected FRET signal; Fcorr) (9,10), especially under conditions where the acceptor is at significantly higher concentrations than the donor (detailed in ‘Methods’ section; Figure 1A and B). The over-contrasted image in Figure 3B shows that by using these correction methods, no signal is observed in wells containing donor-only or acceptor-only, such that only signal with FRET-pairs remains.
Binding reactions were performed with 10–20 nM nPARP1Donor to obtain an estimate for the KD. Quantitative experiments were then performed with nPARP1Donor >10-fold below the KD. The Fcorr values were fit to a single-event binding curve to obtain KD. Figure 3C shows binding curves for nPARP1Donor to DNAAcceptor at two different salt concentrations. From these data, we obtain KD values of 40 ± 4 nM and 160 ± 11 nM at 200 mM and 250 mM NaCl, respectively, demonstrating a strong dependence on the ionic strength. This confirms that the observed signal change is not due to uncorrected spectral overlap, but a result of the direct interaction between nPARP1Donor and DNAAcceptor. Notably, the binding curves obtained from FRET exhibit very small errors, despite the low fluorescence transfer efficiency at saturation (E ≈ 0.1).
Further analysis of the nPARP1Donor–DNAAcceptor interaction at intermediate salt concentrations allows us to determine the number of ions involved in the interaction (14). By extracting the slope from the linear fit of a log–log plot (Figure 3D) and using Equation (8) we calculate that 7.7 ± 0.5 ions are involved in the interaction between PARP-1 and this specific DNA construct. FRET can also be used to determine the stoichiometry of the nPARP1Donor–DNAAcceptor complex (Figure 3E). The nPARP1Donor–DNAAcceptor interaction shows two transitions, indicating two distinct binding stoichiometries of 1:1 and 2:1 for DNA:nPARP1. This is consistent with the idea that PARP-1 has two zinc finger DNA-binding domains, which are thought to bind in tandem, but might bind two distinct DNA molecules at saturating DNA concentrations (38).
Case study 3: HI-FI FRET competition for the quantitative-comparative analysis of (H2A–H2B)–Nap1 complexes
Systematic site-directed mutagenesis, coupled with quantitative analysis of the binding properties of the mutant proteins, is a powerful approach to map regions of interaction. Common qualitative techniques such as GST-pulldown and gel-shift assays may miss biologically relevant small or intermediate effects on the affinity. We have adapted the HI-FI FRET assay to measure competition between unlabeled mutant proteins and labeled wild-type protein. If the KD of the wild-type protein for the ligand is known, this straightforward approach can also be used to obtain KD values for mutant proteins. The key advantage to this approach is that it circumvents the need to fluorescently label each mutant construct, greatly increasing the number of proteins that can be analyzed in a short period of time. Notably, both the donor- and acceptor-labeled protein can be competed in this format (Supplementary Methods 6; Supplementary Figure S4).
We have applied the HI-FI competition assay to characterize regions of Nap1 that are implicated in the interaction with histones H2A–H2B. Nap1 is a histone chaperone that is implicated in histone shuttling, as well as nucleosome assembly and disassembly (40,41). Although its structure is known (40), and its interaction with H2A–H2B has been determined using fluorescence quenching in a fluorometer (15), the site(s) of interaction on Nap1 are yet to be elucidated.
H2A–H2BDonor (10 nM) was combined with wild-type Nap1Acceptor (50 nM), and increasing amounts of unlabeled wild-type or mutant Nap1 was added to compete with the (H2A-H2BDonor)–Nap1Acceptor complex. The competition was monitored by a loss of FRET between wild-type Nap1Acceptor and H2A–H2BDonor (Figure 4A). The Fcorr values were fit to extract the IC50 value. The IC50 is the concentration of competitor needed to reduce the amount of (H2A–H2BDonor)–Nap1Acceptor complex signal by 50%, and is proportional to the Nap1Acceptor concentration and the competitor's binding affinity, as described in ‘Methods’ section (16). Labeled Nap1 is kept >5-fold over the KD to ensure that the IC50 is proportional to the KD; however, this is not absolutely necessary (16). H2A–H2BDonor concentration was kept 5-fold below the Nap1Acceptor concentration to eliminate the possibility of free H2A–H2BDonor in the system.
Figure 4.

(H2A–H2B)–Nap1 competition as a tool for identification of the binding interface. (A) A cartoon representation showing a competition experiment where the interaction between FRET partners is lost upon addition of unlabeled competitor protein. (B) Binding curve obtained from FRET-based binding between H2A–H2BDonor and Nap1Acceptor. Data were fit to a single exponential (Equation 3) with a Hill-coefficient. (C) Representative competition curves of unlabeled wild-type Nap1 (black filled square with solid lines), Nap11–365(blue filled triangles with solid lines), Nap174–417 (red filled circles with solid lines) and Nap174–365 (violet filled inverted triangles with solid lines) to the (H2A–H2BDonor)–Nap1Acceptor complex. H2A–H2BDonor and Nap1Acceptor remained constant at 10 nM and 50 nM, respectively, with the unlabeled Nap1 protein titrated. Points and error bars represent the average and range of two experimental replicates. R2 values for shown meet or exceed 0.94. (D) Raw images of data from the competition experiment between H2A-H2BDonor and Nap1Acceptor with unlabeled Nap1. From top to bottom; Donor (green), FRET (red) and a pseudo-color overlay of Donor (green) and FRET (red) signals obtained from competitive binding between the FRET pair and unlabeled Nap1. (E) Data plotted from a representative competition experiment showing the raw data (black filled circles with solid lines), background corrected data (blue filled squares with solid lines) or Fcorr (red filled triangles with solid lines) values. Little difference is observed in signal intensity after background correction, but a significant change is observed after spectral overlap subtraction. (F) The same data plotted as in (A), but normalized to highlight the impact of not correcting for spectral overlap. The uncorrected data significantly deviates from the Fcorr curve giving a non-normal IC50 curve.
To demonstrate the feasibility of this approach, we first re-determined the binding constants obtained previously by fluorescence quenching in a fluorometer using FRET between Nap1Acceptor and H2A–H2BDonor. Upon titration of Nap1Acceptor, we measure a binding constant of 8.8 nM (Figure 4B and Supplementary Table S1), which is within error of the previous published value of 7.8 nM (15). To highlight the effectiveness of the competition assay, wild-type Nap1Acceptor was competed with unlabeled wild-type Nap1 (Figure 4C). For visualization, raw data for donor FRET, and the donor-FRET overlay (Figure 4D) show an increase in donor signal and decrease in FRET signal, indicating a loss of interaction between the two labeled components. Fcorr values were plotted and fit to equation (10) to extract an IC50 of 250 nM (Figure 4C and Supplementary Table S1). This value is higher than the theoretical value of 59 nM, potentially due to slight differences in affinities between labeled and unlabeled Nap1 (unpublished data), or to the propensity of the Nap1 homodimer to carry two acceptor labels; decreasing the stochastic probability of competition (42,43). Regardless, the assay is highly useful for comparing the properties of various mutant proteins as long as binding is competitive, since the IC50 of mutant proteins will change proportionally. Notably, since donor and acceptor molecules are present in constant amounts at near stoichiometric levels, raw F signal can be used to obtain IC50 values. However, caution must be used when doing so, because it will obtain a close, but different value from those obtained by plotting Fcorr (Figure 4E, and F; Supplementary Methods 4). As a further validation, Fcorr goes to zero at saturating amounts of unlabeled competitor, indicating that true competition has been attained between labeled and unlabeled molecules.
In one application, we competed the Nap1–histone interaction with a series of terminally truncated Nap1 mutants. From these data, we observe 2.5-, 5- and 20-fold changes in affinity relative to wild-type Nap1 for Nap11–365, Nap174–417 and Nap174–365 mutants, respectively (Figure 4C and Supplementary Table S1). These differences are more pronounced than expected based on previously reported values (15), as the competition was performed at higher salt; however the cooperative effect of the terminal tails remains. We have demonstrated the advantages of this approach by measuring numerous mutant Nap1 proteins (D'Arcy et al., manuscript in preparation). Some mutants failed to compete with the interaction between wild-type Nap1 and H2A–H2B, even though they retained their ability to form a complex with histones in native PAGE, performed at high (>1 µM) concentrations. The HI-FI competition assay is also excellently suited to determine the effects of post-translational modifications and discern subtle differences between various protein isoforms.
DISCUSSION
The HI-FI assay, described here, gives a platform for increasing throughput while obtaining quantitative interaction data. With an initial investment in time to fluorescently label one or both interacting molecules, the HI-FI system can replace common qualitative and semi-quantitative binding assays, such as affinity pull-down or gel-shift assays. The HI-FI system is performed in solution, thus avoiding many of the caveats of surface immobilization. Unlike other fluorescence approaches [such as fluorescence lifetime and fluorescence correlation spectroscopy (FCS)], HI-FI can be implemented on equipment that is standard in most biochemistry departments. While we used a highly sensitive fluorescence imaging instrument, the assays are easily transferable to a microplate reader if sensitivity is less of an issue. Further reduction in sample volume and increases in throughput can be achieved by expanding to 1536-well plates and by using pipetting robots. Importantly, the assays are easily implemented with minimal training time, as long as the labeled proteins have already been established.
The sensitivity, reliability, versatility and high-throughput nature of the HI-FI system makes it applicable to many diverse applications. First, the ability to sample many interactions in a short time contributes toward developing a quantified interactome. For example, apparent affinities within an interaction network can be measured and used as additional input into computer models, thereby greatly increasing their predictive power. Second, since all measurements are performed in solution, HI-FI assays are also amenable to characterizing multi-component macromolecular complexes; possibly by using relatively crudely purified proteins. Third, while we have shown the applicability of the HI-FI system for protein–protein and protein–DNA interactions, in principle it could also be applied to characterizing the ever increasing number of RNA interacting proteins or other RNA–substrate interactions. Our strategy of keeping the labeled protein at low concentrations, while titrating in the nucleic acid, could be particularly advantageous for RNA characterization. Fourth, HI-FI methodologies can easily be adapted for measuring kinetics (a common function found in many plate readers); a useful parameter in the characterization of transient complexes. Fifth, the HI-FI competition assay is particularly powerful for systematically determining sites of interaction through scanning point or deletion mutagenesis, since only the wild-type molecule needs to be labeled. Current approaches miss all but the most dramatic changes in affinity, whereas the HI-FI system's high sensitivity and large dynamic range can detect much more subtle changes. Scanning can be further expedited by using a two-point assay instead of a full titration curve (Supplementary Methods 5; Supplementary Figure S3) further reducing sampling time and sample consumption. Lastly, protein-protein interactions are increasingly a target for therapeutics. A similar strategy could be used to screen for potential therapeutics (antibodies, polypeptides, aptamers or small molecules) that disrupt or enhance a specific interaction. Ultimately, the practical nature of the HI-FI system will allow researchers of varying backgrounds to accurately perform thermodynamic protein characterization in a high-throughput and consistent manner.
SUPPLEMENTARY DATA
Supplementary Data are available at NAR Online: Supplementary Table S1, Supplementary Figures S1–S5, Supplementary Methods 1–6 and Supplementary References [10, 44–48].
FUNDING
Funding for open access charge: Howard Hughes Medical Institute (to K.L.); National Institutes of Health (GM0884090, GM067777).
Conflict of interest statement. None declared.
Supplementary Material
ACKNOWLEDGEMENTS
We thank all members of the Luger lab, especially S. Bergeron, for critical review and discussion, D. Winkler for technical advice and K. Benson and K. Martin for help with data collection. We thank the W.M. Keck Protein Purification Facility and P. Dyer for reagents, and the CSU CVMBS Typhoon imaging facility (C. Wilusz) for use of their instrument.
REFERENCES
- 1.Vidal M, Cusick ME, Barabasi AL. Interactome networks and human disease. Cell. 2011;144:986–998. doi: 10.1016/j.cell.2011.02.016. [DOI] [PMC free article] [PubMed] [Google Scholar]
- 2.Hellman LM, Fried MG. Electrophoretic mobility shift assay (EMSA) for detecting protein-nucleic acid interactions. Nat. Protocols. 2007;2:1849–1861. doi: 10.1038/nprot.2007.249. [DOI] [PMC free article] [PubMed] [Google Scholar]
- 3.Jing M, Bowser MT. Methods for measuring aptamer-protein equilibria: a review. Anal. Chim. Acta. 2011;686:9–18. doi: 10.1016/j.aca.2010.10.032. [DOI] [PMC free article] [PubMed] [Google Scholar]
- 4.Sun Y, Wallrabe H, Seo SA, Periasamy A. FRET microscopy in 2010: the legacy of Theodor Forster on the 100th anniversary of his birth. Chemphyschem. 2011;12:462–474. doi: 10.1002/cphc.201000664. [DOI] [PMC free article] [PubMed] [Google Scholar]
- 5.Heeres JT, Hergenrother PJ. High-throughput screening for modulators of protein-protein interactions: use of photonic crystal biosensors and complementary technologies. Chem. Soc. Rev. 2010;40:4398–4410. doi: 10.1039/b923660k. [DOI] [PubMed] [Google Scholar]
- 6.Royer CA, Scarlata SF. Fluorescence approaches to quantifying biomolecular interactions. Methods Enzymol. 2008;450:79–106. doi: 10.1016/S0076-6879(08)03405-8. [DOI] [PubMed] [Google Scholar]
- 7.Favicchio R, Dragan AI, Kneale GG, Read CM. Fluorescence spectroscopy and anisotropy in the analysis of DNA-protein interactions. Methods Mol. Biol. 2009;543:589–611. doi: 10.1007/978-1-60327-015-1_35. [DOI] [PubMed] [Google Scholar]
- 8.Dyer PN, Edayathumangalam RS, White CL, Bao Y, Chakravarthy S, Muthurajan UM, Luger K. Reconstitution of nucleosome core particles from recombinant histones and DNA. Methods Enzymol. 2004;375:23–44. doi: 10.1016/s0076-6879(03)75002-2. [DOI] [PubMed] [Google Scholar]
- 9.Hieb AR, Halsey WA, Betterton MD, Perkins TT, Kugel JF, Goodrich JA. TFIIA changes the conformation of the DNA in TBP/TATA complexes and increases their kinetic stability. J. Mol. Biol. 2007;372:619–632. doi: 10.1016/j.jmb.2007.06.061. [DOI] [PubMed] [Google Scholar]
- 10.Lee NK, Kapanidis AN, Wang Y, Michalet X, Mukhopadhyay J, Ebright RH, Weiss S. Accurate FRET measurements within single diffusing biomolecules using alternating-laser excitation. Biophys. J. 2005;88:2939–2953. doi: 10.1529/biophysj.104.054114. [DOI] [PMC free article] [PubMed] [Google Scholar]
- 11.Martin SF, Tatham MH, Hay RT, Samuel ID. Quantitative analysis of multi-protein interactions using FRET: application to the SUMO pathway. Protein Sci. 2008;17:777–784. doi: 10.1110/ps.073369608. [DOI] [PMC free article] [PubMed] [Google Scholar]
- 12.Muschielok A, Andrecka J, Jawhari A, Bruckner F, Cramer P, Michaelis J. A nano-positioning system for macromolecular structural analysis. Nat. Methods. 2008;5:965–971. doi: 10.1038/nmeth.1259. [DOI] [PubMed] [Google Scholar]
- 13.Lilyestrom W, van der Woerd MJ, Clark N, Luger K. Structural and biophysical studies of human PARP-1 in complex with damaged DNA. J. Mol. Biol. 2010;395:983–994. doi: 10.1016/j.jmb.2009.11.062. [DOI] [PMC free article] [PubMed] [Google Scholar]
- 14.Record MT, Jr, Lohman ML, De Haseth P. Ion effects on ligand-nucleic acid interactions. J. Mol. Biol. 1976;107:145–158. doi: 10.1016/s0022-2836(76)80023-x. [DOI] [PubMed] [Google Scholar]
- 15.Andrews AJ, Downing G, Brown K, Park YJ, Luger K. A thermodynamic model for Nap1-histone interactions. J Biol. Chem. 2008;283:32412–32418. doi: 10.1074/jbc.M805918200. [DOI] [PMC free article] [PubMed] [Google Scholar]
- 16.Goodrich JA, Kugel JF. Binding and Kinetics for Molecular Biologists. Cold Spring Harbor Laboratory Press; 2006. [Google Scholar]
- 17.Wang H, Nakata E, Hamachi I. Recent progress in strategies for the creation of protein-based fluorescent biosensors. Chembiochem. 2009;10:2560–2577. doi: 10.1002/cbic.200900249. [DOI] [PubMed] [Google Scholar]
- 18.Anderson BJ, Larkin C, Guja K, Schildbach JF. Using fluorophore-labeled oligonucleotides to measure affinities of protein-DNA interactions. Methods Enzymol. 2008;450:253–272. doi: 10.1016/S0076-6879(08)03412-5. [DOI] [PMC free article] [PubMed] [Google Scholar]
- 19.Bohm V, Hieb AR, Andrews AJ, Gansen A, Rocker A, Toth K, Luger K, Langowski J. Nucleosome accessibility governed by the dimer/tetramer interface. Nucleic Acids Res. 2011;39:3093–3102. doi: 10.1093/nar/gkq1279. [DOI] [PMC free article] [PubMed] [Google Scholar]
- 20.van de Weert M. Fluorescence quenching to study protein-ligand binding: common errors. J. Fluoresc. 2010;20:625–629. doi: 10.1007/s10895-009-0572-x. [DOI] [PubMed] [Google Scholar]
- 21.Khrapunov SN, Dragan AI, Sivolob AV, Zagariya AM. Mechanisms of stabilizing nucleosome structure. Study of dissociation of histone octamer from DNA. Biochim. Biophys. Acta. 1997;1351:213–222. doi: 10.1016/s0167-4781(96)00199-6. [DOI] [PubMed] [Google Scholar]
- 22.Schaferling M, Nagl S. Forster resonance energy transfer methods for quantification of protein-protein interactions on microarrays. Methods Mol. Biol. 2011;723:303–320. doi: 10.1007/978-1-61779-043-0_19. [DOI] [PubMed] [Google Scholar]
- 23.Whittington JE, Delgadillo RF, Attebury TJ, Parkhurst LK, Daugherty MA, Parkhurst LJ. TATA-binding protein recognition and bending of a consensus promoter are protein species dependent. Biochemistry. 2008;47:7264–7273. doi: 10.1021/bi800139w. [DOI] [PubMed] [Google Scholar]
- 24.Dragan AI, Privalov PL. Use of fluorescence resonance energy transfer (FRET) in studying protein-induced DNA bending. Methods Enzymol. 2008;450:185–199. doi: 10.1016/S0076-6879(08)03409-5. [DOI] [PubMed] [Google Scholar]
- 25.Song Y, Madahar V, Liao J. Development of FRET assay into quantitative and high-throughput screening technology platforms for protein-protein interactions. Ann. Biomed. Eng. 2011;39:1224–1234. doi: 10.1007/s10439-010-0225-x. [DOI] [PMC free article] [PubMed] [Google Scholar]
- 26.Chakraborty M, Sengupta A, Bhattacharya D, Banerjee S, Chakrabarti A. DNA binding domain of RFX5: interactions with X-box DNA and RFXANK. Biochim. Biophys. Acta. 2010;1804:2016–2024. doi: 10.1016/j.bbapap.2010.07.009. [DOI] [PubMed] [Google Scholar]
- 27.Woodcock CL, Skoultchi AI, Fan YH. Role of linker histone in chromatin structure and function: H1 stoichiometry and nucleosome repeat length. Chromosome Res. 2006;14:17–25. doi: 10.1007/s10577-005-1024-3. [DOI] [PubMed] [Google Scholar]
- 28.Izzo A, Kamieniarz K, Schneider R. The histone H1 family: specific members, specific functions? Biol. Chem. 2008;389:333–343. doi: 10.1515/BC.2008.037. [DOI] [PubMed] [Google Scholar]
- 29.Krishnakumar R, Gamble MJ, Frizzell KM, Berrocal JG, Kininis M, Kraus WL. Reciprocal binding of PARP-1 and histone H1 at promoters specifies transcriptional outcomes. Science. 2008;319:819–821. doi: 10.1126/science.1149250. [DOI] [PubMed] [Google Scholar]
- 30.Watanabe F. Cooperative interaction of histone H1 with DNA. Nucleic Acids Res. 1986;14:3573–3585. doi: 10.1093/nar/14.8.3573. [DOI] [PMC free article] [PubMed] [Google Scholar]
- 31.Lu X, Hansen JC. Identification of specific functional subdomains within the linker histone H1(o)C-terminal domain. J. Biol. Chem. 2004;279:8701–8707. doi: 10.1074/jbc.M311348200. [DOI] [PubMed] [Google Scholar]
- 32.Hayes JJ, Kaplan R, Ura K, Pruss D, Wolffe A. A putative DNA binding surface in the globular domain of a linker histone is not essential for specific binding to the nucleosome. J. Biol. Chem. 1996;271:25817–25822. doi: 10.1074/jbc.271.42.25817. [DOI] [PubMed] [Google Scholar]
- 33.Clark DJ, Thomas JO. Salt-dependent co-operative interaction of histone H1 with linear DNA. J. Mol. Biol. 1986;187:569–580. doi: 10.1016/0022-2836(86)90335-9. [DOI] [PubMed] [Google Scholar]
- 34.Caterino TL, Fang H, Hayes JJ. Nucleosome linker DNA contacts and induces specific folding of the intrinsically disordered H1 carboxyl-terminal domain. Mol. Cell. Biol. 2011;31:2341–2348. doi: 10.1128/MCB.05145-11. [DOI] [PMC free article] [PubMed] [Google Scholar]
- 35.Nightingale KP, Pruss D, Wolffe AP. A single high affinity binding site for histone H1 in a nucleosome containing the Xenopus borealis 5 S ribosomal RNA gene. J. Biol. Chem. 1996;271:7090–7094. doi: 10.1074/jbc.271.12.7090. [DOI] [PubMed] [Google Scholar]
- 36.Nightingale K, Wolffe AP. Methylation at CpG sequences does not influence histone H1 binding to a nucleosome including a Xenopus borealis 5 S rRNA gene. J. Biol. Chem. 1995;270:4197–4200. doi: 10.1074/jbc.270.9.4197. [DOI] [PubMed] [Google Scholar]
- 37.Stasevich TJ, Mueller F, Brown DT, McNally JG. Dissecting the binding mechanism of the linker histone in live cells: an integrated FRAP analysis. EMBO J. 2010;29:1225–1234. doi: 10.1038/emboj.2010.24. [DOI] [PMC free article] [PubMed] [Google Scholar]
- 38.Langelier MF, Planck JL, Roy S, Pascal JM. Crystal structures of poly(ADP-ribose) polymerase-1 (PARP-1) zinc fingers bound to DNA: structural and functional insights into DNA-dependent PARP-1 activity. J. Biol. Chem. 2011;286:10690–10701. doi: 10.1074/jbc.M110.202507. [DOI] [PMC free article] [PubMed] [Google Scholar]
- 39.Eustermann S, Videler H, Yang JC, Cole PT, Gruszka D, Veprintsev D, Neuhaus D. The DNA-binding domain of human PARP-1 interacts with DNA single-strand breaks as a monomer through its second zinc finger. J. Mol. Biol. 2011;407:149–170. doi: 10.1016/j.jmb.2011.01.034. [DOI] [PMC free article] [PubMed] [Google Scholar]
- 40.Park YJ, Luger K. Structure and function of nucleosome assembly proteins. Biochem. Cell Biol. 2006;84:549–558. doi: 10.1139/o06-088. [DOI] [PubMed] [Google Scholar]
- 41.Zlatanova J, Seebart C, Tomschik M. Nap1: taking a closer look at a juggler protein of extraordinary skills. FASEB J. 2007;21:1294–1310. doi: 10.1096/fj.06-7199rev. [DOI] [PubMed] [Google Scholar]
- 42.Kepert JF, Mazurkiewicz J, Heuvelman GL, Toth KF, Rippe K. NAP1 modulates binding of linker histone H1 to chromatin and induces an extended chromatin fiber conformation. J. Biol. Chem. 2005;280:34063–34072. doi: 10.1074/jbc.M507322200. [DOI] [PubMed] [Google Scholar]
- 43.McBryant SJ, Peersen OB. Self-association of the yeast nucleosome assembly protein 1. Biochemistry. 2004;43:10592–10599. doi: 10.1021/bi035881b. [DOI] [PubMed] [Google Scholar]
- 44.Chernyshev EA, Tolstikova NG. Gas-phase reactions of hydride chlorosilanes with alkylbenzenes and α- and β-chlorostyrenes. Bull. Acad. Sci. USSR Div. Chem. Sci. 1962;11:1147–1151. [Google Scholar]
- 45.Tsodikov OV, Holbrook JA, Shkel IA, Record MT., Jr Analytic binding isotherms describing competitive interactions of a protein ligand with specific and nonspecific sites on the same DNA oligomer. Biophys. J. 2001;81:1960–1969. doi: 10.1016/S0006-3495(01)75847-X. [DOI] [PMC free article] [PubMed] [Google Scholar]
- 46.Royer CA, Scarlata SF. Fluorescence approaches to quantifying biomolecular interactions. Methods Enzymol. 2008;450:79–106. doi: 10.1016/S0076-6879(08)03405-8. [DOI] [PubMed] [Google Scholar]
- 47.Andrews AJ, Luger K. A coupled equilibrium approach to study nucleosome thermodynamics. Methods Enzymol. 2011;488:265–285. doi: 10.1016/B978-0-12-381268-1.00011-2. [DOI] [PubMed] [Google Scholar]
- 48.Fan JY, Zhou J, Tremethick DJ. Quantitative analysis of HP1alpha binding to nucleosomal arrays. Methods. 2007;41:286–290. doi: 10.1016/j.ymeth.2006.11.001. [DOI] [PubMed] [Google Scholar]
Associated Data
This section collects any data citations, data availability statements, or supplementary materials included in this article.