


Abstract
An approach to infer the unknown microbial population structure within a metagenome is to cluster nucleotide sequences based on common patterns in base composition, otherwise referred to as binning. When functional roles are assigned to the identified populations, a deeper understanding of microbial communities can be attained, more so than gene-centric approaches that explore overall functionality. In this study, we propose an unsupervised, model-based binning method with two clustering tiers, which uses a novel transformation of the oligonucleotide frequency-derived error gradient and GC content to generate coarse groups at the first tier of clustering; and tetranucleotide frequency to refine these groups at the secondary clustering tier. The proposed method has a demonstrated improvement over PhyloPythia, S-GSOM, TACOA and TaxSOM on all three benchmarks that were used for evaluation in this study. The proposed method is then applied to a pyrosequenced metagenomic library of mud volcano sediment sampled in southwestern Taiwan, with the inferred population structure validated against complementary sequencing of 16S ribosomal RNA marker genes. Finally, the proposed method was further validated against four publicly available metagenomes, including a highly complex Antarctic whale-fall bone sample, which was previously assumed to be too complex for binning prior to functional analysis.
INTRODUCTION
Binning methods place metagenomic sequences into taxon-specific bins to infer the underlying population structure of a sequenced metagenomic library. When subsequently combined with the functional information obtained through genomic analysis of each bin, a sampled microbial community can be analysed in light of the roles assigned to each constituent population and the interactions between them. The primary challenge in doing so is the assignment of anonymous metagenomic sequences to an unknown, and potentially large, set of microbial populations within the sample. This is dependent on the taxonomic resolution at which sequences are classified and the accuracy at which such classification is possible. Attempts to address this problem have adhered to two dominant strategies: classifying sequences based on similarity to a reference set of nucleotide or protein sequences; and grouping sequences based on inherent patterns, also referred to as signatures, in nucleotide base composition.
Although binning methods based on sequence similarity are able to classify short-read metagenomic sequences (1), they are computationally intensive—either during training or execution—and, more critically, they can yield biased results for novel metagenomes depending on the reference database used. These methods also include approaches which search for universally conserved marker genes, such as partial 16S rRNA genes (2), within a metagenome. Such methods can provide an accurate indication of the types of populations within the sample (3) but are not suitable for binning because of their low assignment coverage, which is less than 0.01% of a typical metagenome (4).
On the contrary, binning methods that are based on conserved, population-specific signatures in nucleotide base composition are typically unbiased. These signatures take advantage of the non-random ordering of nucleotide bases in a DNA sequence (5), which is presently understood to be mediated by mechanisms related to DNA repair and replication, mutational tendencies and conservation of dinucleotide ordering (6). While early studies confirmed differences in the guanine–cytosine (GC) content between unrelated populations, current binning methods make use of higher order base composition statistics, referred to as nucleotide frequency. The earliest of these nucleotide frequency signatures (6) was motivated by an observation that dinucleotides in a DNA molecule are highly conserved and biased between different microbial genomes (7). More recently, it has been found that tetranucleotide frequency represented a more conserved, species-specific signature (8), which led to further investigation into the tetramer composition of prokaryotic DNAs (9–12).
Given these signatures, machine learning methods which group related sequences based on nucleotide frequency can be categorized as either supervised or unsupervised (13). Unsupervised learning methods operate in the absence of prior knowledge and are less prone to biases—such as those of similarity-based methods—that hinder the classification of novel sequences, which is a general limitation of purely supervised methods that conflicts with the intended exploratory nature of metagenomics. Unsupervised methods can also use the support of multiple sequences to infer the presence of microbial populations or clades which manifest as clusters. This is in contrast to supervised classification of individual sequences irrespective of other related sequences that are available in a metagenome. Characterizing the functional potential of microorganisms that cannot be isolated in pure culture [more than 99% (14)] is thus more readily addressed using unsupervised, exploratory strategies.
Of these unsupervised methods, the self-organising map (SOM) and its various extensions have shown good performance in grouping higher order frequencies calculated on metagenomic sequences (5,15,16). The primary goal of unsupervised methods is cluster discovery (i.e. population discovery), where the accuracy of the resulting clusters will be influenced by the ambiguity in cluster distributions caused by noise. To the best of our knowledge, there does not exist a binning method that explicitly handles such noise. This can necessitate semi-automatic or manual cluster selection due to ambiguous cluster boundaries (17,18). In contrast, parametric, model-based clustering methods (19) can resolve such ambiguous cluster distributions, including cluster overlap which is a common yet critical problem among relatively complex metagenomes.
These issues translate to three key goals that are addressed in this study. First, we acknowledge that grouping metagenomic sequences using nucleotide frequency is known to be limited by the number of distinct microbial populations in a metagenome (9), which means that the discrimination between a large number of populations in a species-rich (complex) metagenome is anticipated to be low in taxonomic resolution. In order to alleviate this limitation, we introduce a two-tiered clustering framework, where we first group sequences coarsely using a novel transformation of the oligonucleotide frequency-derived error gradient (11) and GC content. Given that there may still be multiple populations in each of these coarse groups—but of lower species richness than the original complex metagenome—we anticipate that subsequent refinement using nucleotide frequency will produce more accurate bins at higher taxonomic resolution. Secondly, we address issues related to ambiguity in cluster distribution using a model-based clustering framework. Thirdly, in addition to evaluating the performance on simulated benchmarks, we validate our proposed method on real metagenomic data sets.
This article is organized as follows: the ‘Materials and Methods’ section describes the data used for benchmarking and evaluation and introduces the proposed two-tiered, model-based clustering framework. The ‘Results’ section reports the performance of the proposed method on benchmark data, followed by the analysis of a novel pyrosequenced library of a mud metagenome. In addition, the proposed framework is validated against four real-world metagenomes, including an analysis of an Antarctic whale-fall bone sample, which has previously not undergone binning prior to downstream analysis. The published annotations, available for two of these publicly available metagenomes, are used as reference labels to estimate the performance of the proposed framework. The ‘Discussion’ section elaborates on the performance of the clustering approach and compares it to similarity-based techniques, emphasizing both the advantages and disadvantages of the proposed framework. Finally, possible directions for further improvement to the proposed framework are outlined.
MATERIALS AND METHODS
Data sets
The proposed clustering framework is evaluated on three in silico-simulated benchmark metagenomes. Such benchmarks enable the standardization of performance measures for comparative examination of different binning methods (20). In addition to two publically available benchmarks (20), a new benchmark has been constructed to address performance criteria that are not handled by the two existing benchmarks (this new benchmark is also made available for public use). The binning method is then used to analyse a novel metagenome sampled from the sediment of a mud volcano located in southwestern Taiwan. Moreover, the proposed framework is further validated against four publicly available metagenomes.
Benchmark data sets
The two publically available benchmarks selected for this study represent metagenomes of different complexity and were originally constructed using random, variable-length samples of 113 fully sequenced microbial genomes (20). The dominant strains of the low-complexity (simLC) data set have a maximum coverage of ~5.19×, flanked by strains with coverage less than 1.2×. The medium complexity data set (simMC) simulates three dominant strains represented with 3.48× to 2.77× coverage. As per the recommendation by Mavromantis et al., simulated contigs >8 kb are used for benchmarking. Due to an insufficient number of such contigs that meet the criteria for binning of the high-complexity (simHC) data set, it has been excluded from the benchmark tests.
In its place, a third benchmark was constructed using eight completely sequenced bacterial genomes—Thiobacillus denitrificans ATCC 25259 (NC_007404), Granulibacter bethesdensis CGDNIH1 (NC_008343), Pelotomaculum thermopropionicum SI (NC_009454), Prochlorococcus marinus MIT9303 (NC_008820), Desulfitobacterium hafniense Y51 (NC_007907), Bacillus halodurans C-125 (NC_002570), Streptococcus gallolyticus UCN34 (NC_013798), Mycoplasma arthritidis 158L3-1 (NC_011025)—and one simulated bacterial chromosome. The modal GC content estimates of the selected set of genomes were approximately 60, 50 and 40%, which allows for examination of grouping a large set of sequences into a moderate number of populations with closely matched GC content—a case not handled by the two above-mentioned benchmarks. The simulated contigs were sampled from both strands of each genome, with the selection of sample length based on a power law distribution. The resulting benchmark contained a total of 40 000 sequences with a minimum sequence length of 301 bp, maximum length of 3000 bp and an average length of 947 bp.
Novel mud volcano metagenome
The sample was collected in 2009 from a single core of sediment surrounding a a terrestrial mud volcano, located near a fault-line in southwestern Taiwan. The bulk DNA was isolated from the core at a depth of 30 mm. The data set was sequenced using 454 Life Sciences FLX Titanium pyrosequencer and assembled into 45 055 contigs (minimum length: 89 bp, maximum length: 15 716 bp and average length: 510.0 bp). The complexity of the sampled community as given by the Chao-1 (21) 3% estimator is 984.142 (confidence interval 888.177–1115.23).
Four publically available metagenomes
Moreover, we have selected four publicly available metagenomes that represent distinct sampling environments, DNA extraction protocols and sequencing methodologies to validate the proposed framework on real-world data. Three of these data sets represent the real-world equivalents of the model communities that constitute the simLC and simMC benchmarks. These include, in order of complexity, an enhanced biological phosphorus removing (EBPR) sludge (22), an acid mine drainage (AMD) biofilm (23) and an endosymbiont community of the Mediterranean gutless worm (GWE) (17).
The EBPR metagenome contains 96 563 contigs totalling 100.27 Mb, with sequence lengths ranging from 168 bp to 1631 bp and an average length of 1039 bp. The AMD data set contains 180 713 sequences (181.57 Mb) with a minimum sequence length of 115 bp, maximum sequence length of 5449 bp and a mean sequence length of 1005 bp. The GWE data set contains 5016 contigs with a cumulative length of 42 Mb, assembled from an original set of 281 448 reads.
The fourth metagenome is a deep-sea Antarctic whale-fall bone (WF-B) sample that has not undergone binning prior to functional analysis because of its high complexity (24). The sequenced WF-B library contains 40 549 sequences with a total length of 41.27 Mb with sequences ranging between 141 bp and 7720 bp with a mean sequence length of 1018 bp.
Proposed method
In this study, a two-tiered clustering framework is proposed (Supplementary Figure S1), which uses two sets of nucleotide base composition signatures to group anonymous metagenomic sequences into populations, or groups of related populations, that correspond to the underlying population structure of a sampled microbial community. It is demonstrated that when two signatures capture different characteristics of base composition they can be used to group sequences differently, and in cases where these groups are mutually exclusive and at different taxonomic resolutions, such features can be arranged hierarchically to increase the taxonomic resolution at which the population structure is inferred. Intuitively, the signature that results in a more coarse grouping of sequences (Tier 1) is processed prior to the signature which is known to produce more discriminant groups (Tier 2) but requires a relatively low diversity metagenome to do so.
In accordance with the above, we propose a novel clustering scheme at Tier 1 based on the oligonucleotide frequency derived error gradient (OFDEG) (11) for coarse grouping, and tetranucleotide frequency at Tier 2 for refinement (Figure 1). This selection is justified by comparing the performance of these features to four other features which have shown exemplary performance in other metagenomic binning studies. At both tiers, a proposed model-based clustering framework is used to group sequences based on each respective feature set, as outlined in the following section.
Figure 1.

The motivation for the two-tiered clustering framework and the features used therein: (A) the PCA projection of the tetranucleotide frequency of random fragments of nine genomes results in poor discrimination between each genome type—shown here for the first two principal components for visualization and is also applicable when considering the first three principal components. (B) However, the nine genome types are found to form two coarse groups in the OFDEG and GC content space. (C and D) When the tetranucleotide frequency of fragments is computed with respect to each group, the discrimination between each genome type is more clearly evident.
Model-based clustering framework
A Gaussian mixture model (25) is assumed for the distribution of feature vectors at both tiers of the framework—the assumption of normality was verified using random 5 kb fragments of 124 bacterial and archaeal genomes using the Shapiro–Wilk test, α = 0.01 (Supplementary Figure S2). We have used the MCLUST implementation of the Gaussian mixture model (26), which uses the Expectation–Maximisation algorithm for estimating the parameters of the mixture model, and a Bayesian Information Criterion (BIC) for model selection. This implementation allows unconstrained and arbitrary shaped clusters, which can handle cases where the relative abundance of constituent populations is not uniform.
Handling noise in metagenomic data sets
A critical consideration in dealing with metagenomic data is various forms of noise, which affect cluster distributions in any feature space. In this study, we introduce a ternary categorization of noise in metagenomic data:
Category I (C-I): fragments of unrelated, or distantly related, genomes can have highly similar compositional signatures. In such cases, sequences within a bin may be incorrectly assumed to have originated from the same clade. This will increase the number of false positives at lower taxonomic ranks (poor resolution), and will ultimately affect the overall specificity of binning.
Category II (C-II): fragments of genomes with large intra-genomic variation in base composition are more likely to be outliers of the true cluster distribution, or in extreme cases form small satellite clusters. These can be regarded as false negatives, which will reduce the sensitivity of binning.
Category III (C-III): for distinct organisms that share common characteristics in base composition clusters may partially overlap, causing ambiguity in cluster membership of sequences.
The extent of each form of noise varies depending on the metagenome under analysis. In some cases, the noise can be implicitly alleviated by the selection of robust features. Where this is not possible, alternative strategies are possible. For instance, noise of C-I form can be reduced by adopting a multitiered clustering strategy where, in a two-tiered scheme, the feature at Tier 2 can be used to distinguish fragments that appear similar at Tier 1. C-II noise can be reduced by prefiltering the distribution of feature vectors prior to clustering, and also by applying post-processing constraints on cluster models to restrict membership of ambiguous sequences. C-III noise can also be handled with the application of post-processing constraints by estimating the regions of cluster overlap using the parameterized cluster models. Provided that features are non-redundant, these forms of noise can be assumed to be uncorrelated and can therefore be handled independently at each tier. Formal descriptions of these noise reduction schemes are described in the following section.
Prefiltering
The nearest-neighbour variance estimation (NNVE) (27) method was used to estimate the proportion of noise in violation of model assumptions. Alternative prefiltering methods can be used; the NNVE method was chosen for its simplicity and robustness. The NNVE method requires the specification of an initial noise estimate and a neighbourhood size. These were estimated using the benchmark data sets, see Supplementary Figure S3. Sequences that were identified as noise using NNVE were removed from the data set prior to clustering.
Post-processing cluster models with the application of constraints
Reducing C-II noise: the distance between each feature vector and the centre of a cluster is given by the exponential of the Mahalabonis distance (28), which takes into account the density of feature vectors within a cluster. A minimum threshold ϵm on this distance is used to restrict cluster membership to sequences within close proximity to the cluster mean, given by:
| (1) |
where μi is the mean of cluster i, fji is the j-th feature vector assigned to cluster i, Σi is the covariance matrix of cluster i and δi ∈ [0, 1]. We have found that ϵm = 0.20 is adequate in removing sparsely distributed outliers and is sufficient for most metagenomic data sets, while for a set of heavily concentrated and overlapping clusters ϵm ≈ 0.5 is required.
Reducing C-III noise: the second form of constraint is applied to the probability of cluster membership zi. Sequences which cannot be assigned to a cluster with a probability greater than a predefined threshold will not be included in the final classification. This can be conveniently formulated in terms of the uncertainty in classification of a sequence, given by:
| (2) |
where  ∈ [0, 1], and depending on the degree of overlap 0.10 ≤ ϵu ≤ 0.50. The bounds were determined empirically and reflects the degree of cluster overlap. For data sets that cannot be resolved with ϵu < 0.50, the clusters are considered degenerate and cannot be used for meaningful downstream analysis, as the assignments to a cluster would be worse than pure chance. An analogue to this form of constraint is that of Ref. (16) which was used to constrain label propagation.
Proposed Tier 1 clustering
As described above, coarse clustering at Tier 1 is facilitated by a novel transformation of OFDEG (see Supplementary Methods 1 for a description of OFDEG) and GC-content. The OFDEG measure provides a more stable estimate of a genomic signature in a compact 1D representation of the underlying oligonucleotide frequency content in a DNA sequence. It essentially measures the degree of biasing in the composition of oligonucleotides in a sequence, in a conceptually similar, yet fundamentally different, manner to measurements of sequence entropy. Small-scale noise will be less influential in the computation of OFDEG, given that the bootstrap sampling procedure provides a better estimate of the variation in nucleotide base composition than the standard way of computing nucleotide frequencies. The properties of OFDEG suggest that noisy biases that can occur in metagenomic DNA (either through sequencing errors or features of the community under investigation) will not significantly affect its meaningfulness as a representative genomic signature. Its conservation over varying sequence lengths is relatively consistent with standard nucleotide frequency. However, the sparsity of the oligonucleotide occurrence vector has a more profound effect on the computation of OFDEG (due to a decrease in linearity) than classical nucleotide frequency statistics. The combination of OFDEG and GC content (henceforth referred to as O-GC) has been shown to group related sequences [refer to (11) and Supplementary Figure S4].
Taxonomic resolution: when the number of different populations in a sample increases, the way in which O-GC groups fragments becomes important. For instance, the GC content of a sequence is used primarily for clustering metagenomes of low diversity and high coverage, since its discriminatory power reduces as the species diversity within a metagenome increases (9). Similarly, OFDEG measures the relative magnitude of biases in base composition rather than specific oligomer over-/under-representation. As such, unrelated sequences can have an approximately equivalent OFDEG value. For example, the OFDEG value would be equivalent for a sequence containing only A/T when compared with a sequence containing only G/C, despite the sharp contrast in base composition. This measure of the relative magnitude of biases is, however, remarkably consistent within genomes as well as between fragments of a genome. It is not a necessary requirement that the groups produced by O-GC contain only related populations. The populations within a group may or may not be related (such composite groups will be refined at Tier 2), but if sequences from distinct populations are not grouped by O-GC—i.e. have distinct base composition—they can be assumed to be unrelated (7). Therefore, both OFDEG and GC can be used to coarsely group anonymous sequences.
Proposed transformation of the O-GC distribution: a novel characteristic of sequences in O-GC space is that they are distributed along a 1D manifold—Supplementary Figure S5 shows the mean O-GC values of 124 bacterial and archaeal genomes computed in 5 kb increments over total of 1 Mb for each genome; the selected genomes (12) represent diverse taxa, with GC content ranging from 20% to 80%. Using standard least squares regression, the manifold can be expressed as a quadratic polynomial (R2 = 0.9474, for 4-mer basis on OFDEG) of the form,
| (3) |
where, for OFDEG calculated using a dimer basis α = 0.954, β = −1.878 and η = 1.851; and for a tetramer basis α = 1.916, β = −3.753 and η = 2.691, assuming that O-GC has been scaled by the standard deviation of the range of OFDEG and GC content within the sample. Note that Equation (3) cannot be used to directly compute OFDEG given a value of GC content, since fragments of full genomes have OFDEG values that are distributed about these manifolds.
An ordination technique using principal curves (PCs) (29) is then applied to the O-GC distribution to capture the non-linear geometry of points in O-GC space. Without doing so, the Gaussian model estimation tends to produce incorrect estimates of cluster distribution, particular in the mid-GC content range where the true cluster distribution tends to depart from the assumptions of normality and cannot be captured by a standard Gaussian parameterization. As such, points in O-GC space are projected onto a new coordinate system that captures the non-linear variation of points along a PC (Supplementary Figures S6 and S7). Based on simulations and data experience, the pre-generated PC, as given by Equation (3), is a valid approximation to the general O-GC distribution of different metagenomic data sets. Furthermore, metagenomes that have a strong GC bias lack a sufficient number of sequences over a wide range of GC content to accurately estimate a PC.
The projection of points in O-GC space onto the new space defined by the PC follows a two stage procedure. First, we define a sequence in O-GC space as Fi = (fgc, fofdeg), which corresponds to its GC content and OFDEG value, respectively. The orthogonal projection of each Fi onto the PC is defined as the intersection of Fi on the PC (at Pi = (uγ, vγ)) under the constraint that the normal at Pi intersects Fi. This normal for any point along the PC can be easily formulated using Equation (3), and is given by:
| (4) |
The intersection of the normal to the γ4 curve,  , corresponds to the coordinates of the desired projection onto the PC:
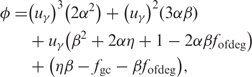 |
(5) |
where the required solution  is given by the cubic root such that it fullfils:
| (6) |
where uγn satisfies ϕ = 0, ∀n = 1… 3 and  .
.
Given a function Γ4: Fi → Pi, the transformed vertical coordinate in the new space is given by:
| (7) |
where λ determines the sign of the transformed coordinate:
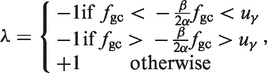 |
(8) |
which in other words identifies the set of all points which are concave in relation to γ4 (+1) and those which are not (−1). The transformed horizontal coordinate is then given by:
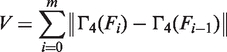 |
(9) |
where V is monotonic and positive, and assumes that all coordinates are presorted in ascending order of fgc. Given points in this new space (defined by U and V), the mixture model can then be estimated on a more representative cluster distribution of O-GC, in order to generate the required set of coarse groups for Tier 2 refinement.
Tier 2 refinement using tetranucleotide frequency
Given the clusters obtained at Tier 1 using PC-mapped O-GC, the tetranucleotide frequency for each sequence is computed within the context of each Tier 1 cluster, which is treated as self-contained metagenome of lower diversity than the original data set. In doing so, the aggregate tetranucleotide frequency profile is computed for each sequence and its reverse complement to remove strand bias (9). PCA is applied to the resulting feature vectors for dimensionality reduction, to simplify model estimation during clustering, and to alleviate density estimation requirements in the original high-dimensional space. This resulting PCA projection reduces the original feature space to three dimensions using the first three principal components of the PCA—this projection was found to accurately represent meaningful cluster distributions of the data sets considered in this study. The clusters that result from Tier 2 refinement are referred to as bins. The following section reports the quality of clustering that can be expected when applying this two-tiered framework to simulated and real-world data.
RESULTS
Performance on benchmark data
The quality of coarse clustering at Tier 1 using O-GC is compared with the performance of four other features (details of these features can be found in Supplementary Methods 2) to justify its use at Tier 1. The designation of features are as follows: ODDS : dinucleotide odds ratio; TNF : tetranucleotide frequency; MOMN-TNF : maximal order Markov-normalized TNF; ZSN-TNF : z-score normalized TNF; O2-GC : OFDEG calculated using a dimer basis, and GC content; and O4-GC : OFDEG calculated using a tetramer basis and GC content. The results at Tier 1 are then used to justify the selection of TNF for the refinement of coarse groups at Tier 2. The benchmark performance at Tier 2 is subsequently compared with PhyloPythia (30), TaxSOM (31), TACOA (32), and S-GSOM (16), which also use nucleotide frequency as means to infer the underlying microbial population structure. It is shown that the proposed clustering framework improves the taxonomic resolution and accuracy of binning on the benchmarks considered.
Accuracy and selection of features at Tier 1
The results indicate O4-GC as the best candidate for coarse grouping at Tier 1, given that it performed best overall for the more complex simMC and sim-BG benchmarks (Table 1). It is apparent that the model-based framework is in its own respect an accurate method when using only one tier (as it aptly removes sequences which cause errors in cluster distribution). However, for increasingly complex samples the limitations of feature sets become apparent, and requires the use of the secondary tier to increase the taxonomic resolution of bins. The features based on TNF were found to probe deeper into the population structure at lower taxonomic ranks (attempting species-level classification), but were found to be limited in sensitivity due to C-II noise. For instance, when using TNF discrimination between clusters containing the Desulfitobacterium hafniense Y51 and the Pelotomaculum thermopropionicum, SI sequences became difficult, with an observed tendency for over-specification of cluster structure due to residual C-II noise. In contrast, O4-GC tends to group sequences more coarsely with higher sensitivity (parsimonious classification), and so is a more suitable candidate for primary grouping.
Table 1.
A comparison of features at Tier 1 of the clustering framework revealed O4-GC as the most suitable feature for Tier 1 separation
| Ranking | Feature | simLC | simMC (family) | simMC (species) | sim-BG | Average performance |
|---|---|---|---|---|---|---|
| 1 | O4-GC | 100.00 | 100.00 | 87.00 | 79.49 | 91.62 |
| 2 | O2-GC | 100.00 | 100.00 | 87.02 | 73.89 | 90.23 |
| 3 | TNF | 100.00 | 77.42 | 100.00 | 75.32 | 88.19 |
| 4 | ODDS | 100.00 | 100.00 | 87.82 | 62.23 | 87.51 |
| 5 | ZSN-TNF | 100.00 | 77.72 | 97.30 | 70.05 | 86.27 |
| 6 | MOMN-TNF | 100.00 | 77.67 | 98.74 | 59.49 | 83.96 |
The accuracies reported here are the F-scores for each cluster solution.
Selecting the Tier 2 feature-set given O4-GC at Tier 1
The Tier 1 cluster solutions were examined for mutual redundancy using the Adjusted Rand Index (ARI) (33). The results of pairwise comparisons of cluster structure is shown in Table 2. The most unique grouping of sequences was given by ZSN-TNF with an ARI between 0.53 and 0.58 when compared with all other feature sets with the exception of MOMN-TNF. The ZSN-TNF and MOMN-TNF cluster solutions were highly similar (ARI = 0.96), suggesting that Markov-normalization has a unique effect on cluster distribution in comparison to unnormalized nucleotide frequency. However, given that the accuracy and coverage of these two feature sets were subpar, they cannot be considered for Tier 2 separation. Instead, it was observed that O2-GC and O4-GC had a mutual ARI of 0.99, but approximately 800 unique sequences were not included in each respective cluster solution, noting that there is some difference between the two features which is most likely a function of noise rather than cluster structure. The O4-GC and TNF feature sets constitute the largest proportion of accurately classified sequences, with O4-GC classifying 3076 sequences and TNF classifying 3834 sequences. Given that only 2021 (52.71%) of sequences in TNF had correspondence to O4-GC at an ARI of 0.86, they are sufficiently non-redundant and can therefore be applied hierarchically.
Table 2.
Pairwise comparisons of the cluster structure produced by each compositional feature
| MOMN-TNF | ODDS (%) | O2-GC (%) | O4-GC (%) | TNF (%) | ZSN-TNF (%) | |
|---|---|---|---|---|---|---|
| MOMN-TNF | 1.00 (–) | 0.87 (32.82) | 0.71 (27.45) | 0.72 (23.38) | 0.88 (26.45) | 0.96 (35.99) |
| ODDS | – | 1.00 (–) | 0.70 (44.66) | 0.70 (45.81) | 0.90 (46.71) | 0.53 (46.71) |
| O2-GC | – | – | 1.00 (–) | 0.99 (77.71) | 0.89 (51.10) | 0.55 (55.82) |
| O4-GC | – | – | – | 1.00 (–) | 0.86 (52.71) | 0.56 (58.35) |
| TNF | – | – | – | – | 1.00 (–) | 0.58 (63.24) |
| ZSN-TNF | – | – | – | – | – | 1.00 (–) |
The reported values are the ARI values between clustered feature sets; the number of sequences in correspondence between cluster solutions is shown in parentheses.
Benchmark performance using the proposed two-tiered clustering framework
Given Tier 1 clusters based on O4-GC, phylogenetic refinement using TNF was found to increase the accuracy and resolution of clusters by approximately 20%. The additional clustering tier largely corrects for the C-II noise specific to TNF.
Performance on the simLC and simMC data sets The two-tiered clustering framework retained the single cluster solution for simLC. A larger number of sequences were, however, filtered during the additional filtering stage at Tier 2. A total of 45 sequences (1.35 Mb) were classified with sensitivity and specificity equal to 100%. For simMC, the sensitivity and specificity at the rank of species was also 100%. The two clusters identified at Tier 1 were subsequently resolved into the three bins representing the three species types in the simMC benchmark.
Performance on the sim-BG data set: all nine genome types were correctly identified with an average sensitivity of 0.995 and a specificity of 1.000 at the rank of species. A six cluster solution given by O4-GC at Tier 1 was resolved into nine bins corresponding to each genome type in the data set. Bins with less than 30 sequences were rejected due to insufficient cluster support. The residual error in the final output was caused by sequences of Prochlorococcus marinus MIT9303, with five sequences (0.51%) identified as C-I noise.
Comparison of benchmark performance with current binning methods
The taxonomic resolution of the bins produced by each method differed. For the low complexity (simLC) data set, all methods, with the exception of the species-specific model of PhyloPythia, performed with sensitivity and specificity greater than 0.95 for the simLC data set and were able to recover the single cluster solution. However, neither of the existing methods were able to achieve perfect discrimination between the single-cluster solution and low abundance noise—the additional filtering stage proposed at Tier 2 of the binning framework was able to remove such ambiguous sequences.
Notably, for the more complex benchmarks, TACOA was not able to produce species-specific assignments, rather it classified most sequences at the rank of superkingdom, offerring a limited insight into the underlying population structure of the simulated metagenome. Similarly, TaxSOM was not able to classify most sequences at the rank of species, but it was able to separate sequences into multiple coarse groups. S-GSOM could produce accurate results using tetranucleotide frequency but was limited to assignments at higher taxonomic ranks, such as family or order. False classes were also identified by S-GSOM, indicating overly specific assignments. This was similarly observed when estimating the mixture model of the proposed method using only TNF at Tier 1, which highlights the benefit of preclustering the data set using O4-GC prior to clustering with TNF.
Such limitations were also applicable to PhyloPythia. For instance, using a P-value threshold of 0.5, PhyloPythia was not able to separate the Bradyrhizobiaceae family into its two constituent populations, but did achieve a sensitivity and specificity of 1.00 for the predicted rank of order. When using a different threshold (P = 0.85), it was able to resolve three classes but did so with a reduction in sensitivity to 0.40. Using the species-specific mode of PhyloPythia also recovered the three dominant populations, but again with low sensitivity. Nevertheless, PhyloPythia and TaxSOM were able to achieve the highest accuracy of the existing methods, which in both cases were still lower than the accuracy of the proposed framework (Figure 2). The overall percentage improvement of the proposed framework over PhyloPythia and TaxSOM is 78.41 and 17.55% in sensitivity, respectively; and 0.13 and 9.47% in specificity, respectively.
Figure 2.

Comparison of the proposed framework against the two next-best binning methods, PhyloPythia and TaxSOM, on the low complexity (simLC), medium complexity (simMC) and the medium–high complexity (sim-BG) benchmark data sets. The sim-BG benchmark, in particular, highlights the percentage improvement over PhyloPythia and TaxSOM at 78.41 and 17.55% in sensitivity, respectively; and 0.13 and 9.47% in specificity, respectively.
The number of sequences assigned by each method were, however, similar. With reference the complex, sim-BG data set, PhyloPhythia was able to assign 536 sequences (10.60%) at the taxonomic rank of each simulated population; TaxSOM was able to assign 1527 sequences (27.68%) at the rank of each population; while the number of assignments made by the proposed method (984, 17.51%) was situtated between the two.
Generally, it was observed that the performance of currently available methods is limited in distinguishing between closely related populations, and offers similar results to those given when using only one tier of the proposed clustering framework. This highlights the benefits to taxonomic resolution of bins that are obtained when using two non-redundant feature sets. In cases where a particular population is under-represented, the existing methods such as PhyloPythia and TaxSOM are more suitable, since the proposed framework requires sufficient sample sizes for each population to be clustered. However, the exploratory nature of the proposed framework allows unbiased characterization of metagenomes, potentially biased training is not required, and is better suited to inferring the underlying population structure of novel metagenomic samples. This is further validated in the following sections by clustering real-wold metagenomic sequences.
Analysis of a novel pyrosequenced metagenomic library of a mud volcano sample
The mud volcano sample represents a relatively GC-rich metagenome, with a large number of contigs composed of 50–60% GC and a smaller set of contigs composed of approximately 40% GC. A total of 438 contigs (13.98%) were prefiltered prior to Tier 1 clustering. Subsequent clustering at Tier 1 revealed two groups (M1 and M2), representing the dichotomous GC bias in the sample, with modal GC content of clusters at 45.79 and 55.81%, respectively. The clusters contained 1466 (3.46 Mb) and 1229 (2.24 Mb) sequences, and following the application of post-processing constraints, 27.08 and 33.36% of these sequences were removed as noise from each respective cluster. Nevertheless, over 1 Mb of sequence was retained in both M1 and M2 (2.65 and 1.49 Mb) allowing for further refinement at Tier 2. At Tier 2, secondary prefiltering of M1 removed 437 sequences (40.88%) as noise, whereas M2 was estimated to contain only 54 sequences (6.59%) as noise. Both clusters were further separated, with M1 separating into two subclusters (M1-1, M1-2) and M2 separating into three subclusters (M2-1, M2-2, M2-3). The M1-1 (964 985 bp) and M1-2 (305 247 bp) bins represent two AT-rich populations, centred at approximately 47% GC and 41% GC, whereas M2-1 (54.89% GC), M2-2 (57.98% GC) and M2-3 (54.12% GC) were all GC-rich, with 463 917, 364 820 and 90 811 bp of sequence in each bin. The smallest of these, M2-3, contained only 56 contigs and was considered as potential noise or an indication of under-represented clade.
For each Tier 2 bin, translated protein sequences of genes predicted using MetaGene (34) were compared against the NCBI non-redundant (NR) database using BLASTP (e-value: 10−5). The results were then processed using MEGAN (35) with a minimum support of 20 and a minimum bit-score of 100 (Table 3). In each bin, there was significant support for a specific genome type (Table 3). The anticipated phylogenetic diversity of the sampled methanogenic ecosystem is consistent with the predicted taxonomic assignments. Furthermore, the identified organisms all respire anaerobically, which is consistent with the depth at which the sample was taken.
Table 3.
A summary of the two-tiered binning approach applied to the novel mud volvano metagenome
| Bin | Candidate (Min support: 20) | Assigned | Not assigned (%) | No hits (%) | Total |
|---|---|---|---|---|---|
| M1-1 | Alkaliphilus metalliredigens QYMF | 61 | 165 (14.34) | 628 (54.56) | 1151 |
| M1-2 | Algoriphagus sp. PR1 | 24 | 128 (30.55) | 234 (55.85) | 419 |
| M2-1 | Pelobacter carbinolicus DSM 2380 | 22 | 80 (12.18) | 365 (55.56) | 657 |
| M2-2 | Marinobacter aquaeolei VT8 | 41 | 54 (8.90) | 347 (57.17) | 607 |
| M2-3 | Unknown | – | 55 (39.57) | 84 (60.43) | 139 |
The predicted taxonomic assignments were estimated by post-processing blastp hits (e-value: 10−5) using MEGAN with a minimum support of 20 and a minimum bitscore of 100.
The Algoriphagus-like organism found in M1-2 has previously been isolated from a similar environment (36), and is a member of the Bacteroidetes phylum that contributes to carbon cycling through the degradation of polysaccharides and macromolecules. Similarly, the Marinobacter clade identified in M2-2 is also involved in carbon cycling, and is known to proliferate in nitrogen- and phosphorus-rich environments. It is anticipated that other gammaproteobacteria are contained within M2-2, given additional assignments to an Alcanivorax-like clade. The Alkaphilus metalliredigens-like bacterium represents an obligate anaerobe capable of iron reduction, while the mesophilic bacterium Pelobacter carbinolicus is commonly found in carbon- or sulphur-rich environments and occurs in syntrophy with other methanogens. These result agree with the local geochemistry of the sample, where it was found that sulphate and methane levels decreased. These bacterial clades played a role in the methanotrophic reaction to oxidize the methane and also reduce iron compound.
The predicted taxonomic content of the bins were verified using complementary sequencing of 16S ribosomal RNA genes (Supplementary Data 1). The resulting phylogenetic characterization of the sample revealed a clear correspondence to the predicted taxons within each bin, with discrepancies in only the taxonomic rank of assignments. In this regard, MEGAN was found to be overly specific, while the 16S analysis produced conservative predictions of sample diversity. The Alkaliphilus metalliredigens-like bin was instead identified as a Clostridiaceae class; similarly, the Algoriphagus-like bin was identified as Cyclobacteriaceae; the Pelobacter-like bin was classified as an unidentified Desulfurmonadales, indicating a potentially novel environmental clade; and M2-2 was correctly identified as Marinobacter, and also accounts for the remaining Gammaproteobacteria that could not be refined due to insufficient sequence coverage. Several unclassified bacteria were found in the 16S rRNA survey, which could potentially be linked to M2-3. Furthermore, the additional phylotypes identified in the survey that were not represented in any of the bins was due to an under-representation of those genome types in the sequenced metagenomic library. For instance, sequences belonging to the Bacillariophyta clade were found among contigs shorter than 1000 bp, but were deemed insufficient in number to form a distinct cluster.
The four detected bins represented distinct yet typical roles that were expected in the mud volcano environment (Supplementary Data 2). This observation was further supported by geochemical analysis of the sample (data not shown), where activities of methane oxidation and sulphate reduction were detected which constitute a common biogeochemical profile seen in aquatic sediment environments (37). Bin M1-1, closely related to Alkalipilus metalliredgens QYMF (abbreviated as QYMF), showed a higher proportion of sequences related to selnoamino acid, in accordance with the complete genome of QYMF. KEGG analysis also revealed that M1-1 may be active in the consumption of methane in the environment, a feature which still remains poorly understood for QYMF. The KEGG profile of M2-1 was closely clustered near M1-1, which has close affiliation to Pelobacter carbinolicus. This bacterium is a typical iron and sulphur-reducing anaerobic organism and syntrophically enables the use of methane to generate hydrogen as energy (38). Such physiological characteristics are in accordance with the detected KEGG profiles, as well as the geochemistry of the sample. Similar to M2-1, M1-1 also shares a role in methane consumption but has another important role in sulphur reduction, which was shared to a much greater extent by M2-2. M2-2 was found to be closely related to Marinobacter aquaeolei, a facultative mixotrophic iron oxidizer found in anaerobic environments (39). This bacterium has a strong capability for iron oxidation and iron acquisition, and plays an important role in geochemical element cycles in similar niche environments (40). M1-2 was closely related to Algoriphagus sp. PR1, but contained few sequences carrying genes responsible for sulphur and methane metabolisms. Notably, many of the Algroiphagus species have previously been isolated from mud or soil (36); however, the role of the bacterium in sediment is not yet known. The KEGG profile analysis of these four bins has illustrated the accuracy of the proposed framework on novel data. This means more detailed information can be extracted for in-depth interpretation of an environmental sample.
Validation against publicly available metagenomes
In all cases, the proposed framework was able to recover the dominant underlying population structure of the sampled microbial communities (Table 4). The results on the WF-B metagenome further indicate that the proposed method is effective in grouping sequences that was previously not expected to be possible (24). For the AMD and GWE data sets, published sequence assignments were used as a reference for evaluation. For all other data sets, a combination of BLAST and MEGAN was used to estimate the taxonomic content of each bin.
Table 4.
Summary of the validation of the proposed framework on real-world metagenomes
| Sample | Taxon | Rank | Bins | ||||||
|---|---|---|---|---|---|---|---|---|---|
| A1-1 | A1-3 | A2-1 | A2-2 | ||||||
| Acid mine drainage | Ferroplasma | Genus | 99 | 0 | 0 | 0 | |||
| Thermoplasma archaeon | Species | 24a | 59 | 0 | 0 | ||||
| Leptospirillum group III | Species | 0 | 0 | 93 | 23a | ||||
| Leptospirillum group II | Species | 0 | 0 | 0 | 28 | ||||
| GC content (%) | 37.73 | 37.80 | 59.18 | 54.48 | |||||
| Length (Mb) | 1.87 | 0.49 | 0.48 | 2.07 | |||||
| G1-1 | G3-1 | G3-2 | G4-1 | ||||||
| Gutless worm | δ1-proteobacteria | Class | 277 | 10 | 0 | 2 | |||
| δ4-proteobacteria | Class | 14 | 153 | 0 | 4 | ||||
| γ1-proteobacteria | Class | 3 | 2 | 0 | 50 | ||||
| γ3-proteobacteria | Class | 2 | 1 | 75 | 0 | ||||
| Unknown | – | 102 | 51 | 6 | 77 | ||||
| GC content (%) | 55.68 | 55.97 | 62.48 | ||||||
| Length (Mb) | 3.74 | 1.14 | 1.76 | 0.30 | |||||
| W1-1 | W1-2 | W1-3 | W1-4 | W2-1 | W2-2 | W2-3 | |||
| Antarctic whale fall bone | Alteromonadales | Order | 649 | 21 | 10 | 5 | 0 | 0 | 0 |
| Psychrobacter | Genus | 0 | 666 | 0 | 9 | 0 | 0 | 0 | |
| Flavobacteriales | Order | 0 | 0 | 1601 | 9 | 0 | 0 | 0 | |
| Unidentified | – | – | – | – | 302 | – | – | – | |
| Actinobacteria | Class | 0 | 0 | 0 | 0 | 22 | 0 | 0 | |
| Rhodobacterales | Order | 0 | 0 | 0 | 5 | 11 | 83 | 44 | |
| Sphingomonadales | Order | 0 | 0 | 0 | 0 | 0 | 0 | 324 | |
| GC content (%) | 41.16 | 44.54 | 35.04 | 44.70 | 57.91 | 56.96 | 57.97 | ||
| Length (Mb) | 0.43 | 0.49 | 1.07 | 0.26 | 0.12 | 0.13 | 0.39 | ||
The gutless worm community revealed 236 additional contigs that have been classified. The apparent noise in the classification could be traced back to the BLAST-based assignments given in Ref. (17). The whale fall bone sample shows good separation at the rank of order.
Enhanced biological phosphorus removing sludge
A total of 899 contigs (26.17%) were binned, from an initial set of 3435 contigs that did not contain ambiguous base calls. Two distinct groups were identified at Tier 1 (E1 and E2), and did not separate further at Tier 2. A total of 357 genes were predicted in E1, of which 226 returned no significant hits to NR (BLASTP, e-value: 10−5); while 1163 genes were predicted in E2, of which 606 returned no significant hits. E1 was subsequently identified by MEGAN as a gammaproteobacteria, similar to the Thiothrix-like species originally identified in the EBPR metagenome using 16S rRNA alignments (22) and is consistent with the dominant flanking population of the EBPR sample. E2 was identified as Candidatus Accumulibacter phosphatis clade IIA str. UW-1, corresponding to the dominant population within the EBPR sample.
Acid mine drainage biofilm
A two cluster solution was selected at Tier 1 despite a maximum BIC for four clusters, due to marginal improvement in the BIC (less than 0.001%) for mixtures of more than two components. The resulting clusters comprised an AT-rich group (A1: GC = 37.57%, 893 contigs, 4.77 Mb) and a GC-rich group (A2: GC = 57.07%, 596 contigs, 4.20 Mb), corresponding to the two dominant Ferroplasma and Leptospirillum species groups, respectively. The sensitivity and specificity of the Tier 1 clusters is 100% at the rank of Order. At Tier 2, the Ferroplasma group divided into a bin containing the Ferroplasma Type I and II genome types (A1-1) and a bin containing the Thermoplasmatales archaeon Gpl cluster (A1-2). The Leptospirillum Group III genome type (A2-2) is distinguished from the Leptospirillum Group II genome type (A2-1). In both cases, the specificity of the bins was retained at 100%. The contigs that were not assigned to A2-1 and A1-2, require alignment to a reference genome for correct classification due to the mosaic structure of the genomes in the AMD sample (23) and cannot be assigned using base composition—this was similarly observed in Ref. (18). The original binning methodology which used domain knowledge of reference genomes (23) is indicative of this.
Endosymbionts of the Mediterranean gutless worm
The original set of 4793 contigs was reduced to 4262 ungapped contigs (20.08 Mb) following the removal of contigs with ambiguous bases. Four clusters were found at Tier 1 (G1, G2, G3, G4), with G3 being the only cluster to separate further at Tier 2 (G3-1, G3-2) corresponding to the δ4 and γ3 endosymbionts, respectively. It was observed that sequences of the δ1 endosymbiont were distributed over two bins (G1 and G2), indicating the presence of an additional δ-proteobacterial clade. Further analysis verified, however, that although there are significant differences at the nucleotide level, there was insufficient evidence to support differences at the functional level. When we applied the scaffold information, it was observed that the contigs in each of the two δ1 bins mapped to the same scaffold (22.34%). This is in contrast to the δ1 and δ4 bins where this occurred for 5.63% of scaffolds; and the γ1 and γ3 bins where scaffolds were formed using only the sequences within each respective bin. Therefore, E1 and E2 were combined into one bin. Moreover, a total of 236 contigs were binned using the proposed method that were previously classified as unknown (17). These additional sequences could potentially address questions that were left open in the original publication.
Antarctic whale fall bone
Due to the phylogenetic diversity of the sample [in the order of 100 or so species (24)], the bins were identified at rank of order, with two exceptions at the rank of class and genus. The WF-B sample revealed two clusters (after prefiltering 10.77% of sequences as noise) at Tier 1, which represented two distinct groups with approximately 40.28% (W1) GC and 57.04% GC (W2) content, each containing 4508 (5.44 Mb) and 1883 (2.26 Mb) sequences, respectively. At Tier 2, the W1 cluster split into four distinct bins (W1-1, W1-2, W1-3 and W1-4), the largest of which (W1-3) contained 1.07 Mb of sequence accounting for the largest bin in the data set. It was also found to have the most pronounced deviation (5.24%) from the estimated GC content of the Tier 1 clusters. The W2 cluster separated into three bins (W2-1, W2-2 and W2-3), which were all found to be of lower abundance than the W1 bins. Inspection of the taxonomic content in each bin revealed a dominant cohort of Flavobacterales (W1-3), with flanking populations consisting of Alteromonadales (W1-1), Psychrobacter (W1-2) and Sphingomonadales (W2-3, Alphaproteobacteria) in addition to an unidentified clade (W1-4), and an under-represented Actinobacteria bin (W2-1). These findings were consistent with the 16S analysis conducted by Tringe et al. (24).
DISCUSSION
The proposed two-stage model-based clustering approach has demonstrated improved performance on both simulated and real-world, low-to-medium complexity metagenomes in comparison to currently available binning methods. The use of multiple processing levels with additional noise handling, enables the separation of sequences at finer taxonomic resolutions and with higher accuracy than currently available compositional binning methods. Model-based clustering improves the accuracy of sequence assignments while the two tiered framework is shown to increase the resolution at which these assignments are made—the complementary filtering strategy maintains the integrity of the clusters at each tier.
Comparison against similarity-based methods
Binning metagenomic data prior to BLAST and MEGAN analysis was found to be beneficial. Doing so reduces the number of queries to process, thereby reducing the overall computational time to conduct a search against a database, given that all sequences need not be supplied to BLAST, but only sequences that are confidently assigned to each cluster model. Using post-processeing methods such as MEGAN eliminates the majority of ambiguity in the distribution of best BLAST hits (20,35), but for largely novel genes these assignments were found to be low in specificity. As such, many of the volcano mud bins contained a large number of unassigned sequences. These sequences could not be assigned by MEGAN but were able to be classified using the binning method. Similarly, a number of assignments made by MEGAN were not present in bins, such as hits to sequences shorter than the cutoff length for clustering. As such, both methods are observed to produce meaningful yet complementary classifications. Thus, both methods could eventually be combined into one pipelined binning approach.
Generally, however, the BLAST analysis confined to each bin reduces the likelihood of these and other spurious assignments of low abundance organisms, which can lead to errors in classification. The resulting assignments provided more accurate estimates of a bin's taxonomic content. Regardless of the number of represented organisms in databases, unsupervised methods that use nucleotide base composition will perform consistently. This is further highlighted in the comparison of the 16S rRNA marker gene analysis to the taxons assigned using MEGAN. It is observed here that MEGAN tends to over-specify the phylogenetic assignment of the bins by assigning sequences to lower level ranks, when in fact the 16S rRNA analysis showed that higher order ranks are more probable. Therefore, the BLAST/MEGAN assignments serve only as a guide, rather than comprising definitive evidence of the presence of specific genome types, as indeed the lineage may be unknown or novel. The reliance on BLAST hits as ground truth from which to annotate a cluster or to model a metagenomic data set should thus be reduced.
PCA projected nucleotide frequency
The percentage of cumulative variation explained in the first three principal components is directly correlated with the dimensionality of the features. The odds ratio has the highest percentage of variation for all benchmark data sets, followed by tetranucleotide frequency. The variation of MOMN-TNF and ZSN-TNF are less than 10% for all data sets, and the lower accuracy is indicative of PCA's inability to represent meaningful cluster structure in those feature sets. For metagenomic samples with a small number of dominant species at sufficiently high coverage, this would not significantly affect cluster distribution (as seen in the simLC and simMC data sets), as they are as likely as other features to capture some form of phylogenetically meaningful clusters, albeit with lower accuracy. For increasingly complex samples, the compound effects of being unable to uniquely capture the cluster structure of a taxonomic clade result in the poor discrimination of genome types. Attempts at pre-filtering the PCA projected space prior to clustering does not alleviate this poor cluster structure and so is presumed independent of C-II noise. Caution should thus be exercised when attempting to cluster metagenomic sequences based on the PCA of higher order nucleotide frequencies.
Limitations and future directions
Due to the consideration of contigs >1000 bp (13,41), the proposed method will perform better on metagenomes with a minimum N50 contig length of 1–1.5kb. Moreover, multiple refinement stages result in approximately 20% of sequences assigned to bins—this is comparable to the number of assignments made by other compositional binning methods; however, the assignments made by the proposed method are of higher accuracy. For the data sets considered in this study, the proportion of classified sequences is still sufficient for further downstream analysis and functional annotation, as given by the number of full and partial gene calls in each bin. Consequently, a natural extension is to use this highly accurate subset of sequences to construct robust classifiers for the unassigned set of sequences. Given that there is a sufficient number and length of sequence (>100 kb) in the bins that have been found in this study, the potential for classification exists (30). It is anticipated that the cluster models generated using the proposed model-based clustering framework will result in more accurate classification than other methods, which use sample-specific training data.
The proposed method was able to find multiple bins in two other whale fall samples (24), but verification using BLAST and MEGAN was problematic. Whether this was due to the high complexity of the samples, or biased assignments based on sequence similarity, or a combination of both was unclear. Similarly, metagenomic samples of the Hawaii Ocean time-series (42) were not separable at Tier 1, due to low coverage for the large number of closely related species in the samples, emphasizing that population coverage does affect cluster formation and is typical of binning methods which use density estimation for clustering. However, with the current trend of sequencing producing longer read lengths at higher throughput and at lower costs, these limitations will be alleviated. Unsupervised binning methods are, therefore, anticipated to be increasingly more competetive against methods based on sequence similarity for inferring the phylogenetic origin of anonymous metagenomic sequences.
AVAILABILITY
The source code and executables for the two-tiered binning framework are available at: http://www.mech.unimelb.edu.au/2tbinning/.
SUPPLEMENTARY DATA
Supplementary Data are available at NAR Online: Supplementary Data 1 and 2, Supplementary Methods 1 and 2, Supplementary Figures 1–7 and 9 and Supplementary References [6,9–12,43].
FUNDING
Australian Research Council (grant number DP1096296); mud volcano metagenomics work was supported by the National Science Council of Taiwan (grant number NSC99-2627-M-002-010) Funding for open access charge: University of Melbourne.
Conflict of interest statement. None declared.
Supplementary Material
ACKNOWLEDGEMENTS
The authors would like to thank Dr Lihung Lin for sample collection; Ching-Hung Tseng for preparing the additional benchmark data set; and Kai-Ti Chang for conducting the complementary 16S rRNA analysis of the mud volcano metagenome to validate the proposed clustering framework.
REFERENCES
- 1.Krause L, Diaz NN, Goesmann A, Kelly S, Nattkemper TW, Rohwer F, Edwards RA, Stoye J. Phylogenetic classification of short environmental DNA fragments. Nucleic Acids Res. 2008;36:2230–2239. doi: 10.1093/nar/gkn038. [DOI] [PMC free article] [PubMed] [Google Scholar]
- 2.Woese CR, Fox GE. Phylogenetic structure of the prokaryotic domain: the primary kingdoms. Proc. Natl Acad. Sci. USA. 1977;74:5088–5090. doi: 10.1073/pnas.74.11.5088. [DOI] [PMC free article] [PubMed] [Google Scholar]
- 3.Liu Z, DeSantis TZ, Andersen GL, Knight R. Accurate taxonomy assignments from 16S rRNA sequences produced by highly parallel pyrosequencers. Nucleic Acids Res. 2008;36:e120. doi: 10.1093/nar/gkn491. [DOI] [PMC free article] [PubMed] [Google Scholar]
- 4.Blow N. Exploring unseen communities. Nature. 2008;453:687–690. doi: 10.1038/453687a. [DOI] [PubMed] [Google Scholar]
- 5.Abe T, Sugawara H, Kinouchi M, Kanaya S, Ikemura T. Novel phylogenetic studies of genomic sequence fragments derived from uncultured microbe mixtures in environmental and clinical samples. DNA Res. 2005;12:281–290. doi: 10.1093/dnares/dsi015. [DOI] [PubMed] [Google Scholar]
- 6.Karlin S, Mrazek J, Campbell AM. Compositional biases of bacterial genomes and evolutionary implications. J. Bacteriol. 1997;179:3899–3913. doi: 10.1128/jb.179.12.3899-3913.1997. [DOI] [PMC free article] [PubMed] [Google Scholar]
- 7.Schildkraut CL, Mandel M, Levisohn S, Smith-Sonneborn JE, Marmur J. Deoxyribonucleic acid base composition and taxonomy of some protozoa. Nature. 1962;196:795–796. doi: 10.1038/196795a0. [DOI] [PubMed] [Google Scholar]
- 8.Pride DT, Meinersmann RJ, Wassenaar TM, Blaser MJ. Evolutionary implications of microbial genome tetranucleotide frequency biases. Genome Res. 2003;13:145–158. doi: 10.1101/gr.335003. [DOI] [PMC free article] [PubMed] [Google Scholar]
- 9.Teeling H, Meyerdierks A, Bauer M, Amann R, Glöckner FO. Application of tetranucleotide frequencies for the assignment of genomic fragments. Environ. Microbiol. 2004;6:938–947. doi: 10.1111/j.1462-2920.2004.00624.x. [DOI] [PubMed] [Google Scholar]
- 10.Teeling H, Waldmann J, Lombardot T, Bauer M, Glöckner FO. TETRA: a web-service and a stand-alone program for the analysis and comparison of tetranucleotide usage patterns in DNA sequences. BMC Bioinf. 2004;5:163. doi: 10.1186/1471-2105-5-163. [DOI] [PMC free article] [PubMed] [Google Scholar]
- 11.Saeed I, Halgamuge SK. The oligonucleotide frequency derived error gradient and its application to the binning of metagenome fragments. BMC Genomics. 2009;10:S10. doi: 10.1186/1471-2164-10-S3-S10. [DOI] [PMC free article] [PubMed] [Google Scholar]
- 12.Mrazek J. Phylogenetic signals in DNA composition: limitations and prospects. Mol. Biol. Evol. 2009;26:1163–1169. doi: 10.1093/molbev/msp032. [DOI] [PubMed] [Google Scholar]
- 13.McHardy AC, Rigoutsos I. What's in the mix: phylogenetic classifcation of metagenome sequence samples. Curr. Opin. Microbiol. 2007;10:499–503. doi: 10.1016/j.mib.2007.08.004. [DOI] [PubMed] [Google Scholar]
- 14.Amann RI, Binder BJ, Olson RJ, Chisholm SW, Devereux R, Stahl DA. Combination of 16s rRNA-targeted oligonucleotide probes with flow cytometry for analyzing mixed microbial populations. Appl. Environ. Microbiol. 1990;56:1919–1925. doi: 10.1128/aem.56.6.1919-1925.1990. [DOI] [PMC free article] [PubMed] [Google Scholar]
- 15.Abe T, Kanaya S, Kinouchi M, Ichiba Y, Kozuki T, Ikemura T. Informatics for unveiling hidden genome signatures. Genome Res. 2003;13:693–702. doi: 10.1101/gr.634603. [DOI] [PMC free article] [PubMed] [Google Scholar]
- 16.Chan C-KK, Hsu A, Halgamuge SK, Tang S-L. Binning sequences using very sparse labels within a metagenome. BMC Bioinf. 2008;9:215. doi: 10.1186/1471-2105-9-215. [DOI] [PMC free article] [PubMed] [Google Scholar]
- 17.Woyke T, Teeling H, Ivanova NN, Huntemann M, Richter M, Gloeckner FO, Boffelli D, Anderson IJ, Barry KW, Shapiro HJ, et al. Symbiosis insights through metagenomic analysis of a microbial consortium. Nature. 2006;443:950–955. doi: 10.1038/nature05192. [DOI] [PubMed] [Google Scholar]
- 18.Dick GJ, A.F Andersson, Baker BJ, Simmons SL, Thomas BC, Yelton AP, Banfield JF. Community-wide analysis of microbial genome sequence signatures. Genome Biol. 2009;10:R85. doi: 10.1186/gb-2009-10-8-r85. [DOI] [PMC free article] [PubMed] [Google Scholar]
- 19.Banfield JD, Raftery AE. Model-based gaussian and non-gaussian clustering. Biometrics. 1993;49:803–821. [Google Scholar]
- 20.Mavromatis K, Ivanova N, Barry K, Shapiro H, Goltsman E, McHardy AC, Rigoutsos I, Salamov A, Korzeniewski F, Land M, et al. Use of simulated data sets to evaluate the fidelity of metagenomic processing methods. Nat. Meth. 2007;4:495–500. doi: 10.1038/nmeth1043. [DOI] [PubMed] [Google Scholar]
- 21.Colwell RK, Coddington JA. Estimating terrestrial biodiversity through extrapolation. Phil. Trans. Royal Soc. London Ser. B. 1994;345:101–118. doi: 10.1098/rstb.1994.0091. [DOI] [PubMed] [Google Scholar]
- 22.Martin HG, Ivanova N, Kunin V, Warnecke F, Barry KW, McHardy AC, Yeates C, He S, Salamov AA, Szeto E, et al. Metagenomic analysis of two enhanced biological phosphorus removal (EBPR) sludge communities. Nat. Biotech. 2006;24:1263–1269. doi: 10.1038/nbt1247. [DOI] [PubMed] [Google Scholar]
- 23.Tyson GW, Chapman J, Hugenholtz P, Allen EE, Ram RJ, Richardson PM, Solovyev VV, Rubin EM, Rokhsar DS, Banfield JF. Community structure and metabolism through reconstruction of microbial genomes from the environment. Nature. 2004;428:37–43. doi: 10.1038/nature02340. [DOI] [PubMed] [Google Scholar]
- 24.Tringe SG, von Mering C, Kobayashi A, Salamov AA, Chen K, Chang HW, Podar M, Short JM, Mathur EJ, Detter JC, et al. Comparative metagenomics of microbial communities. Science. 2005;308:554–557. doi: 10.1126/science.1107851. [DOI] [PubMed] [Google Scholar]
- 25.Dempster AP, Laird NM, Rubin DB. Maximum likelihood from incomplete data via the EM algorithm. J. R. Stat. Soc., Ser. B. 1977;39:1–22. [Google Scholar]
- 26.Fraley C, Raftery AE. Technical report 504. University of Washington; 2010. Mclust version 3 for R: normal mixture modeling and model-based clustering. [Google Scholar]
- 27.Wang N, Raftery AE. Nearest neighbor variance estimation (NNVE): robust covariance estimation via nearest neighbor cleaning. J. Am. Stat. Assoc. 2000;97:994–1019. [Google Scholar]
- 28.Mahalanobis PC. On the generalised distance in statistics. Proc. Natl Inst. Sci. India. 1936;2:49–55. [Google Scholar]
- 29.Hastie T, Stuetzle W. Principal curves. J. Am. Stat. Assoc. 1989;84:502–516. [Google Scholar]
- 30.McHardy AC, Martin HG, Tsirigos A, Hugenholtz P, Rigoutsos I. Accurate phylogenetic classification of variable-length DNA fragments. Nat. Meth. 2007;4:63–72. doi: 10.1038/nmeth976. [DOI] [PubMed] [Google Scholar]
- 31.Weber M, Teeling H, Huang S, Waldmann J, Kassabgy M, Fuchs BM, Klindworth A, Klockow C, Wichels A, Gerdts G, et al. Practical application of self-organizing maps to interrelate biodiversity and functional data in NGS-based metagenomics. ISME J. 2010;5:918–928. doi: 10.1038/ismej.2010.180. [DOI] [PMC free article] [PubMed] [Google Scholar]
- 32.Diaz NN, Krause L, Goesmann A, Niehaus K, Nattkemper TW. Tacoa – taxonomic classification of environmental genomic fragments using a kernelized nearest neighbor approach. BMC Bioinf. 2009;10:56. doi: 10.1186/1471-2105-10-56. [DOI] [PMC free article] [PubMed] [Google Scholar]
- 33.Rand WM. Objective criteria for the evaluation of clustering methods. J. Am. Stat. Assoc. 1971;66:846–850. [Google Scholar]
- 34.Noguchi H, Park J, Takagi T. Metagene: prokaryotic gene finding from environmental genome shotgun sequences. Nucleic Acids Res. 2006;34:5623–5630. doi: 10.1093/nar/gkl723. [DOI] [PMC free article] [PubMed] [Google Scholar]
- 35.Huson DH, Auch AF, Qi J, Schuster SC. MEGAN analysis of metagenomic data. Genome Res. 2007;17:377–386. doi: 10.1101/gr.5969107. [DOI] [PMC free article] [PubMed] [Google Scholar]
- 36.Alegado RA, Ferriera S, Nusbaum C, Young SK, Zeng Q, Imamovic A, Fairclough SR, King N. Complete genome sequence of algoriphagus sp. pr1, bacterial prey of a colony-forming choanoflagellate. J. Bacteriol. 2010;193:1485–1486. doi: 10.1128/JB.01421-10. [DOI] [PMC free article] [PubMed] [Google Scholar]
- 37.Nealson KH. Sediment bacteria: Who's there, what are they doing, and what's new? Annu. Rev. Earth Planet. Sci. 1997;25:403–434. doi: 10.1146/annurev.earth.25.1.403. [DOI] [PubMed] [Google Scholar]
- 38.Lovely DR, Phillips EJP, Lonergan DJ, Widman PK. Fe(iii) and so reduction by pelobacter carbinolicus. Appl. Envir. Microbiol. 1995;61:2132–2138. doi: 10.1128/aem.61.6.2132-2138.1995. [DOI] [PMC free article] [PubMed] [Google Scholar]
- 39.Huu NB, Denner DTC, Ha EBM, Wanner G, Stan-Lotter H. Marinobacter aquaeolei sp. nov., a halophilic bacterium isolated from a vietnamese oil producing well. lnt. J. Syst. Bacteriol. 1999;49:367–375. doi: 10.1099/00207713-49-2-367. [DOI] [PubMed] [Google Scholar]
- 40.Singer E, Webb EA, Nelson WC, Heidelberg JF, Ivanova N, Pati A, Edwards KJ. Genomic potential of marinobacter aquaeolei, a biogeochemical “opportunitroph”. Appl. Environ. Microbiol. 2011;77:2763–2771. doi: 10.1128/AEM.01866-10. [DOI] [PMC free article] [PubMed] [Google Scholar]
- 41.Wommack KE, Bhavsar J, Ravel J. Metagenomics: Read length matters. Appl. Environ. Microbiol. 2008;74:1453–1463. doi: 10.1128/AEM.02181-07. [DOI] [PMC free article] [PubMed] [Google Scholar]
- 42.DeLong EF, Preston CM, Mincer T, Rich V, Hallam SJ, Frigaard N-U, Martinez A, Sullivan MB, Edwards R, Brito BR, et al. Community genomics among stratified microbial assemblages in the ocean's interior. Science. 2006;311:496–503. doi: 10.1126/science.1120250. [DOI] [PubMed] [Google Scholar]
- 43.Cole JR, Wang Q, Cardenas E, Fish J, Chai B, Farris J, Kulam-Syed-Mohideen AS, McGarrell DM, Marsh T, Garrity GM, et al. The Ribosomal Database Project: improved alignments and new tools for rRNA analysis. Nucleic Acids Res. 2008;37:141–145. doi: 10.1093/nar/gkn879. [DOI] [PMC free article] [PubMed] [Google Scholar]
Associated Data
This section collects any data citations, data availability statements, or supplementary materials included in this article.