

Abstract
Non-technical summary
Retina is the first neural station of the visual system, and visual images falling onto the retina are encoded and processed by three layers of neurons. Amacyine cells are a major class of third-order retinal neurons that serve important visual functions, including shape recognition, motion detection and directional selectivity. Here we show for the first time a systematic examination of light-evoked electrical responses, cell morphology and relative rod/cone inputs of the narrow-field amacrine cells in the mouse retina. Results from this study provide a functional description of how retinal neurons are interconnected and how visual information is processed in the retinal synaptic network.
Abstract
Light-evoked responses of 106 morphologically identified narrow-field amacrine cells (ACs) were studied in dark-adapted mouse retinal slices. Forty-five cells exhibit AIIAC morphology, 55% of which show characteristic AIIAC physiological properties (AIIAC1s) and the remaining 45% display different physiological responses, suggesting that AIIACs are functionally heterogeneous. Moreover, we found that 42 cells exhibit morphology that resembles the seven morphological types of glycine-positive ACs (GlyAC1–7) reported in the rat retina, and for the first time assigned light response and function properties to these morphological types of glycinergic ACs in the mouse retina. In addition, five narrow-field ACs exhibited morphology resembling that of the GlyAC5 or GlyAC7 but with different physiological responses (GlyAC5# and GlyAC7#). Therefore, the eight morphological types of narrow-field ACs exhibit 12 classes of physiological responses. Furthermore, we found ACs whose physiological responses were indistinguishable from those of GlyAC3 or GlyAC4s but with different morphology (GlyAC3* or GlyAC4*). These observations suggest that although the majority of narrow-field mammalian ACs forms discrete functional groups that correlate with their morphology, a significant number of these cells with similar morphology do not display the same light responses, and some with similar light responses do not exhibit the same morphology.
Introduction
Amacrine cells (ACs) are the primary interneurons in the inner retina. They receive excitatory synaptic inputs from bipolar cells and inhibitory inputs from other ACs (Dowling, 1987), and make output synapses on bipolar cell (BC) axon terminals (feedback synapses), ganglion cell (GC) dendrites (feedforward synapses), and adjacent ACs (lateral synapses) (Dowling & Werblin, 1969; Wong-Riley, 1974). These AC input and output synapses form a complex neural network for processing complex vision tasks, such as constituting the BC and GC surround responses (Werblin & Dowling, 1969), converting sustained BC responses into transient AC and GC responses (Maguire et al. 1989), and mediating motion detection and direction selectivity in the retina (Werblin, 1972; Fried et al. 2002; Zhou & Lee, 2008). Moreover, ACs play crucial roles in segregating rod and cone signalling pathways (Pang et al. 2007) and in crossing over ON and OFF channels in the inner retina (Molnar & Werblin, 2007; Werblin, 2010).
Large-scale and multi-species anatomical studies have shown that ACs exhibit extreme morphological diversity (Masland, 2001b). It has been shown, for example, that there are 22 types of ACs with different dendritic width, shape and levels of stratification in the inner plexiform layer (IPL) of the rabbit retina (MacNeil & Masland, 1998; Masland, 2001a), and more than 20 morphologically distinguishable types of ACs in the salamander (Pang et al. 2002b). More than 20 morphological types of ACs have been proposed to exist in most mammals, including the rodents and primates (Kolb et al. 1981; Masland, 2001b).
The mouse retina has become the preferred preparation in recent years for studying mammalian retinal synaptic circuitry, because DNA probes and molecular markers, such as antibodies against neurotransmitters and their receptors, are available for the mouse/rat nervous systems (Menger et al. 1998; Siegert et al. 2009; Wassle et al. 2009), and many synaptic protein- or pathway-specific transgenic/knockout mouse strains have been generated (Calvert et al. 2000; Deans et al. 2002; Bramblett et al. 2004). These provide tremendous advantages in morphological/neurochemical cell classifications as well as functional analysis of retinal synapses. For example, 16 morphological types of wide-field ACs have been identified with a transgenic GFP-M mouse strain (Lin & Masland, 2006), and two types of catecholaminergic ACs have been selectively labelled with GFP and fluorescent probes (Contini et al. 2010). Moreover, by using microelectrode dye filling in conjunction with immunocytochemistry, eight morphological types of narrow field, glycine immuno-positive ACs have been identified in the rat retina (Menger et al. 1998). These cells include ACs with morphology resembling the AII amacrine cells (AIIACs) and seven other morphologically distinguishable types (GlyAC1–7).
Despite detailed morphological characterization of retinal ACs, the physiological function of these cells has not been systematically studied. It is not clear, for example, whether ACs with the same or similar morphology exhibit the same or similar light responses, and whether ACs’ physiological responses correlate with their morphological classification. In this report, we examined light response characteristics of over 100 morphologically identified narrow-field ACs in dark-adapted mouse retinal slices. We limited our study to narrow-field ACs because these cells are the most frequently encountered ACs with complete or near-complete dye filling in living retinal slices (about 200 μm thick; Wu, 1987; Pang et al. 2004a). We did record from a number of ACs with medium-field (125–400 μm) or wide-field (>400 μm) dendrites (MacNeil & Masland, 1998), but there were not enough of each type to make clear type distinctions. Moreover, we are less certain about the morphology of these cells’ dendrites as they may not be completely dye-filled in retinal slices.
We studied light-evoked current responses of narrow-field ACs under voltage clamped conditions at various holding potentials so that excitatory and inhibitory synaptic inputs could be separated. AC morphology was revealed by Lucifer yellow fluorescence and their morphological types were determined by comparing with the morphology of various types of rodent narrow-field ACs, such as the AIIACs and GlyAC1–7 (Menger et al. 1998; Pang et al. 2007). Moreover, we estimated the relative rod/cone inputs to various types of ACs by comparing the thresholds and dynamic ranges of AC responses to 500 nm light steps with the corresponding parameters of dark-adapted mouse rods, M-cones and S-cones (Lyubarsky et al. 1999; Pang et al. 2010).
Methods
Preparations and light stimulation
The mouse strain used in this study was C57Black6J from Jackson Laboratory (Bar Harbor, ME, USA). All animals were handled in accordance with Baylor College of Medicine's policies on the treatment of laboratory animals. Mice were dark-adapted for 1–2 h prior to the experiment. To maintain the retina in the fully dark-adapted state, all further procedures were performed under infrared illumination with dual-unit Nitemare (BE Meyers, Redmond, WA, USA) infrared scopes. Animals were killed by a lethal injection of ketamine–xylazine–acepromazine (0.1 ml, 100 mg ml−1) and the eyes were immediately enucleated and placed in oxygenated Ames’ medium (Sigma-Aldrich, St Louis, MO, USA) at room temperature. Dissection and preparation of living retinal slices followed essentially the procedures described in previous publications (Werblin, 1978; Wu, 1987). Oxygenated Ames’ solution (adjusted at pH 7.2) was introduced continuously to the recording chamber, and the medium was maintained at 35°C by a temperature control unit (TC 324B, Warner Instruments, Hamden, CT, USA). Pharmacological agents, such as 6,7-dinitroquinoxaline-2,3-dione (DNQX), were dissolved in Ames’ medium.
A photostimulator was used to deliver light spots (of diameter 600–1200 μm) to the retina via the epi-illuminator of the microscope. The intensity of unattenuated (log I = 0) 500 nm light was 1.4 × 10⁶ photons μm−2 s−1. The number of photoisomerizations per rod per second (Rh* rod−1s−1) was estimated by methods in a previous publication (Pang et al. 2002a, 2007). The peak amplitude of light-evoked current responses was plotted against light stimulus intensity, and data points were fitted to the Hill equation:
 |
where R is the current response amplitude, Rmax is the maximum response amplitude, σ is the light intensity that elicits a half-maximal response, N is the Hill coefficient, tanh is the hyperbolic tangent function and log is the logarithmic function of base 10. In this study, we used the R–log I plot for our analysis (the right-hand term of the above equation), and for such plots the light intensity span (dynamic range (DR): range of intensity that elicits responses between 5 and 95% of Rmax) of a cell is 2.56/N (Thibos & Werblin, 1978). We define response threshold as the intensity of light that elicits 5% of Rmax.
Since we delivered un-collimated stimulus light beam through an objective lens with large numerical aperture (Zeiss 40×/0.75 water), the incident light enters the retinal slice in many directions, and thus the effect of photoreceptor self-screening is minor (Field & Rieke, 2002).
Voltage-clamp recordings
Voltage-clamp recordings were made with an Axopatch 700B amplifier connected to a DigiData 1200 interface and pCLAMP 12 software (Axon Instruments, Union City, CA, USA). Whole cell voltage clamp recordings were made with patch electrodes made with Narishige or Sutter patch electrode pullers that were of 5–7 MΩ tip resistance when filled with internal solution containing 118 mm caesium methanesulfonate, 10 mm CsCl, 5 mm EGTA, 0.5 mm CaCl2, 1.0 mm MgCl2, 4 mm ATP, 0.3 mm GTP, 10 mm Tris, 0.8 mm Lucifer yellow, adjusted to pH 7.2 with CsOH. The chloride equilibrium potential, ECl, with this internal solution was about −60 mV. Estimates of the liquid junction potential at the tip of the patch electrode prior to seal formation varied from −9.2 to −9.6 mV. For simplicity, we corrected all holding potentials by −10 mV. Spontaneous excitatory and inhibitory postsynaptic currents events (sEPSCs and sIPSCs) were analysed with in-house software and SigmaPlot (Systat Software Inc., San Jose, CA, USA), and individual sEPSCs (recorded at ECl) and sIPSCs (recorded at EC) were detected by the computer with a threshold 5 pA from the centre of the baseline noise with monophasic rise phase (time-to-peak <10 ms) and exponential decays. For events with multiple peaks, subsequent peaks were counted as separate events only if the preceding peak had returned for >50% from its peak and the subsequent peak was >10 pA with a rise time <10 ms (Gao & Wu, 1998).
Visualization of cell morphology
Each cell was filled with Lucifer yellow (by diffusion) during physiological recordings, and patch electrodes were gently pulled away from the cell somas after recordings under visual control (Pang et al. 2004b, 2010). Cell morphology was visualized in retinal slices via Lucifer yellow fluorescence with a confocal microscope (Zeiss 510). Images were acquired with a ×40 water immersion objective (NA = 1.20), using the 458 nm excitation line of an argon laser, and a long pass 505 nm emission filter. Consecutive optical sections were superimposed to form a single image using the Zeiss LSM-PC software, and these compressed image stacks were further processed in Adobe Photoshop 6.0 to improve the signal to noise ratio. Since signal intensity values were typically enhanced during processing to improve visibility of smaller processes, the cell bodies and larger processes of some cells appear saturated due to their larger volume of fluorophore. The level at which dendritic processes stratified in the IPL was characterized in retinal vertical sections by the distance from the processes to the distal margin (0%) of the IPL.
Results
AII amacrine cells exhibit three classes of physiological responses
We found that ACs with AIIAC morphology (thick lobular dendrites in the distal 40% and arboreal dendrites in the proximal 60–70% of the IPL, and with dendritic width less than 50 μm (Menger et al. 1998; Pang et al. 2007) in retinal slices exhibited three classes of physiological responses. Among the 45 AIIACs we recorded from, 25 exhibited standard AIIAC physiological properties, such as a response threshold near −9, or 0.0007 R* rod−1 s−1, response dynamic range >4.0 log units, light-evoked current response (ΔI) not reversing under voltage clamp (due to extensive cell–cell coupling), and residual ΔI in the presence of DNQX (due to dual glutamatergic and electrical synaptic inputs) (Trexler et al. 2005; Pang et al. 2007). The remaining 20 AIIACs exhibited higher response thresholds (between −8 and −7, or 0.07–0.007 R* rod−1 s−1) and narrower dynamic range (<3.0 log units), and their ΔI reversed near 0 mV (indicative of weak cell–cell coupling) and was completely suppressed by DNQX (indicative of sole glutamatergic input). These AIIACs could be further divided into two classes in accordance with their physiological properties. Figure 1 shows an AIIAC with standard (class 1) responses (AIIAC1, left column), an AIIAC with class 2 responses (AIIAC2, middle column) and an AIIAC with class 3 responses (ACAII3, right column). Figure 1A shows stacked confocal Lucifer yellow fluorescence images of the three AIIACs, and Fig. 1B shows light-evoked current responses (ΔI) to 2.5 s light steps (500 nm, −3.0, or 700 R* rod−1 s−1, lower panels) at various holding potentials. The AIIAC1 (left column) exhibited few spontaneous excitatory postsynaptic currents (sEPSCs) and some spontaneous inhibitory postsynaptic currents (sIPSCs), and the light-evoked sustained inward current did not reverse within the voltage range tested (–100 to +40 mV). The AIIAC2 exhibited many large sEPSCs and no sIPSCs, whereas the AIIAC3 exhibited some smaller sEPSCs and some sIPSCs. The light-evoked transient inward current (and sEPSCs) in the AIIAC2 and AIIAC3 reversed near 0 mV, with the AIIAC2 displaying no light-evoked chloride current ΔICl (at EC= 0 mV) and the AIIAC3 exhibiting transient ON and OFF ΔICl. Among the 20 AIIACs with non-standard physiological responses, 12 exhibited responses similar to the AIIAC2, and eight exhibited responses similar to the AIIAC3 in Fig. 1. Figure 1C shows the cation current responses (ΔIC) of the three ACs to 500 nm, 2.5 s light steps of increasing intensities at holding potential −60 mV in control medium, in 100 μm DNQX and after wash.
Figure 1. Three physiological classes of AII amacrine cells (AIIAC1–3).

A, stacked confocal Lucifer yellow fluorescence images of an AIIAC1 (left column), an AIIAC2 (middle column) and an AIIAC3 (right column) in living retinal slices. INL, inner nuclear layer; IPL, inner plexiform layer; calibration bar, 20 μm. B, light-evoked current responses to 2.5 s light steps (500 nm, −3.0 (3.0 log unit attenuation)) at various holding potentials (VH). C, Light-evoked current responses to 2.5 s, 500 nm light steps of various intensities (log unit attenuation) in normal Ringer solution (control), in the presence of 100 μm DNQX, and after wash in normal saline (wash). Grey arrows in the left column: residual light responses in DNQX.
The average (mean ± SD) response–light intensity (ΔIC–log I) relation of the 25 AIIAC1s in control medium is shown in Fig. 2A, which gives an average response threshold of −8.7 ± 0.46 (0.0011 R* rod−1 s−1) and an average dynamic range of 4.45 ± 0.43. The average dynamic range (DR) is represented by a red horizontal bar, which is re-plotted in Fig. 2B along with the average dynamic ranges of the rod, M-cone and other narrow-field ACs (see below). The rod and M-cone DRs were derived from the photocurrents recorded with suction electrodes in dark-adapted mouse retinal slices, and the rod photocurrent was about 2 log units more sensitive to the 500 nm light step than the M-cone photocurrent (Lyubarsky et al. 1999; Pang et al. 2010). From similar average ΔIC–log I plots of the 12 AIIAC2s and eight AIIAC3s, we found the average response thresholds were −7.7 ± 1.31 and −7.0 ± 0.92, and the average dynamic ranges were 2.05 ± 0.82 and 2.58 ± 1.02, respectively. The average ΔIC thresholds, dynamic ranges, ΔIC and ΔICl waveforms of AIIAC1s, AIIAC2s and AIIAC3s are listed in Table 1, and the average frequencies of the sEPSC and sIPSC are shown in Fig. 4A. These physiological parameters were consistent among cells within each of the three AIIAC classes. Additionally, the dynamic ranges of the AIIAC2s and AIIAC3s are plotted as green horizontal bars in Fig. 2B. By comparing the dynamic ranges of AIIAC1s, AIIAC2s and AIIAC3s with those of dark-adapted rods and M-cones, Fig. 2B suggests that AIIAC1s receive inputs from both rod- and M-cone-driven bipolar cells, whereas AIIAC2s receive inputs primarily from rod bipolar cells, and AIIAC3s receive inputs mainly from M-cone-driven bipolar cells with minor rod bipolar cell inputs (see Discussion below).
Figure 2. Response–intensity relations and dynamic ranges of narrow-field amacrine cells.

A, normalized response–intensity relations of AIIAC1s, and the dynamic range (DR: the light intensity range from threshold (5% of the maximum response) to saturation (95% of the maximum response)) are illustrated by a red horizontal line. B, average DRs of the rod and M-cone photocurrents, and of the ΔIC of various types of narrow field ACs in response to 500 nm light stimuli in dark-adapted mouse retinas. Continuous red lines: average DRs for photocurrents and ΔIC of AIIAC1s and GlyAC-1–7. Continuous green lines: average DR for AIIAC2–3s, and dashed green lines: DRs for GlyAC3*, GlyAC4*, GlyAC5# and GlyAC7# (see Figs 1 and 3 and for statistical values see Table 1).
Table 1.
Summary of response parameters of the 14 physiological classes of narrow-field ACs
| Physiological class | n | ΔIC threshold | ΔIC DR | ΔIC waveform | ΔICl waveform |
|---|---|---|---|---|---|
| AIIAC1 | 25 | −8.7 ± 0.46 | 4.15 ± 0.43 | sONin | — |
| AIIAC2 | 12 | −7.7 ± 1.31 | 2.05 ± 0.82 | tONin | 0 |
| AIIAC3 | 8 | −7.0 ± 0.92 | 2.58 ± 1.02 | sONin | tON/OFFout |
| GlyAC1 | 3 | −7.36 ± 0.78 | 3.43 ± 0.38 | sONout | sONout |
| GlyAC2 | 4 | −2.9 ± 0.65 | 2.05 ± 0.22 | sONout/tOFFin | tONout |
| GlyAC3 | 4 | −6.0 ± 0.31 | 2.80 ± 0.32 | sONin | 0 |
| GlyAC3* | 1 | −5.9 | 2.51 | sONin | 0 |
| GlyAC4 | 8 | −7.7 ± 0.49 | 3.80 ± 0.28 | sONin | tOFFout |
| GlyAC4* | 2 | −7.80; −7.53 | 4.02; 3.67 | sONin | tOFFout |
| GlyAC5 | 10 | −7.5 ± 0.22 | 3.02 ± 0.31 | tONin | tONout |
| GlyAC5# | 2 | −6.7; −5.2 | 3.92; 3.66 | sONin | tON/OFFout |
| GlyAC6 | 4 | −6.58 ± 0.77 | 2.81 ± 0.62 | sONout | sON/OFFout |
| GlyAC7 | 9 | −7.75 ± 0.43 | 2.31 ± 0.29 | sONin | sONout |
| GlyAC7# | 3 | −4.7; −5.6; −6.9 | 1.1; 2.1; 1.6 | tOFFin | tOFFout |
n: number of cells; ΔIC threshold: average (mean ± SD) intensity of 500 nm light steps (in log units of attenuation) that generates 5% of the maximum cation current response; ΔIC DR: average (mean ± SD) dynamic range (the light intensity range from threshold (5% of the maximum response) to saturation (95% of the maximum response)) of the 500 nm light-elicited cation currents. ΔIC waveform: s, sustained; t, transient, ON, response at light onset; OFF, response at light offset; in, inward current; out, outward current (sONin and tONin indicate ON ACs, and sONout and tOFFin indicate OFF ACs); ΔICl waveform: — signifies ΔICl does not exist (light response does not reverse due to strong cell-cell coupling); 0 signifies light response reverses but ΔICl is zero; other symbols are the same as in ΔIC waveform.
Figure 4. Spontaneous excitatory and inhibitory postsynaptic currents (sEPSCs and sIPSCs) and effects of DNQX of narrow field amacrine cells.
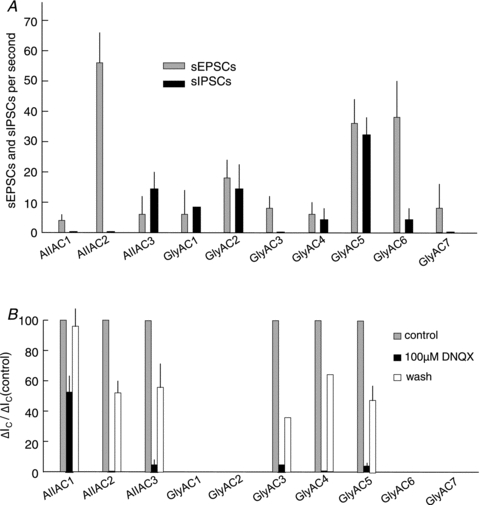
A, average number of sEPSCs (grey vertical bars) and sIPSCs (black vertical bars) per second of AIIAC1–3 and GlyAC1–7. Thin vertical lines are standard deviations and the numbers of cells are given in Table 1. B, average light-evoked cation current (ΔIC) in control conditions (grey bars, normalized to 100%), in the presence of 100 μm DNQX (black bars) and after wash (white bars). The numbers of cells (n) are: 15, 8, 6, 1, 2 and 3 for AIIAC1–3 and GlyAC3–5 respectively, and thin vertical lines are standard deviations (excluding GlyAC3–4 because of low n).
DNQX at 100 μm reduced (not completely blocked) ΔIC in the AIIAC1, and it almost completely suppressed ΔIC in the AIIAC2 and AIIAC3 (Fig. 1C); the average suppressive actions of DNQX is given in Fig. 4B. These results suggest that part of the excitatory (depolarizing bipolar cell, DBC) inputs to the AIIAC1 and all excitatory (DBC) inputs to the AIIAC2–3s are mediated by AMPA/kainate chemical synapses. Previous studies suggest that AIIACs receive light-evoked inputs from two types of DBCs, one from DBCRs, which make AMPA/kainate glutamatergic synapses on AIIACs, and the other from DBCCs, which are connected to AIIACs via gap junctions (Trexler et al. 2005; Pang et al. 2007). The AIIAC1 responses in Fig. 1C agree with such a parallel DBCR/DBCC input scheme, whereas the AIIAC2–3s do not. This indicates that ΔIC in the latter cells are completely mediated by chemical synaptic inputs (AMPA/kainate glutamatergic) from DBCRs/DBCCs, not by any DNQX-resistant, electrical synaptic inputs from DBCCs. The observation that ΔI in AIIAC2–3s reverse near 0 mV (where the AIIAC1 does not) also supports the idea that AIIAC2–3s are not significantly coupled with other cells (unlike the strong coupling between adjacent AIIAC1s and between DBCCs and AIIACs; Veruki & Hartveit, 2002a,b).
It is worth noting that in five cases, an AIIAC1 and an AIIAC2 (or AIIAC3) were recorded from the same retinal slices (AIIAC2/AIIAC3 preceded AIIAC1 in three cases and AIIAC1 preceded AIIAC2/AIIAC3 in two cases). In two other cases, an AIIAC2 and an AIIAC3 were recorded from the same retinal slices, and in one case all three (AIIAC1–3) were recorded from the same retinal slice. These results suggest that the three heterogeneous AIIAC responses can be recorded under the same conditions.
Narrow field ACs with morphology resembling glycinergic AC 1–7
In addition to the 45 AIIACs, we also recorded light-evoked responses from 42 narrow field ACs (dendritic tree width <125 μm; MacNeil & Masland, 1998) whose morphology differed from that of the AIIACs, but resembled the remaining seven types of glycinergic ACs (GlyAC1–7, cells with AIIAC morphology were named GlyAC8) reported in a previous rat retina study (Menger et al. 1998). We employed the same morphological criteria as the rat study for cell type identification: GlyAC1s have dendrites ramifying within the distal 40% of the IPL; GlyAC2s have dendrites ramifying within the distal 50–60% of the IPL; GlyAC3s have dendrites ramifying between 30–40% and 80% of the IPL (0%: distal margin of the IPL); GlyAC4s have dendrites ramifying between 40% and 100%; GlyAC5s have dendrites ramifying between 0% and 90%; GlyAC6s have wider (50–100 μm) dendrites ramifying between 0% and 95%; and GlyAC7s have dendrites ramifying between 0% and 95% of the IPL (Menger et al. 1998). Figure 3 shows one example of each of the seven types of GlyACs. Figure 3A shows stacked confocal Lucifer yellow fluorescence images, and Fig. 3B shows light-evoked current responses (ΔI) to 2.5 s light steps (500 nm, −4.0 for GlyAC1 and 3–7, and −2 for GlyAC2) at various holding potentials. The morphology and response waveform of ACs within each type were similar, and the average ΔIC dynamic ranges of the seven types of ACs are given in Fig. 2B. From results illustrated in Fig. 3B, GlyAC1s are sustained hyperpolarizing cells, as the 2.5 s light step elicited a sustained outward current response (ΔIC waveform: sONout, Table 1 column 5) near the dark membrane potential (or zero current potential in voltage clamp: about −65 mV). By using the same logic, GlyAC2s are sustained hyperpolarizing cells with a large transient depolarizing overshoot at the light step offset, GlyAC3s are transient depolarizing cells, GlyAC4s are sustained depolarizing cells, GlyAC5s and GlyAC6s are both sustained hyperpolarizing cells with transient depolarizing overshoot responses at light offset, and GlyAC7s are sustained depolarizing cells. The numbers of ACs with morphology resembling GlyAC types 1–7 and light responses described above were 3, 4, 4, 8, 10, 4 and 9, respectively. The average ΔIC thresholds, dynamic ranges, ΔIC and ΔICl waveforms of GlyAC1–7 are listed in Table 1, and the average frequencies of the sEPSC and sIPSC as well as the suppressive actions of DNQX on GlyAC3–5 are shown in Fig. 4. (Note, we examined the effects of DNQX only on ACs that we thought to be AIIAC1–3s based solely on the response waveform during the initial phase of recordings, and thus we excluded cells with GlyAC1–3 and 7 response waveforms. Subsequent physiological and morphological examinations showed that one of these cells was GlyAC3, two were GlyAC4s and 3 were GlyAC5s.) These physiological parameters were largely consistent among cells within the same morphological type. By comparing the dynamic ranges of 500 nm-light-elicited ΔICs with the response dynamic ranges of rods and M-cones in Fig. 2B, GlyAC1s, -4s and -5s appear to receive substantial inputs from rod-driven bipolar cells, whereas GlyAC3s and -6s receive less rod-mediated inputs. These cells may also receive inputs from M-cone-driven bipolar cells to varying degrees. GlyAC2s, however, stand out as they appear to receive input mainly from bipolar cells driven by photoreceptors that are less sensitive to 500 nm light steps than the M-cones. Since the S-cone pigment is much less sensitive to 500 nm lights than the M-cone pigment (Lyubarsky et al. 1999), it is reasonable to conclude that GlyAC2s receive inputs from bipolar cells driven by cones with mixed M-cone and S-cone pigments (Applebury et al. 2000).
Figure 3. Narrow field amacrine cells with non-AIIAC morphology.

A, stacked confocal Lucifer yellow fluorescent images of 7 ACs whose morphology resembles that of types 1–7 of glycinergic ACs in the rat retina (Menger et al. 1998) (GlyAC1–7) in living retinal slices. INL, inner nuclear layer; IPL, inner plexiform layer; calibration bar, 20 μm. B, light-evoked current responses to 2.5 s light steps (500 nm, −4 or −2) of the 7 ACs in A at various holding potentials. C, stacked confocal Lucifer yellow fluorescence images of 2 ACs whose light responses resemble the responses of GlyAC3s (GlyAC3*) and GlyAC4s (GlyAC4*), and 2 ACs whose morphology resembles that of the GlyAC5 (GlyAC5#) and GlyAC7 (GlyAC7#). INL, inner nuclear layer; IPL, inner plexiform layer; calibration bar, 20 μm. D, light-evoked current responses to 2.5 s light steps (500 nm, −4 or −2) of the 4 ACs in C at various holding potentials.
In addition to the 42 narrow field ACs exhibiting GlyAC1–7 morphology and characteristic light responses described above, we found five ‘outliers’: two with GlyAC5 morphology but with light responses that significantly differ from the responses of the GlyAC5s, and three with GlyAC7 morphology but with light responses that are of very different waveform and sensitivity. An example of each of these two groups is shown in the third and fourth columns of Fig. 3C and D (GlyAC5# and GlyAC7#), and their ΔIC thresholds, dynamic ranges, ΔIC and ΔICl waveforms are also listed in Table 1.
Narrow field ACs with morphology that does not resemble AIIACs or GlyAC1–7
We also recorded 14 narrow-field ACs whose morphology did not resemble either AIIACs or GlyAC1–7s. Among these cells, one exhibited light responses (ΔIC and ΔICl waveforms, sensitivity and dynamic ranges, and sEPSC/sIPSC levels) that are indistinguishable from the responses of GlyAC3s, and thus we named it GlyAC3* (first column of Fig. 3C and D). Two of these ACs exhibited light responses that were indistinguishable from the responses of GlyAC5s, and we named them GlyAC5*s (one is shown in the second column of Fig. 3C and D). The ΔIC thresholds, dynamic ranges, ΔIC and ΔICl waveforms of these two ACs are also listed in Table 1. The remaining 11 narrow field ACs exhibited morphology and light responses that were significantly different from those of AIIAC1–3s and GlyAC1–7s (not shown).
Discussion
Eight major types of narrow field ACs in dark-adapted mouse retina exhibit twelve classes of physiological responses: implications of heterogeneous synaptic circuitry
In this study, we examined physiological responses of 106 morphologically identified narrow-field ACs in dark-adapted mouse retinal slices. Among these cells, 45 exhibited AIIAC morphology (thus by definition they are AIIACs), 25 of which showed standard AIIAC physiological properties (AIIAC1s) and the remaining 20 displayed different physiological responses (AIIAC2s (n = 12) and AIIAC3s (n = 8)). Moreover, 42 cells exhibited morphology that resembles the seven morphological types of glycine-positive ACs (GlyAC1–7) described in the rat retina (Menger et al. 1998). In addition, five narrow-field ACs were found to have morphology resembling that of the GlyAC5 or GlyAC7 but with different physiological responses (GlyAC5# and GlyAC7#). Therefore, the eight morphological types of narrow-field ACs exhibit 12 classes of physiological responses. From response parameters shown in Table 1 and Figs 2 and 4, it is evident that the physiological properties are consistent within each physiological class (e.g. standard deviations of response thresholds and dynamic ranges are largely less than 20%, and the response waveforms and the average sEPSC/sIPSC frequencies and suppressive effects of DNQX are consistent within each class and significantly differ from one class to another). This suggests that the various physiological classes represent discrete and distinct functional groups of narrow-field ACs in dark-adapted mouse retina.
Our observation that two or three classes of AIIAC responses could be recorded from the same retinal slices suggests that heterogeneous AIIAC responses are not due to different recording conditions, but rather to variations in synaptic connectivity and function. AIIAC2s and AIIAC3s may have weaker/fewer gap-junction contacts with other AIIACs and DBCCs, and thus ΔIC in these cells is blocked by DNQX and reverses at 0 mV. Since AIIAC1s and AIIAC2-3s have been recorded from the same retinal slices at the same depth, it is unlikely that the lack of gap-junction inputs in AIIAC2/3s is due to slicing damage. Additionally, AIIAC2s may receive chemical synaptic inputs mainly from DBCRs whereas AIIAC3s receive chemical synaptic inputs primarily from DBCCs, as suggested by their average ΔIC thresholds, dynamic ranges and waveforms (Fig. 1 and Table 1). Therefore AIIACs with AIIAC1 responses receive chemical synaptic inputs from DBCRs and electrical synaptic inputs from DBCCs, and they are strongly coupled with other AIIACs (Veruki & Hartveit, 2002a). These AIIACs exhibit high light sensitivity and wide dynamic range, and serve as a high-gain hub for rod-mediated signals in the inner retina (Pang et al. 2004a). AIIACs with AIIAC2/3 responses receive inputs primarily via chemical synapses from DBCRs and DBCCs, and they exhibit lower light sensitivity, narrower dynamic ranges and lower gain (an earlier study has shown AIIAC responses with narrow dynamic ranges in mice (Dunn et al. 2006)). Evidence has suggested that AIIACs make glycinergic synapses on the bipolar cell axon terminals and ganglion cell dendrites (Strettoi et al. 1992), and whether AIIACs with different physiological responses make output synapses on the same/different bipolar/ganglion cells remains as an important unresolved issue in retinal circuitry.
Similar to AIIACs, the five narrow-field ACs with morphology resembling GlyAC5s or GlyAC7s but different physiological responses (GlyAC5# or GlyAC7#) suggest that other types of narrow-field ACs may also have heterogeneous synaptic connections. For example, the dynamic ranges of GlyAC5s and GlyAC5#s suggest that the former cells receive inputs mainly from DBCRs and the latter from DBCCs, though these cells exhibit very similar morphology. Moreover, ΔIC of GlyAC7s are inward during light step whereas ΔIC of GlyAC7#s are transient inward at light offset, suggesting that the former is driven by DBCs (with depolarizing responses during light step) and the latter by HBCs (with transient depolarizing responses at light offset) (Pang et al. 2004b, 2010). In Fig. 3, we also show an AC whose physiological response is indistinguishable from that of GlyAC3s but with different morphology (GlyAC3*) and another AC whose light response is very similar to that of GlyAC4s but with different morphology (GlyAC4*). It is unclear whether the similarities in light responses imply similar synaptic inputs in these morphologically distinct ACs. Taking all together, our observations suggest that although the majority of narrow-field mammalian ACs forms discrete functional groups that correlate with their morphology, a significant number of these cells with similar morphology do not display the same light responses, and some cells with similar light responses do not exhibit the same morphology.
Light responses and relative rod/cone and DBC/HBC inputs of narrow field ACs
Table 1 summarizes physiological parameters of 14 classes of physiological responses (AIIAC1–3, GlyAC1–7, GlyAC5#7# and GlyAC3*4*) in eight types of narrow-field ACs. The parameters include the average response thresholds, dynamic ranges and response polarity/waveform of light-evoked cation currents (ΔIC, which represent the light-elicited bipolar cell inputs). AIIAC1–3s, GlyAC3–5 and 7, as well as GlyAC3*, GlyAC4* and GlyAC5#s have inward ΔIC, and therefore they are ON ACs. GlyAC1s exhibit sustained outward ΔIC, and they are sustained OFF ACs. GlyAC6 and GlyAC7#s display transient inward ΔIC at light offset, and thus they are transient OFF ACs. Moreover, by comparing ΔIC dynamic ranges of these ACs with those of the rods and cones (Fig. 2), it is reasonable to conclude that most of these narrow-field ACs receive inputs from rod- and M-cone-driven cells except for the two types of transient OFF cells: the GlyAC7#s receive inputs mainly from M-cone-driven bipolar cells and the GlyAC2s receive inputs from bipolar cells driven by cones with mixed M-cone and S-cone pigments. In Fig. 2B, response thresholds and dynamic ranges of the rod-driven ACs are more sensitive (shift to the left) than the corresponding values of the rod. This is because a given AC receives converging inputs from many rods. For example, anatomical studies have shown that each rod DBC receive inputs from about 20 rods and each AIIAC receives synaptic inputs from about six rod DBCs (Tsukamoto et al. 2001), and thus depending on how strongly AIIACs are coupled to each other, an AIIAC may receive inputs from 100–1000 rods (Pang et al. 2004a, 2007). Thus the response threshold of AIIACs can be 2–3 log units lower (left shift in Fig. 2B) than the response threshold of the rod. Similarly, the response thresholds of other ACs with rod and cone inputs are left-shifted for different amounts, depending on the degree of rod and cone convergence.
It is worth noting that GlyAC1–7 have been characterized morphologically (Menger et al. 1998), and this study demonstrates for the first time their light response properties. Although the morphology of some GlyAC1–7s does not perfectly resemble the morphology of the Menger et al.'s glycinergic cells 1–7 (in which morphological variations are observed), we believe that the two populations match because of the patterns and levels of dendritic ramification in the IPL. By using the same ΔIC dynamic range analysis, our previous studies have shown that several types of depolarizing bipolar cells (DBCs) exhibit rod-, M-cone-, or rod/M-cone-driven responses (Pang et al. 2004a, 2010). These DBCs (single type or combinations of various types) are likely to be the primary excitatory input neurons for AIIAC1–3s, GlyAC3–5 and 7, as well as GlyAC3*, GlyAC4* and GlyAC5#s. It has been shown that AIIACs receive excitatory inputs from rod DBCs (DBCRs) via glutamatergic synapses and the mixed rod/M-cone-driven cone DBCs (DBCC1s) via gap junctions (Trexler et al. 2005; Pang et al. 2007). These DBC inputs plus the fact that they are homocellularly coupled are the reasons why AIIAC1s have such high response sensitivity. It is uncertain what types of DBCs send input signals to AIIAC2-3, GlyAC3–5 and 7, GlyAC3*, GlyAC4* and GlyAC5#. The observation that they are significantly less sensitive suggests that they receive less DBCR inputs and are less electrically coupled with other cells (consistent with the results that these ACs exhibit a reversal potential near 0 mV; Figs 1 and 3). Our previous results have also shown that one type of alpha ganglion cells, the transient OFF cells (tOFFαGCs) exhibits response waveform and light sensitivity very similar to the GlyAC2s in this study (Pang et al. 2003). It is possible that the light-evoked excitatory inputs (ΔIC) of these two populations of third-order neurons are driven by the same type of transient OFF bipolar cells whose light responses are mediated by cones with mixed M-cone and S-cone pigments.
Acknowledgments
We thank David Simons, Cameron Cowan, Inyoung Chung and Roy Jacoby for critically reading this manuscript. This work was supported by grants from NIH (EY004446 and EY019908), NIH Vision Core (EY 02520), the Retina Research Foundation (Houston), and Research to Prevent Blindness, Inc.
Glossary
- AC
amacrine cell
- AIIACs
AII amacrine cells
- BC
bipolar cell
- GC
ganglion cell
- GlyACs
glycinergic amacrine cells
- INL
inner nuclear layer
- IPL
inner plexiform layer
Author contributions
J.P. conducted experiments, data analysis & designed experiments. F.G. conducted experiments. S.M.W. conducted data analysis, designed experiments and wrote the paper.
References
- Applebury ML, Antoch MP, Baxter LC, Chun LL, Falk JD, Farhangfar F, Kage K, Krzystolik MG, Lyass LA, Robbins JT. The murine cone photoreceptor: a single cone type expresses both S and M opsins with retinal spatial patterning. Neuron. 2000;27:513–523. doi: 10.1016/s0896-6273(00)00062-3. [DOI] [PubMed] [Google Scholar]
- Bramblett DE, Pennesi ME, Wu SM, Tsai MJ. The transcription factor Bhlhb4 is required for rod bipolar cell maturation. Neuron. 2004;43:779–793. doi: 10.1016/j.neuron.2004.08.032. [DOI] [PubMed] [Google Scholar]
- Calvert PD, Krasnoperova NV, Lyubarsky AL, Isayama T, Nicolo M, Kosaras B, Wong G, Gannon KS, Margolskee RF, Sidman RL, Pugh EN, Jr, Makino CL, Lem J. Phototransduction in transgenic mice after targeted deletion of the rod transducin α-subunit. Proc Natl Acad Sci U S A. 2000;97:13913–13918. doi: 10.1073/pnas.250478897. [DOI] [PMC free article] [PubMed] [Google Scholar]
- Contini M, Lin B, Kobayashi K, Okano H, Masland RH, Raviola E. Synaptic input of ON-bipolar cells onto the dopaminergic neurons of the mouse retina. J Comp Neurol. 2010;518:2035–2050. doi: 10.1002/cne.22320. [DOI] [PMC free article] [PubMed] [Google Scholar]
- Deans MR, Volgyi B, Goodenough DA, Bloomfield SA, Paul DL. Connexin36 is essential for transmission of rod-mediated visual signals in the mammalian retina. Neuron. 2002;36:703–712. doi: 10.1016/s0896-6273(02)01046-2. [DOI] [PMC free article] [PubMed] [Google Scholar]
- Dowling JE. The Retina, an Approachable Part of the Brain. Harvard University Press; 1987. [Google Scholar]
- Dowling JE, Werblin FS. Organization of retina of the mudpuppy, Necturus maculosus. I. Synaptic structure. J Neurophysiol. 1969;32:315–338. doi: 10.1152/jn.1969.32.3.315. [DOI] [PubMed] [Google Scholar]
- Dunn FA, Doan T, Sampath AP, Rieke F. Controlling the gain of rod-mediated signals in the mammalian retina. J Neurosci. 2006;26:3959–3970. doi: 10.1523/JNEUROSCI.5148-05.2006. [DOI] [PMC free article] [PubMed] [Google Scholar]
- Field GD, Rieke F. Mechanisms regulating variability of the single photon responses of mammalian rod photoreceptors. Neuron. 2002;35:733–747. doi: 10.1016/s0896-6273(02)00822-x. [DOI] [PubMed] [Google Scholar]
- Fried SI, Munch TA, Werblin FS. Mechanisms and circuitry underlying directional selectivity in the retina. Nature. 2002;420:411–414. doi: 10.1038/nature01179. [DOI] [PubMed] [Google Scholar]
- Gao F, Wu SM. Characterization of spontaneous inhibitory synaptic currents in salamander retinal ganglion cells. J Neurophysiol. 1998;80:1752–1764. doi: 10.1152/jn.1998.80.4.1752. [DOI] [PubMed] [Google Scholar]
- Kolb H, Nelson R, Mariani A. Amacrine cells, bipolar cells and ganglion cells of the cat retina: a Golgi study. Vision Res. 1981;21:1081–1114. doi: 10.1016/0042-6989(81)90013-4. [DOI] [PubMed] [Google Scholar]
- Lin B, Masland RH. Populations of wide-field amacrine cells in the mouse retina. J Comp Neurol. 2006;499:797–809. doi: 10.1002/cne.21126. [DOI] [PubMed] [Google Scholar]
- Lyubarsky AL, Falsini B, Pennesi ME, Valentini P, Pugh EN., Jr UV- and midwave-sensitive cone-driven retinal responses of the mouse: a possible phenotype for coexpression of cone photopigments. J Neurosci. 1999;19:442–455. doi: 10.1523/JNEUROSCI.19-01-00442.1999. [DOI] [PMC free article] [PubMed] [Google Scholar]
- MacNeil MA, Masland RH. Extreme diversity among amacrine cells: implications for function. Neuron. 1998;20:971–982. doi: 10.1016/s0896-6273(00)80478-x. [DOI] [PubMed] [Google Scholar]
- Maguire G, Lukasiewicz P, Werblin F. Amacrine cell interactions underlying the response to change in the tiger salamander retina. J Neurosci. 1989;9:726–735. doi: 10.1523/JNEUROSCI.09-02-00726.1989. [DOI] [PMC free article] [PubMed] [Google Scholar]
- Masland RH. Neuronal diversity in the retina. Curr Opin Neurobiol. 2001a;11:431–436. doi: 10.1016/s0959-4388(00)00230-0. [DOI] [PubMed] [Google Scholar]
- Masland RH. The fundamental plan of the retina. Nat Neurosci. 2001b;4:877–886. doi: 10.1038/nn0901-877. [DOI] [PubMed] [Google Scholar]
- Menger N, Pow DV, Wassle H. Glycinergic amacrine cells of the rat retina. J Comp Neurol. 1998;401:34–46. doi: 10.1002/(sici)1096-9861(19981109)401:1<34::aid-cne3>3.0.co;2-p. [DOI] [PubMed] [Google Scholar]
- Molnar A, Werblin F. Inhibitory feedback shapes bipolar cell responses in the rabbit retina. J Neurophysiol. 2007;98:3423–3435. doi: 10.1152/jn.00838.2007. [DOI] [PubMed] [Google Scholar]
- Pang JJ, Abd-El-Barr MM, Gao F, Bramblett DE, Paul DL, Wu SM. Relative contributions of rod and cone bipolar cell inputs to AII amacrine cell light responses in the mouse retina. J Physiol. 2007;580:397–410. doi: 10.1113/jphysiol.2006.120790. [DOI] [PMC free article] [PubMed] [Google Scholar]
- Pang JJ, Gao F, Lem J, Bramblett DE, Paul DL, Wu SM. Direct rod input to cone BCs and direct cone input to rod BCs challenge the traditional view of mammalian BC circuitry. Proc Natl Acad Sci U S A. 2010;107:395–400. doi: 10.1073/pnas.0907178107. [DOI] [PMC free article] [PubMed] [Google Scholar]
- Pang JJ, Gao F, Wu SM. Relative contributions of bipolar cell and amacrine cell inputs to light responses of ON, OFF and ON-OFF retinal ganglion cells. Vision Res. 2002a;42:19–27. doi: 10.1016/s0042-6989(01)00258-9. [DOI] [PubMed] [Google Scholar]
- Pang JJ, Gao F, Wu SM. Segregation and integration of visual channels: layer-by-layer computation of ON-OFF signals by amacrine cell dendrites. J Neurosci. 2002b;22:4693–4701. doi: 10.1523/JNEUROSCI.22-11-04693.2002. [DOI] [PMC free article] [PubMed] [Google Scholar]
- Pang JJ, Gao F, Wu SM. Light-evoked excitatory and inhibitory synaptic inputs to ON and OFF α ganglion cells in the mouse retina. J Neurosci. 2003;23:6063–6073. doi: 10.1523/JNEUROSCI.23-14-06063.2003. [DOI] [PMC free article] [PubMed] [Google Scholar]
- Pang JJ, Gao F, Wu SM. Light-evoked current responses in rod bipolar cells, cone depolarizing bipolar cells and AII amacrine cells in dark-adapted mouse retina. J Physiol. 2004a;559:123–135. doi: 10.1113/jphysiol.2003.059543. [DOI] [PMC free article] [PubMed] [Google Scholar]
- Pang JJ, Gao F, Wu SM. Stratum-by-stratum projection of light response attributes by retinal bipolar cells of Ambystoma. J Physiol. 2004b;558:249–262. doi: 10.1113/jphysiol.2004.063503. [DOI] [PMC free article] [PubMed] [Google Scholar]
- Siegert S, Scherf BG, Del Punta K, Didkovsky N, Heintz N, Roska B. Genetic address book for retinal cell types. Nat Neurosci. 2009;12:1197–1204. doi: 10.1038/nn.2370. [DOI] [PubMed] [Google Scholar]
- Strettoi E, Raviola E, Dacheux RF. Synaptic connections of the narrow-field, bistratified rod amacrine cell (AII) in the rabbit retina. J Comp Neurol. 1992;325:152–168. doi: 10.1002/cne.903250203. [DOI] [PubMed] [Google Scholar]
- Thibos LN, Werblin FS. The response properties of the steady antagonistic surround in the mudpuppy retina. J Physiol. 1978;278:79–99. doi: 10.1113/jphysiol.1978.sp012294. [DOI] [PMC free article] [PubMed] [Google Scholar]
- Trexler EB, Li W, Massey SC. Simultaneous contribution of two rod pathways to AII amacrine and cone bipolar cell light responses. J Neurophysiol. 2005;93:1476–1485. doi: 10.1152/jn.00597.2004. [DOI] [PubMed] [Google Scholar]
- Tsukamoto Y, Morigiwa K, Ueda M, Sterling P. Microcircuits for night vision in mouse retina. J Neurosci. 2001;21:8616–8623. doi: 10.1523/JNEUROSCI.21-21-08616.2001. [DOI] [PMC free article] [PubMed] [Google Scholar]
- Veruki ML, Hartveit E. AII (Rod) amacrine cells form a network of electrically coupled interneurons in the mammalian retina. Neuron. 2002a;33:935–946. doi: 10.1016/s0896-6273(02)00609-8. [DOI] [PubMed] [Google Scholar]
- Veruki ML, Hartveit E. Electrical synapses mediate signal transmission in the rod pathway of the mammalian retina. J Neurosci. 2002b;22:10558–10566. doi: 10.1523/JNEUROSCI.22-24-10558.2002. [DOI] [PMC free article] [PubMed] [Google Scholar]
- Wassle H, Puller C, Muller F, Haverkamp S. Cone contacts, mosaics, and territories of bipolar cells in the mouse retina. J Neurosci. 2009;29:106–117. doi: 10.1523/JNEUROSCI.4442-08.2009. [DOI] [PMC free article] [PubMed] [Google Scholar]
- Werblin FS. Lateral interactions at inner plexiform layer of vertebrate retina: antagonistic responses to change. Science. 1972;175:1008–1010. doi: 10.1126/science.175.4025.1008. [DOI] [PubMed] [Google Scholar]
- Werblin FS. Transmission along and between rods in the tiger salamander retina. J Physiol. 1978;280:449–470. doi: 10.1113/jphysiol.1978.sp012394. [DOI] [PMC free article] [PubMed] [Google Scholar]
- Werblin FS. Six different roles for crossover inhibition in the retina: correcting the nonlinearities of synaptic transmission. Vis Neurosci. 2010;27:1–8. doi: 10.1017/S0952523810000076. [DOI] [PMC free article] [PubMed] [Google Scholar]
- Werblin FS, Dowling JE. Organization of the retina of the mudpuppy, Necturus maculosus. II. Intracellular recording. J Neurophysiol. 1969;32:339–355. doi: 10.1152/jn.1969.32.3.339. [DOI] [PubMed] [Google Scholar]
- Wong-Riley MTT. Synaptic organization of the inner plexiform layer in the retina of the tiger salamander. J Neurocytol. 1974;3:1–33. doi: 10.1007/BF01111929. [DOI] [PubMed] [Google Scholar]
- Wu SM. Synaptic connections between neurons in living slices of the larval tiger salamander retina. J Neurosci Methods. 1987;20:139–149. doi: 10.1016/0165-0270(87)90046-x. [DOI] [PubMed] [Google Scholar]
- Zhou ZJ, Lee S. Synaptic physiology of direction selectivity in the retina. J Physiol. 2008;586:4371–4376. doi: 10.1113/jphysiol.2008.159020. [DOI] [PMC free article] [PubMed] [Google Scholar]