Abstract
Monodisperse gas microbubbles, encapsulated with a shell of photopolymerizable diacetylene lipids and phospholipids, were produced by microfluidic flow focusing, for use as ultrasound contrast agents. The stability of the polymerized shell microbubbles against both aggregation and gas dissolution under physiological conditions was studied. Polyethylene glycol (PEG) 5000, which was attached to the diacetylene lipids, was predicted by molecular theory to provide more steric hindrance against aggregation than PEG 2000 and this was confirmed experimentally. The polymerized shell microbubbles were found to have higher shell-resistance than nonpolymerizable shell microbubbles and commercially available microbubbles (Vevo MicroMarker). The acoustic stability under 7.5 MHz ultrasound insonation was significantly greater than for the two comparison microbubbles. The acoustic stability was tunable by varying the amount of diacetylene lipid. Thus, our polymerized shell microbubbles are a promising platform for ultrasound contrast agents.
Keywords: microbubbles, polymerizable lipid, ultrasound contrast agent, stability, molecular imaging
1. Introduction
Ultrasound contrast imaging is emerging as an advantageous imaging modality because of its low cost and wider availability compared to MRI. It has been demonstrated that a micron-sized bubble (< 8 µm in diameter) with a perfluorocarbon gas core is suitable as an ultrasound contrast agent providing a detectable echogenic signal in vivo.1 However, challenges still remain in terms of producing monodisperse microbubbles that are stable in physiological conditions and resistant to destruction from Ostwald ripening, aggregation, and gas dissolution. Enhanced stability of these microbubbles in the bloodstream is important for improving blood circulation times2 (including reduction of microbubble aggregation that can lead to clogging of small blood vessels) and for achieving an enhanced acoustic response in the region of interest. To increase the stability of microbubbles, various chemical compositions of the microbubbles shells have been adopted, such as the addition of surfactant, protein, and polymer coatings. The inclusion of poly(ethylene glycol) (PEG) polymers tethered to lipids provide both colloidal stability against aggregation3 and steric hindrance to block binding of opsonizing plasma proteins,4,5 thereby increasing the lifetime in blood circulation.6 Polymer-coated microbubbles thus have advantages with respect to their anti-aggregation properties and stability against gas dissolution.1
Ultrasound contrast agents have many additional applications, including blood vessel detection, perfusion estimation, and drug delivery. In the case of drug delivery, it is crucial to be able to control the destruction such that the encapsulated contents are released to the targeted area, with minimal prior passive leakage of drug. However, this precise control has been a challenge due to limited stability of conventional drug delivery carriers, such as liposomes. Using a polydiacetylene lipid shell for ultrasound contrast agents is motivated by the study of, Qin et al.7 who demonstrated that partially polymerized liposomes that contain polydiacetylene are stable against drug leakage, yet they are capable of instantaneous release for controlled drug delivery when activated by a laser. Polydiacetylene liposomes/vesicles, which consist of UV photopolymerizable diacetylene lipids, are biocompatible.8 In addition, they have been employed in biosensing applications as they undergo a color change depending on degree of polymerization, temperature, pH,9 and addition of chemicals.10 Finally, surface properties such as elasticity or resistivity against gas dissolution can be varied by using different mole fractions of diacetylene11 or different UV exposure times.12
Monodisperse microbubbles are desirable because they result in a more uniform acoustic response than polydisperse microbubbles and therefore allow for insonifying waveforms to be optimized for greater echogenicity.13 Improved signal can be achieved by optimizing the targeted UCA through control of average size, polydispersity, and stability in the bloodstream, thereby increasing their potential applicability.14 Further, in the case of a contrast agent carrying a payload, a more selective drug release profile can be achieved by using an ultrasound waveform optimized for destruction of microbubbles of a specific size. Current techniques for producing microbubble contrast agents that involve sonication15 or agitation16 result in large polydispersity and batch-to-batch variation. On the other hand, microfluidic flow focusing has the potential to create particles of narrow size distributions13 by adjusting the flow rates of the two impinging fluids.17
The goal of this study is to develop an optimal shell for monodisperse bubbles, to prevent both coalescence, by providing a steric barrier, and gas dissolution by increasing and the resistance to gas diffusion, in order to achieve a longer ultrasound signal. We developed a novel microbubble system using diacetylene polymerizable lipids and PEGylated lipids as the shell material. We employed a microfluidic flow focusing to produce monodisperse microbubbles and investigated the effect of the PEG lipid and the diacetylene lipid on the stability of the bubbles against aggregation and dissolution under physiological conditions. The stability against aggregation of two interacting microbubbles was predicted by molecular theory for two different PEG molecular weights of the PEGylated lipid and found to agree with our experimental observations. We also compared the ultrasound echogenicity of our PEGylated, monodisperse polymerized shell microbubbles to nonpolymerizable shell microbubbles and a commercially available UCA (Vevo MicroMarker, Visualsonics).
2. Materials and Methods
2.1. Materials and lipid mixture preparation methods
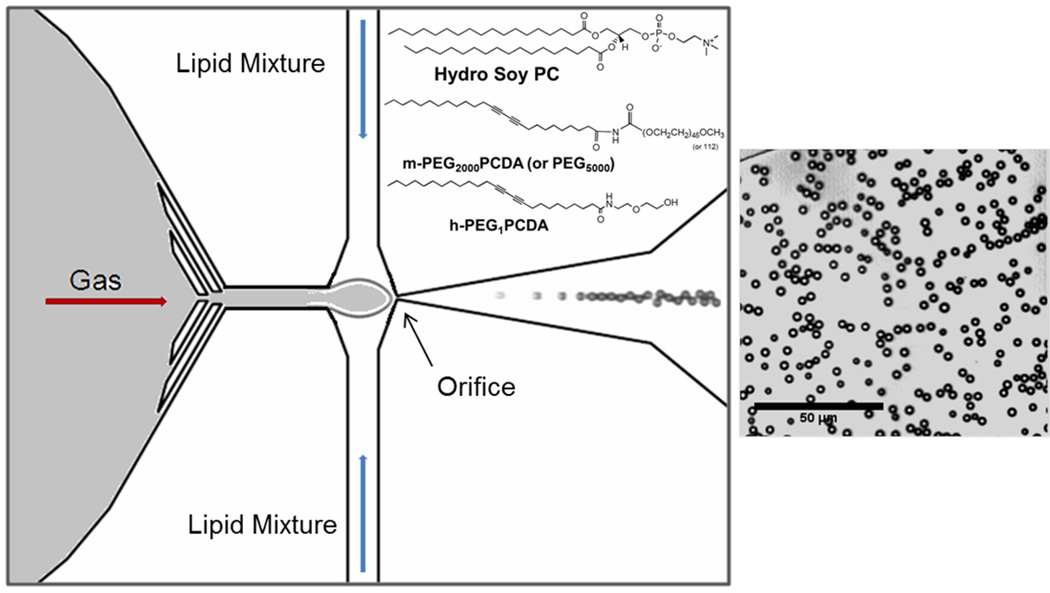
Polymerizable lipid mixtures, consisting of ethylene glycol diacetylene lipids (h-PEG1PCDA), PEG-diacetylene lipids (m-PEG-PCDA) with molecular weight of PEG 2000 (2K) or 5000 (5K) (NanoValent Pharmaceuticals, Inc., Bozeman, MT) and L-α-phosphatidylcholine, hydrogenated Soy (hydro soy PC) (Avanti Polar Lipids, Alabaster, AL) (Figure 1, inset), were prepared by varying h-PEG1PCDA from 0 to 15 mol % and by keeping m-PEG-PCDA constant at 15 mol %, with the balance consisting of hydro soy PC. The mixture of lipids in chloroform was evaporated in vacuum, and the dry film was hydrated with a 5/5/90 (v/v/v) solution, which consisted of 5% glycerin, 5% propylene glycol (Sigma-Aldrich, St. Louis, MO), and 90% water, resulting in a total concentration of the lipid of 5.32 µmol/mL. The mixture was stirred at 67 °C for 1.5 h and bath sonicated at 67 °C for 3 h or more until the dispersion became clear. For a nonpolymerizable lipid shell microbubble (NSM) formulation, 15 mol% of 1,2-distearoyl-sn-phosphoethanolamine-PEG5000 (m-PEG5000-DSPE) (Avanti Polar Lipids) and 85 mol% of 1,2-distearoyl-sn-phosphotidylcholine (DSPC) (Avanti Polar Lipids) were used, followed by the same preparation method for the mixture dispersion. Due to the absence of the diacetylen group the shell of these microbubbles could not be polymerized. The commercially available UCA, Vevo Micromarker (VisualSonics, Toronto, Ontario, Canada), consisted of phospholipids, PEG, fatty acid and a mixture of nitrogen and perfluorobutane gas.
Figure 1.
Schematic of the microfluidic device. A lipid dispersion and gas stream were focused on the orifice (6 µm) to create lipid-coated/gas-filled microbubbles. The height of all the channels was 5 µm and the width of the liquid channels was 50 µm and the gas channel was 40 µm. The structural formulas of the lipids used are given and to the right is shown an image of monodisperse microbubbles produced.
2.2. Flow focusing device and methods
The microfluidic flow focusing device design (Figure 1) was adapted from previous work by Hettiarachchi et al.16 Gas enters the device through a central 40 µm channel, and is focused through a 6 µm orifice by an aqueous lipid mixture dispersion, which flows through two 50 µm flanking channels. All channels were 5 µm high, a dimension controlled by the photo-resist layer described below. The focusing of the flow results in a microjet which periodically pinches off as it exits the orifice, resulting in the formation of gas microbubbles with a monolayer of lipids at the gas-water interface. The microfluidic device used here was fabricated from poly(dimethylsiloxane) (PDMS). The mold for the PDMS was made from a silicon wafer (SI-Tech, Inc., Topsfield, MA). The wafer was spin-coated with photoresist (SU8-2005, MicroChem, Newton, MA) to a thickness of 5 µm and photolithography techniques, using a chromium photomask, were used to create the patterns for the channels. After the photoresist layer was developed, the wafer was used as a mold for the PDMS (Sylgard 184, Dow Corning, Midland, MI). When the PDMS microfluidic devices were separated from the mold, a 0.75 mm diameter needle was inserted through the PDMS into the channels to provide fluid ports, and the devices were then plasma-treated in a plasma asher (Model ML4, PVA TePla, Corona, CA) to bond to a glass cover slip. The final devices were plasma-treated again (PDC-32G Plasma Cleaner, Harrick, Ithaca, NY) for 5 min in order to render the surfaces hydrophilic to facilitate complete wetting of the interior of the devices.
2.3. Microfluidic production of microbubbles
A 0.05% (v/v) Tween 20 (Sigma-Aldrich) solution was pre-flowed in the microfluidic device to create a predictable microchannel surface and to prevent microbubbles from sticking to the microchannel wall and from clogging the orifice. The lipid dispersion (kept at 80°C) was pumped into the device using a digitally controlled syringe pump (Model PHD2000, Harvard Apparatus, Holliston, MA) at a constant flow rate ranging from 0.5 to 1.0 µL/min. Decafluorobutane gas (Synquest Laboratories, Alachua, FL) was supplied to the device from a gas tank. A needle valve and pressure gauge were used to regulate the pressure of the gas flowing into the device to 70 kPa. As the microbubbles were produced and collected, they were polymerized under UV light at 254 nm (8W model, UVP, LLC., Upland, CA) for about 60 min. Microbubble polymerization was determined by observing the color of the bubbles, which turns from clear to blue, purple, or red, depending on the exposure time and cross-linking density.18 After the polymerization, the bubbles were separated from liposomes or vesicles in the dispersion by centrifugation.19
2.4. Optical Imaging analysis
Microbubble production was monitored optically and the microbubbles produced were imaged using a phase contrast microscope (Axiovert 25, Zeiss, Oberkochen, Germany). The microbubbles were mixed with a 150 mM NaCl solution and observed as function of time for the stability study. Histograms of microbubble size were obtained using Image J software. The polydispersity, σ, was calculated as σ = δ/davg × 100%, where δ is the standard deviation and davg the average bubble diameter. The number of microbubbles was counted 3 to 4 times and averaged using a hemocytometer.
2.5. Ultrasound Imaging analysis
Microbubbles immobilized in a polyacrylamide (PAAM) gel were visualized using a portable diagnostic ultrasound system (Terason 2000, Teratech, Burlington, MA) using a L10-5 ultrasound transducer with a bandwidth from 5 to 10 MHz. Ultrasound images were captured every 10 seconds for 2 minutes, every 20 seconds for the next 3 minutes, and then every 1 minute for the next 10 minutes. A region-of-interest (ROI) was selected from the ultrasound images and the brightness intensity in the ROI calculated using the Z-axis profile function in Image J. All the data represent an average of three or four measurements with standard error.
2.6. Theory of microbubble stability against aggregation
The free energy of two interacting microbubbles with a polymeric shell has the following three contributions:
| (1) |
The first term describes the free energy contribution between two microbubbles arising from the steric repulsion originating from the PEG molecules coating the bubbles. These steric repulsions are computed with a molecular theory that explicitly incorporates the molecular details of the PEG polymer molecules. The conformations, size, and shape of all molecular species are explicitly accounted for. Explicit details of the molecular theory and its ability to properly predict both the thermodynamic as well as the structural properties of the polymer layers have been described previously.20–22 Within the framework of the molecular theory we formulate the free energy per unit area between two planar, coated PEG layers, as a function of separation s = D − 2R between the two surfaces, for a given polymer length and number of PEG molecules per unit area. Here D is the center-to-center distance of the microbubbles and s corresponds to the surface-to-surface separation. The free energy minimization provides the probability of each chain conformation, and the distribution of both polymer chains and solvent. Therefore, the arrangement of the PEG chains and the shape of the two interacting polymer layers are not imposed but are obtained as an output of the theory. Namely, for each distance between the two planar surfaces the molecular organization of the polymers is the results of minimization the free energy. See Ref. 24 for the explicit free energy formula and additional details. Subsequently, we employed the Derjaguin approximation,23 which transforms the free energy per unit area W(s) / A between two interacting plates into the force between two microbubbles/spheres of radius R; F(s) = πRW(s) / A. This force is numerically integrated to obtain the free energy contribution of the PEG layers as a function of distance between two microbubbles. The Derjaguin approximation is applicable because the range of the steric repulsion or distance between the microbubbles is much less than its radius: s << R. It is important to emphasize that the molecular theory has been used to study the properties of PEG layers25 and PEGylated liposomes26 and their interactions27 and the predictions have been found to be in quantitative agreement with experimental observations, therefore we trust that the theory is suitable for the studies presented here.
The second contribution to the free energy describes the Van der Waals (VdW) interaction between the (interior of the) microbubbles across the water medium and is given by
| (2) |
The above formula takes into account the effect of retardation on the VdW interactions between the two microbubbles via the coefficients (p=11.12 and λ=100 nm).23,28 The effect of retardation on the VdW interaction is important for the microbubbles distances of interest, i.e., the range of the steric repulsions: s ≈ 20 nm. AH corresponds to the Hamaker coefficient for the polymer coated microbubbles in water. We choose AH to be AH=15zJ (=3.7 kBT). This choice is motivated by the observation that the Hamaker coefficient should have a value between that of the Hamaker coefficient for air-water-air (AH=37zJ (=9.13 kBT)) and hydrocarbon-water-hydrocarbon (AH=4zJ (=0.98 kBT)) interactions, because of the effect of the gas and polymer shell.23,28 Future calculations will employ the more complex Lifshitz theory to evaluate the VdW interactions between the microbubbles more accurately, but are beyond the scope of the current work.29,30
The last term accounts for electrostatic repulsion between the microbubbles:23
| (3) |
here ψ0 corresponds to the surface electrostatic potential and κ−1 is the Debye length. The electrostatic interactions originate from the charges or ionizable groups of the lipids of the PEG-lipid shell.
3. Results and Discussion
3.1. Size distribution
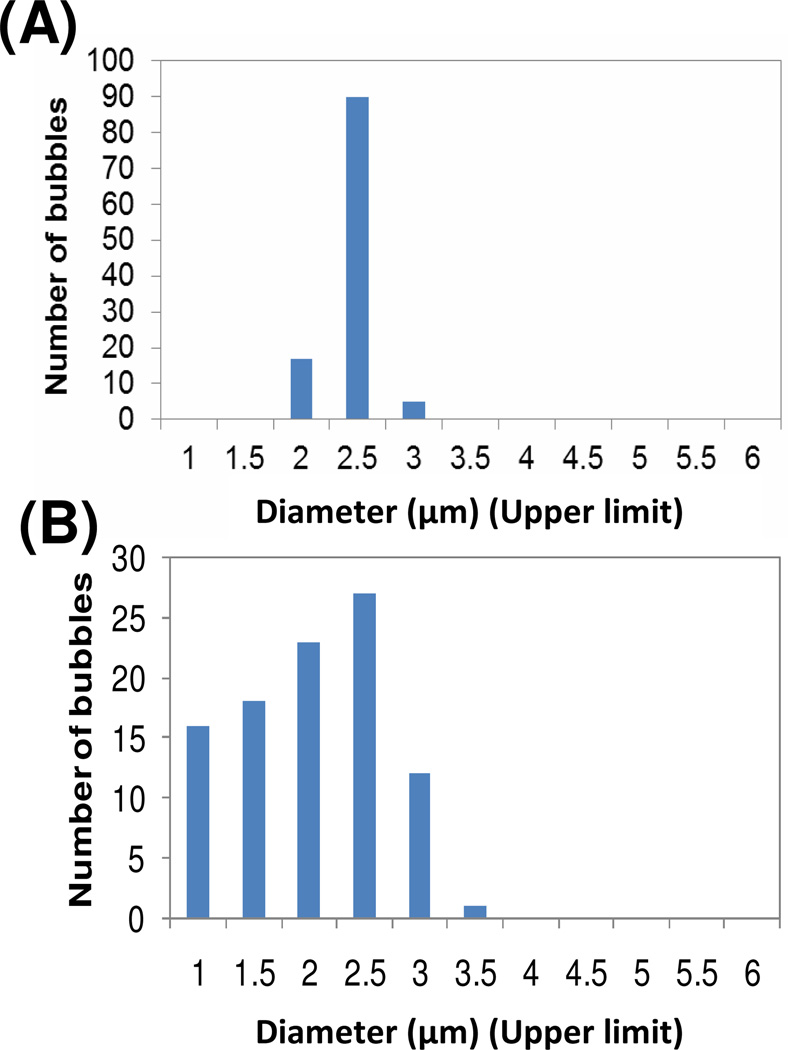
Polymerized shell microbubbles (PSM) containing 25 mol% of polymerizable diacetylene lipids (25% DA: 10 mol% h-PEG1PCDA and 15 mol% m-PEG2000PCDA) were produced by microfluidic flow focusing device. Figure 2 shows the measured size distribution of the PSM and commercially acquired Vevo MicroMarker (VMM) microbubbles. The average diameters of the two microbubble formulations were very similar – 2.2 µm and 2.3 µm for the PSM and the VMM respectively, however, the polydispersity of the VMM was almost four times greater than that of the PSM (36% vs 8%). This result clearly shows the advantage of using the microfluidic technique for UCA in order to achieve monodisperse microbubbles which ultimately leads to a more uniform ultrasound response and eventually a more selective drug release.
Figure 2.
Size distribution of (A) 25 % DA PSM and (B) VMM. The numbers in x-axis correspond upper limit of each bin with an interval of 0.5 µm.
3.2. Stability against aggregation
3.2.1. Theoretical predictions
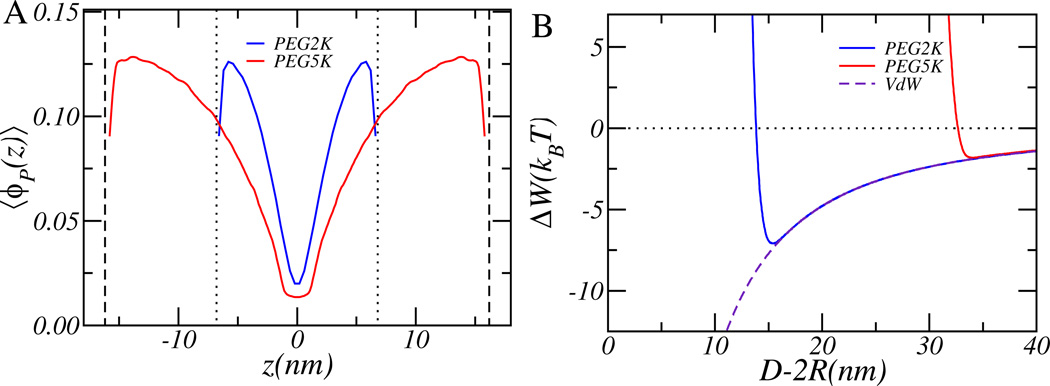
Figure 3A and 3B show the structural and thermodynamic properties of two interacting microbubbles. The number of PEG molecules per unit area or surface coverage is equal to σ=0.20 nm−2, which is comparable with the surface coverage of a microbubble made of the 15% mol PEG-lipid mixture used in the experiments. We are assuming that the area per lipid is that of a lipid bilayer: a0=0.65 nm2.
Figure 3.
(A) The polymer volume fraction of two interacting PEG coated microbubbles at a separation where the two microbubbles have a net repulsion of W=5kBT. The positions of the two microbubbles are indicated by the dotted (PEG2K) and dashed (PEG5K) lines. The variable z corresponds to the axis connecting the two microbubbles and z is measured from the midplane between the microbubbles. (B) The free energy as function of separation between two microbubbles. The radius of the microbubbles is R=1 µm and the surface coverage is σ=0.20 nm−2.
Figure 3A shows the PEG volume fraction of the two PEG coated microbubbles along the axis connecting the centers of the two microbubbles. The separation between the two microbubbles is such that the computed free energy for two microbubbles has a net repulsion of W=5kBT. For the given surface coverage the PEG layer is between the “brush” (dense) and “mushroom” (dilute) regime; hence, approximations for the free energy valid for those regimes cannot be used.
The figure shows also that the polymer shell made of PEG 5K is much more extended than the polymer layer consisting of PEG 2K, as the PEG 5K molecule is twice as long as the PEG 2K molecule. Consequently, the separation at which the steric repulsions are able to generate an effective repulsion of 5 kBT, as shown in the figure, is much larger. Interestingly, we see that in order to achieve this relatively large repulsion there is significant interdigitation between the two PEG layers. This is true for both molecular weights. The longer range of the protective layer by the PEG 5K is also seen in Figure 3B, which shows the predicted free energy as function of separation between the two microbubbles. The dotted line labeled “VdW” (Figure 3B) shows the free energy for two interacting microbubbles that are not decorated with PEG polymers. In this case, the free energy is always attractive; hence microbubbles without PEG are unstable against aggregation. For microbubbles with a PEG 2K or PEG 5K coating the free energy becomes repulsive at short separations due to the steric repulsions mediated by the polymer layer. Note that for both molecular weights the free energy shows a minimum, because the VdW attractions (due to the size of the microbubble) are longer-ranged than the steric repulsions mediated by either the 2K or 5K molecular weight PEG layers. However, the size and location of the minimum in the free energy is quite different for the two molecular weight polymers. Because the PEG 5K layer is more extended, it will generate steric repulsions at larger separations than microbubbles having layers made of PEG 2K and because the VdW attraction decreases with increasing separation, the depth of the minimum is reduced. Increasing the amount of PEG will increase the magnitude of the steric barrier, but it will not significantly increase the range of the steric repulsions. (See also Figure S1 in supplementary material). Hence for micron-sized PEG coated bubbles it is not the size but the range of the steric repulsions that will determine whether the microbubbles will be stable against aggregation: the longer the PEG molecules, the more stable the microbubbles are. For microbubbles of radius R=1 µm the minimal free energy is −2 kBT and −7 kBT respectively for PEG 5K and PEG 2K. Because the free energy minimum of microbubbles with a polymeric shell of PEG 5K is only −2 kBT, which is very shallow compared to the thermal energy, it is very likely for microbubbles to kinetically escape from each other, i.e., microbubbles with a PEG 5K polymeric shell are marginally stable against aggregation. On the other hand, microbubbles with a PEG 2K polymeric shell will be unstable against aggregation as their free energy minimum is much larger.
The charges present on the lipids of the lipid-polymer shell coating the microbubbles can potentially lead to additional electrostatic repulsions between the coated microbubbles. However, electrostatic interactions are screened over distances larger than the Debye length and at the experimental and physiological relevant condition of 150 mM of NaCl the Debye length is only κ−1=0.9 nm. Therefore, electrostatic repulsions are negligible at this salt concentration. However, for sufficiently low salt concentrations the strength and range of the electrostatic interactions can increase to such a degree that they are able to overcome the VdW attractions (See also Figure S2 supplementary material.) Consequently, lower salt concentrations tend to stabilize the microbubble dispersion. Finally, the free energy is linearly proportional to the radius because of the Derjaguin approximation. Therefore, smaller sized microbubbles will have a reduced free energy minimum and the microbubbles can thus more easily kinetically escape from each other. Hence smaller microbubbles are more stable against aggregation than larger microbubbles with a similar polymeric shell.
3.2.2. Experimental observations
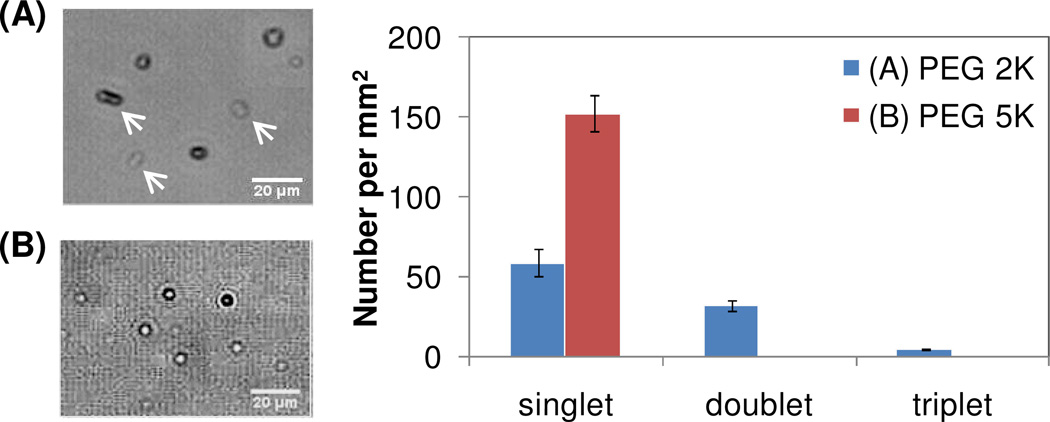
To test the predictions of stability against aggregation under isotonic conditions, PEGylated diacetylene lipids with the two different PEG molecular weights, 2K and 5K, were tested as one of the components of the shell. Both kinds of microbubbles, 25% DA – PEG 2K (10 mol% h-PEG1PCDA and 15 mol% m-PEG2000PCDA) and 25% DA – PEG 5K (10 mol% h-PEG1PCDA and 15 mol% m-PEG5000PCDA), showed individual dispersed microbubbles without aggregation in the 5/5/90 solution (5 v/v% glycerin, 5 v/v% propylene glycol and DI water). However, in 150 mM NaCl solution, 25% DA –PEG 2K showed aggregation (Figure 4) and the microbubbles eventually coalesced. This was quantified by counting the number of singlet, doublet, and triplet of the microbubbles one hour after the bubbles were dispersed in the solution. For PEG 5K, only singlets were observed after one hour in solution whereas for PEG 2K more than half the bubbles were doublets over the same time frame. This result indicates that the electrostatic forces between the microbubbles, which contribute to the stability at low salt concentration, are shielded at high salt concentration, thereby causing aggregation for microbubbles containing PEG 2K. With the longer polymer chain, PEG 5K, repulsion due to steric effects still plays a role and reduces aggregation. Even though the lipid mixture for the surface materials contains 15 mol% of PEGylated lipid, the exact amount at the surface of the microbubble could potentially be less than 15 mol%. Further molecular characterization, such as mass spectrometry, is needed for the exact ratio of each lipid at the surface. The VMM, which was dispersed in 150 mM NaCl solution, also showed coagulated multiple particles (data not shown).
Figure 4.
(A) 25% DA – PEG 2K at isotonic condition shows aggregation, mostly doublets (arrows); (B) all 25% DA – PEG 5K is singlet at the same condition. The bar graph shows the population of singlet, doublet and triplet microbubbles for the two kinds of bubbles. The vertical lines are standard error.
We also observed bubble-bubble interactions under a microscope, using a micropipette to hold one of the microbubbles, while the second microbubble was tethered to a surface via biotin-PEG-neutravidin binding (data not shown). In this case, one third of the PEG fraction was replaced with biotinylated PEG to anchor one bubble on a neutravidin-coated glass coverslip. The second bubble was caught by a micropipette and was slowly brought closer to the tethered microbubble. In the 5-5-90 solution, repulsive interactions between the bubbles were observed both for PEG 2K and for PEG 5K when they were less than 1 um apart. However, we observed differences between PEG 2K and 5K when 10× PBS was added. The PEG 5K still exhibited a repulsive interaction whereas the PEG 2K bubbles seemed to adhere to one another upon contact, in a reversible manner. This qualitative observation indicates the bubbles are stabilized in part by electrostatic repulsion for the PEG 2K and that this force is screened in high salt condition. On the other hand, the steric repulsion due to the higher MW PEG is still effective for the PEG 5K.
3.3. Stability against gas dissolution
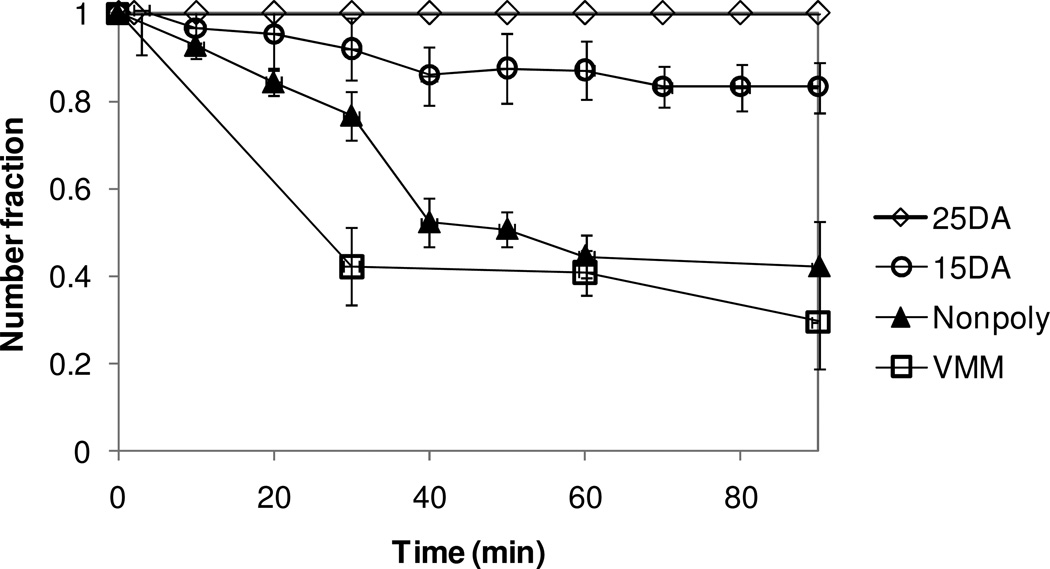
The stability of the microbubble also depends on the degree of gas loss to the aqueous environment. As long as the gas concentration in the microbubble is greater than in its surrounding medium, diffusion will result in loss of gas from the microbubble resulting in size decrease and eventual disappearance of the bubble. The lifetime of the microbubbles with different shell materials in 150 mM NaCl solution was observed optically as a function of time, for up to 90 minutes (Figure 5). It was found that the polymerized shell microbubbles (PSM), either 25% DA (10 mol% h-PEG1PCDA and 15 mol% m-PEG5000PCDA) or 15% DA (0 mol% h-PEG1PCDA and 15 mol% m-PEG5000PCDA) were much more stable than the VMM or the non-polymerizable shell microbubbles (NSM). While more than half of the bubbles disappeared within 90 minutes for VMM and NSM, almost all the PSM bubbles remained mostly intact. In particular, the 25% DA formulation did not show a significant decrease in size during the 90-minute observation. Some decreases in size and in number were observed with 15% DA. This indicates that more crosslinking for the 25% DA likely occurred than for the 15% DA. This could be because the 25% DA has a higher concentration of polymerizable lipid, per microbubbles, than in the 15% DA formulation. In addition, 15% DA has no h-PEG1PCDA component and the only polymerizable lipid is the high molecular weight PEGylated PCDA, which has the large steric head groups. This may cause less robust crosslinking than in the 25% DA formulation because the PEG groups would sterically hinder the lipid tails, (where the polymerizable site is located,) from getting in close enough proximity for polymerization to occur. For long-term stability, the 25% DA bubble population remained intact even after 15 hours (data not shown) and can be stored for weeks with gas saturation on the headspace of a vial.
Figure 5.
Normalized number of microbubbles remained with time. The stability against gas dissolution of the different shell materials is informed: (◊) 25% DA; (○) 15% DA; (▲) nonpolymerizable lipids; (□) VMM.
There are a few parameters which affect the gas dissolution, such as surface tension, partial gas pressure in a surrounding medium, and shell resistance against gas transfer from the core to the medium. Equation 4 describes the rate of change in the radius of a microbubble:
| (4) |
where R is the bubble radius, Rshell is the shell resistance, Dw is the diffusivity of air in the surrounding medium, H is the Ostwald coefficient which is equal to the ratio of the gas concentration in the aqueous phase to that in the gas phase, Pa is the ambient pressure, σ is the surface tension at the bubble-water interface, and f is the ratio of the actual partial pressure of the diffusing species in the surrounding medium to that at saturation. According to Borden and Longo,31 the Rshell is the most significant for microbubbles and this parameter would have been affected by the change in shell properties due to polymerization process. Equation 4 was solved numerically (function ode45, Matlab, Mathworks, Natick, MA) using the following properties from Ref 31, H=0.02, Dw=2 ×10⁻⁹ m2/s, Pa=1 ×10⁵ Pa, σ =0.072 N/m and f=5/6. For a microbubble of initial diameter 4 µm (radius 2µm) a shell resistance Rshell=1×10⁶ s/m resulted in a predicted dissolution time of 120 s which is similar to what was observed for the NSM. For these parameters the predicted dissolution time increased linearly with Rshell and therefore in order to model the 600-fold increase in dissolution time (15 hours vs. 1.5 minutes) observed for the PSM the shell resistance would need to be 600 times larger. These results indicate that the slower dissolution rate of the PSM is consistent with a higher resistance to gas diffusion than VMM or NSM.
3.4. Ultrasound Echogenicity
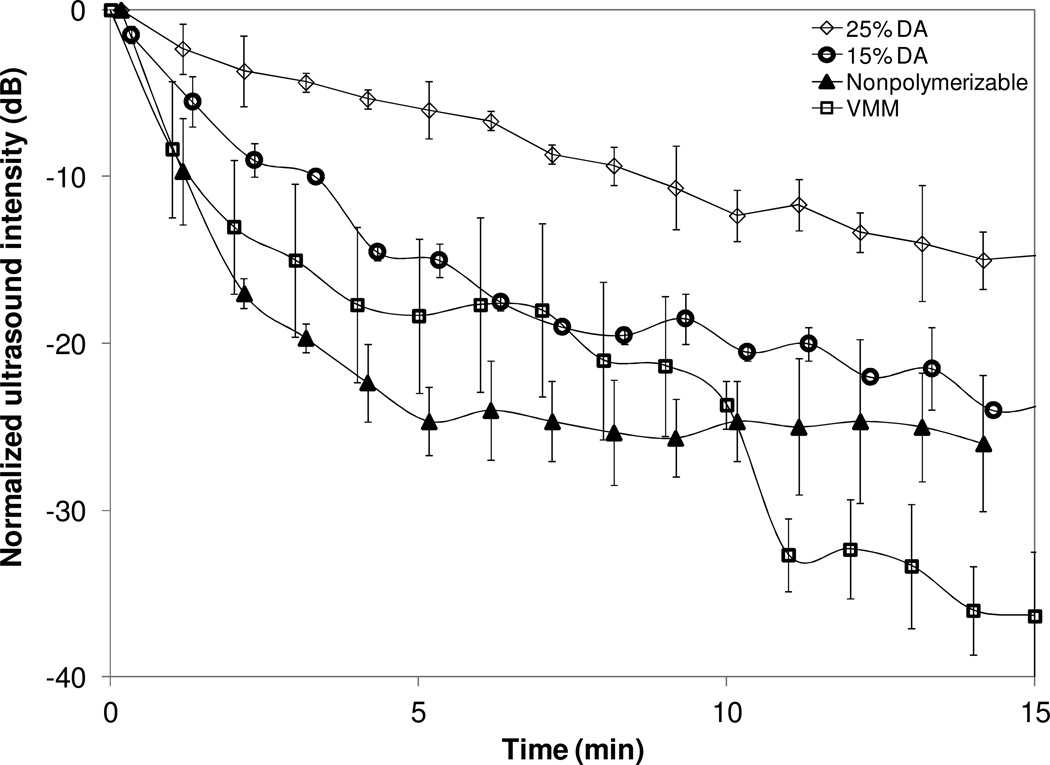
The performance under ultrasound imaging was assessed by observing the B-mode brightness using a Terason 10L5 probe (center frequency of 7.5 MHz). Figure 6 shows the intensity of the ultrasound echogenicity as a function of time for NSM, VMM, PSM 15% DA and PSM 25% DA. The 25% DA showed a significantly slower decrease in intensity than VMM or NSM. The half-life (tH the time for the ultrasound signal to drop 6 dB in brightness) for the 25% DA was tH = 5 minutes, and for both VMM and NSM, tH < 1 minute. The brightness of the 25% DA decreased by 14 dB after 15 minutes, whereas the VMM brightness decreased by 36 dB, which suggests rapid microbubble destruction. The 15% DA also showed slow destruction, i.e. tH = 1.5 minute, even though the brightness eventually decreased by 24 dB, which is similar to the NSM. These data indicate that the polymerizable lipids increased not only the stability in solution but also the stability under ultrasound, while still resulting in a measurable echogenic signal. Further, this data also shows that the dissolution rate of these microbubbles can be tuned by controlling the amount of DA in the shell. The differences in dissolution rate as a function of concentration of DA suggest that the structure of the shell is modulated by lipid composition.
Figure 6.
Ultrasound image intensity (at 7.5 MHz) vs. time for a variety of microbubble shell materials: (◊) 25% DA; (○) 15% DA; (▲) nonpolymerizable lipids; (□) VMM. The intensity in the ROI was normalized by the initial intensity and then converted to dB. The vertical lines represent standard error.
4. Conclusion
Polymerized shell microbubbles (PSM) of controlled size and distribution were produced using microfluidic focusing. The microbubbles were shown to have stability against aggregation and gas dissolution and these results were consistent with calculations. For aggregation the interaction of microbubbles for two different polymer lengths of the coating was calculated using molecular theory and the observed results confirmed the theoretical predictions. The PSM remained intact much longer in an aqueous solution than non-polymerizable shell microbubbles or commercially available microbubbles (VMM) and this was consistent with numerical calculations in which there was an increase in the resistance of the shell resistance to gas diffusion. Under ultrasonic insonation, PSM containing a higher diacetylene lipid content showed a longer dissolution time, tH=5 minutes, than a shell with a lower diacetylene content, tH=1.5 minute, and much less than VMM or nonpolymerized formulations (tH < 1 minute). These results imply that the dissolution of these microbubbles in the bloodstream or under ultrasound stimulation is tunable by varying the fraction of polymerizable lipids. With the appropriate lipid formulation, the lifetime of these microbubbles was sufficient for desired in vivo circulation times under relevant ultrasonic insonation conditions for visualization. In the future, binding of specific chemical or biological targets to the PEG will enable us to use these as targeted ultrasound contrast agent. Therefore, these tunable microbubbles produced by microfluidics and different polymerizable lipid compositions have the potential to be customized ultrasound contrast agents for targeted molecular imaging and therapeutic treatment.
Supplementary Material
Acknowledgments
This research was supported in part by a College of Engineering Distinguished Faculty Fellowship to J.Y.W. and in part by the Bernard M. Gordon Center for Subsurface Sensing and Imaging Systems (CENSSIS) under the Engineering Research Centers Program of the National Science Foundation (Award number EEC-9986821). B.A. was supported in part by the Boston University PROSTARS and UROP programs. We thank Dr. Wesley P. Wong and Dr. Ken Halvorsen (Rowland Institute at Harvard University) for the micropipette bubble-bubble interaction study and Mr. Chentian Zhang (Boston University) for the microfluidic design. IS acknowledges support from supported by the National Science Foundation under grant CBET-0828046, and the National Institutes of Health grant No. NIH GM087016.
References
- 1.Goldberg BB, Raichlen JS, Forsberg F. Ultrasound Contrast Agents Basic principles and clinical applications. 2nd Ed. London, UK: Martin Dunitz Ltd; 2001. [Google Scholar]
- 2.Feinstein SB, Tencate FJ, Zwehl W, Ogn K, Maurer G, Tei C, Shah PM, Meerbaum S, Corday E. J. Am. Coll. Cardiol. 1984;3:14–20. doi: 10.1016/s0735-1097(84)80424-6. [DOI] [PubMed] [Google Scholar]
- 3.Edwards K, Johnsson M, Karlsson G, Silvander M. Biophys. J. 1997;73:258–266. doi: 10.1016/S0006-3495(97)78066-4. [DOI] [PMC free article] [PubMed] [Google Scholar]
- 4.Park Y, Franses EI. Langmuir. 2010;26:6932–6942. doi: 10.1021/la904183e. [DOI] [PubMed] [Google Scholar]
- 5.Napper DH. J. Colloid Interface Sci. 1977;58:390. doi: 10.1006/jcis.1999.6222. [DOI] [PubMed] [Google Scholar]
- 6.Klibanov AL. Bioconjugate Chem. 2005;16:9–17. doi: 10.1021/bc049898y. [DOI] [PubMed] [Google Scholar]
- 7.Qin G, Li Z, Xia R, Li F, O’Neill BE, Goodwin JT, Khant HA, Chiu W, Li KC. Nanotechnology. 2011;22:155605–155611. doi: 10.1088/0957-4484/22/15/155605. [DOI] [PMC free article] [PubMed] [Google Scholar]
- 8.Meilander NJ, Yu X, Ziats NP, Bellamkonda RV. J. Control. Release. 2001;71:141–152. doi: 10.1016/s0168-3659(01)00214-0. [DOI] [PubMed] [Google Scholar]
- 9.Ahn DJ, Chae E-H, Lee GS, Shim H-Y, Chang T-E, Ahn K-D, Kim J-M. J. Am. Chem. Soc. 2003;125:8976–8977. doi: 10.1021/ja0299001. [DOI] [PubMed] [Google Scholar]
- 10.Kim K-W, Choi H, Lee GS, Ahn DJ, Oh M-K. Colloid Surface B. 2008;66:213–217. doi: 10.1016/j.colsurfb.2008.06.020. [DOI] [PubMed] [Google Scholar]
- 11.Cheng Q, Stevens RC. Langmuir. 1998;14:1974–1978. [Google Scholar]
- 12.Sasaki DY, Carpick RW, Burns AR. J. Colloid Interface Sci. 2000;229:490–496. doi: 10.1006/jcis.2000.7043. [DOI] [PubMed] [Google Scholar]
- 13.Talu E, Hettiarachchi K, Zhao S, Powell RL, Lee AP, Longo ML, Dayton PA. Mol. Imaging. 2007;6:384–392. [PMC free article] [PubMed] [Google Scholar]
- 14.Stride E, Edirisinghe M. Soft Matter. 2008;4:2350–2359. [Google Scholar]
- 15.Cohen JL, Cheirif J, Segar DS, Gillam LD, Gottdiener JS, Hausnerova E, Bruns DE. J. Am. Coll. Cardio. 1998;32:746–752. doi: 10.1016/s0735-1097(98)00311-8. [DOI] [PubMed] [Google Scholar]
- 16.Hettiarachchi K, Talu E, Longo ML, Dayton PA, Lee AP. Lap Chip. 2007;7:463–468. doi: 10.1039/b701481n. [DOI] [PMC free article] [PubMed] [Google Scholar]
- 17.Anna SL, Bontoux N, Stone HA. Appl Phys Lett. 2003;82:364–366. [Google Scholar]
- 18.Lifshitz Y, Golan Y, Konovalov O, Berman A. Langmuir. 2009;25:4469–4477. doi: 10.1021/la8029038. [DOI] [PubMed] [Google Scholar]
- 19.Feshitan JA, Chen CC, Kwan JJ, Borden MA. J. Colloid Interface Sci. 2009;329:316–324. doi: 10.1016/j.jcis.2008.09.066. [DOI] [PubMed] [Google Scholar]
- 20.Szleifer I, Carignano MA. Adv. Chem. Phys. 1996;94:165–260. [Google Scholar]
- 21.Nap R, Gong P, Szleifer I. J. Polym. Sci., Part B; Polym. Phys. 2006;44:2638–2662. [Google Scholar]
- 22.Szleifer I, Carignano MA. Macromol. Rapid Commun. 2000;21:423–448. [Google Scholar]
- 23.Israelachvili JN. Intermolecular and Surface Forces. 3rd Ed. San Diego: Academic Press; 2011. [Google Scholar]
- 24.Carignano MA, Szleifer I. Interface Science. 2003;11:187–197. [Google Scholar]
- 25.Szleifer I. Curr. Opin. Colloid Interface Sci. 1996;1:416–423. [Google Scholar]
- 26.Szleifer I, Gerasimov OV, Thompson DH. Proc. Nat. Acad. Sci. 1998;95:1032–1037. doi: 10.1073/pnas.95.3.1032. [DOI] [PMC free article] [PubMed] [Google Scholar]
- 27.Longo G, Thompson D, Szleifer I. Langmuir. 2008;24:10324–10333. doi: 10.1021/la8009699. [DOI] [PMC free article] [PubMed] [Google Scholar]
- 28.Gregory J. J. Coll. Int. Sci. 1981;83:138–145. [Google Scholar]
- 29.Parsegian VA. Van der Waals forces. New York: Cambridge University Press; 2006. [Google Scholar]
- 30.Lima ERA, Boström M, Sernelius BE, Horinek D, Netz RR, Biscaia EC, Jr, Kunz W, Tavares F. Chem. Phys. Lett. 2008;458:299–302. [Google Scholar]
- 31.Borden MA, Longo ML. Langmuir. 2002;18:9225–9233. [Google Scholar]
Associated Data
This section collects any data citations, data availability statements, or supplementary materials included in this article.


