

Abstract
A single-laboratory validation study was conducted on an HPLC method for the detection and quantification of cyanidin-3-O-galactoside (C3Ga), cyanidin-3-O-glucoside (C3Gl), cyanidin-3-O-arabinoside (C3Ar), peonidin-3-O-galactoside (P3Ga), and peonidin-3-O-arabinoside (P3Ar) in cranberry fruit (Vaccinium macrocarpon Aiton) raw material and finished products. An extraction procedure using a combination of sonication and shaking with acidified methanol was optimized for all five anthocyanins in freeze-dried cranberry fruit and finished products (commercial extract powder, juice, and juice cocktail). Final extract solutions were analyzed by HPLC using a C18 RP column. Calibration curves for all anthocyanin concentrations had correlation coefficients (r2) of ≥99.8%. The method detection limits for C3Ga, C3Gl, C3Ar, P3Ga, and P3Ar were estimated to be 0.018, 0.016, 0.006, 0.013, and 0.011 μg/mL, respectively. Separation was achieved with a chromatographic run time of 35 min using a binary mobile phase with gradient elution. Quantitative determination performed in triplicate on four test materials on each of 3 days (n = 12) resulted in RSDr from 1.77 to 3.31%. Analytical range, as defined by the calibration curves, was 0.57–36.53 μg/mL for C3Ga, 0.15–9.83 μg/mL for C3Gl, 0.28–17.67 μg/mL for C3Ar, 1.01–64.71 μg/mL for P3Ga, and 0.42–27.14 μg/mL for P3Ar. For solid materials prepared by the described method, this translates to 0.06–3.65 mg/g for C3Ga, 0.02–0.98 mg/g for C3Gl, 0.03–1.77 mg/g for C3Ar, 0.10–6.47 mg/g for P3Ga, and 0.04–2.71 mg/g for P3Ar.
The cranberry (Vaccinium macrocarpon Aiton), native only to the United States and Canada, is commonly consumed as juice cocktail, juice, and other product forms (capsules, tablets, etc.) to treat and prevent urinary tract infection (1-6). Research suggests proanthocyanidins (PACs), phytochemical constituents of cranberry, act to inhibit a variety of Escherichia coli strains from adhering to uroepithelial cells in the urinary tract (5, 7-9). Despite this, the PAC concentration in cranberry products necessary to obtain the desired effect remains unknown, and the complex, polymeric nature of PACs has made development of analytical methods and reference materials to support quantitative measurement a challenge. In addition, it is likely that other phytochemicals along with proanthocyanidins contribute to the overall biological activity of the products (10-14). Among the chemical constituents of interest in cranberry are a series of organic acids (β-hydroxybutyric, citric, malic, quinic, benzoic, and ellagic) and flavonoids, including flavonols, flavan-3-ols (catechins), and flavonals (anthocyanidins and anthocyanins; 11-13).
Commonly, the quinic acid content and ratio of quinic to malic acid are used to calculate the percentage of cranberry juice content in beverages and assess cranberry juice authenticity (15, 16). However, these acids are not unique to cranberries, and using these measurements to determine quality will not preclude the possibility of adulteration. Although the anthocyanin content of cranberry can change and degrade with processing and storage, the anthocyanin profile is unique to cranberry, and its qualitative pattern is characteristic (16). According to Prior et al. (17), cranberry primarily contains the anthocyanins peonidin-3-O-galactoside (P3Ga), cyanidin-3-O-galactoside (C3Ga), cyanidin-3-O-arabinoside (C3Ar), peonidin-3-O-arabinoside (P3Ar), and smaller amounts of cyanidin-3-O-glucoside (C3Gl) and petunidin-3-O-galactoside.
Spectrophotometry and HPLC analysis of the anthocyanidins (aglycones) post-hydrolysis can provide an estimate of total anthocyanin content in cases where the identity and purity of the test substance is known. This nonspecific approach is susceptible to interferences caused by adulteration with other anthocyanin-rich berries; as such, methods to directly measure intact anthocyanins are preferred (18). When measuring intact anthocyanins, it is common industry practice to use a high-purity C3Gl standard to make an external calibration curve, and then use total peak areas detected at 520 nm to calculate total anthocyanin content in mg/g (19-25). This process is called normalization; the validity of this approach is based on the assumption that all anthocyanins have the same UV response to that of C3Gl. With all five major anthocyanins currently commercially available, individual reference standards for each analyte of interest were used here, rather than using only C3Gl.
The HPLC-UV method described for quantification of the five predominant cranberry anthocyanins was adapted from published methods (19, 25-27) and validated for use as a QC tool in analysis of commercial cranberry fruit products. The method described quantifies the five major anthocyanins in raw cranberry, cranberry juice, cranberry juice cocktail, and cranberry extract powder by using a seven-point standard curve generated from mixed standard solutions containing C3Ga, C3Ar, C3Gl, P3Ga, and P3Ar.
METHOD
Principle
This method is suitable for the determination of C3Ga, C3Ar, C3G1, P3Ga, and P3Ar in freeze-dried raw cranberry, cranberry juice, cranberry juice cocktail, and cranberry extract powder.
Test Samples
Raw cranberries (freeze-dried).
Cranberry juice.
Cranberry juice cocktail.
Cranberry powdered extracts.
All test samples were stored at 4°C. The same lot of each material was used throughout the validation studies.
Chemicals
Acetonitrile (CH3CN).—Purity ≥99.8% (GC), HPLC grade or equivalent.
Methanol (CH3OH).—Purity 99.97%, HPLC grade or equivalent.
Water (H2O).—Purity submicron-filtered, HPLC grade or equivalent.
Hydrochloric acid (HCl in H2O; 33–40%).—Purity HPLC grade or equivalent.
Glacial acetic acid (CH3COOH).—Purity HPLC grade or equivalent.
Phosphoric acid (H3PO4 in H2O; 55–95%).—Purity HPLC grade or equivalent.
Solutions
Reference standard diluent.—Methanol (33–40%)–HCl (98 + 2, v/v).
Extraction solvent.—Methanol (33–40%)–HCl (98 + 2, v/v).
HPLC mobile phases.—Mobile phase A (MPA): water–phosphoric acid (99.5 + 0.5, v/v); mobile phase B (MPB): water–acetonitrile–glacial acetic acid–phosphoric acid (50.0 + 48.5 + 1.0 + 0.5, v/v/v/v).
Reference Standards
Reference standards for each of the five anthocyanins of interest were obtained from Cerilliant Corp. (Round Rock, TX). Individual 1000 μg/mL stock solutions of each anthocyanin standard were prepared by weighing 10.0 ± 1.0 mg of each standard into separate amber 10 mL volumetric flasks. Approximately 5 mL 2% (v/v) HCl in methanol solution was added to each flask and sonicated until all solid material dissolved. The flasks were then brought to volume with the addition of 2% (v/v) HCl in methanol solution. Solutions were stored at −20°C when not in use. A mixed anthocyanin reference standard solution was prepared by transferring 400 μL C3Ga stock solution, 100 μL C3Gl stock solution, 400 μL C3Ar stock solution, 70 μL P3Ga stock solution, 30 μL P3Ar stock solution, and 8100 μL 2% (v/v) HCl in methanol solution into a test tube. The tube was vortexed for 30 s to produce a mixed standard solution with the concentrations shown in Table 1. The purity of each individual chemical standard was determined chromatographically. The actual concentration of each anthocyanin in the stock solution was then calculated after purity corrections were applied. We observed good agreement between the reported and observed purities of most of the standards, but noted a significant disparity in the reported and measured purity of C3Ar. The mixed anthocyanin reference solution was stored at −20°C.
Table 1.
Anthocyanin concentrations in mixed standard solution
| Anthocyanin | Theoretical concn, μg/mL | Purity, %a | Actual concn, μg/mL | Chemical formula | CAS No. |
|---|---|---|---|---|---|
| C3Ga | 40 | 91.32 | 36.53 | C21H21ClO11 | 27661-36-5 |
| C3Gl | 10 | 98.30 | 9.83 | C21H21ClO11 | 7084-24-4 |
| C3Ar | 40 | 44.18 | 17.67 | C20H19ClO10 | NAb |
| P3Ga | 70 | 92.44 | 64.71 | C22H23ClO11 | NA |
| P3Ar | 30 | 90.47 | 27.14 | C21H21ClO10 | NA |
Purity determined chromatographically for each individual chemical calibration standard.
NA = Not available.
Apparatus
Analytical balance.—Mettler-Toledo (Columbia, MD) AE 260 analytical delta range (±0.1 mg) or equivalent, calibrated with National Institute of Standards and Technology (NIST; Gaithersburg, MD) traceable calibration weights.
Centrifuge.—Eppendorf 5804 tabletop centrifuge or equivalent (Hauppauge, NY).
Syringes.—3 mL Luer-lok® or equivalent (Fisher Scientific, Ottawa, ON, Canada).
Syringe filters.—PTFE and nylon, 0.45 μm pore size, 25 mm id or equivalent (VRW, Mississauga, ON, Canada).
Vortex mixer.—Thermolyne Maxi Mix 1 or equivalent (Thermo Scientific, Asheville, NC).
Micropipets.—Eppendorf Reference Series, 100, 200, and 1000 μL or equivalent.
HPLC system.—Agilent (Santa Clara, CA) 1100 Series liquid chromatograph equipped with a quaternary pump and degasser (G1354A); temperature-controlled column compartment (G1316A); temperature-controlled autosampler (G1327A); standard flowcell, 10 mm, 13 μL, 120 bar (G1315-60012); diode-array detector (G1315B); HPLC 2D ChemStation Software (G2175AA); and online degasser (1322A) or equivalent.
Ultrasonic water bath.—Bransonic Ultrasonic Corp. (Danbury, CT) 3510 or equivalent.
HPLC column.—Cosmosil 5C18-PAQ, 4.6 ×150 mm, 5 μm particle size (Nacalai USA, Inc., San Diego, CA) or equivalent.
Wrist action shaker.—Burrell Scientific Inc., Model 75 or equivalent (Pittsburgh, PA).
Coffee grinder.—Black and Decker Smart Grind, or equivalent.
Graduated cylinders.—10, 50, 100, and 500 mL.
Reagent bottles.—1.0 and 2.0 L.
Polypropylene centrifuge tubes.—50 mL.
Amber HPLC injection vials.—1 mL, with Tefloncoated caps (VWR).
HPLC Conditions
Instrument.—Agilent HP1100 series equipped with diode array detector or equivalent.
Autosampler temperature.—4°C.
Analytical column.—Cosmosil 5C18-PAQ waters type, 4.6 × 150 mm, 5 μm.
Column temperature.—25°C.
Detector conditions.—520 nm (8 nm bandwidth), no reference.
Flow rate.—0.9 mL/min.
Run time.—35 min with 5 min post-time for column equilibration.
Injection volume.—10 μL.
Gradient conditions.—Time, min/% MPB: 1, 10; 28, 50; 32, 75; 32.1/10; 35/10.
The order of elution was C3Ga (15.8–15.9 min), C3Gl (16.7–16.9 min), C3Ar (17.7–17.9 min), P3Ga (18.3–18.5 min), and P3Ar (20.2–20.4 min); see Figure 1.
Figure 1.
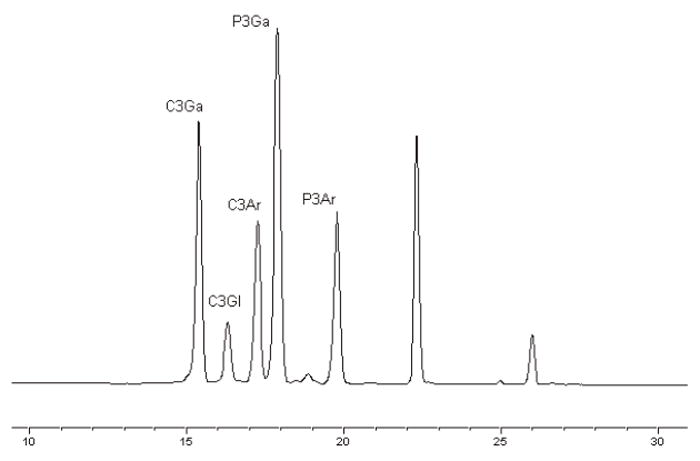
The order of anthocyanin elution in a mixed anthocyanin reference standard chromatogram. Elution profile in absorbance units (y axis) per minute (x axis).
Calculations
Individual anthocyanins from solid samples were quantified in % (w/w) using the following equation:
where P0 = peak area of target analyte in sample chromatogram, b0 = y-intercept of calibration curve for the target analyte, m0 = slope of calibration curve for the target analyte, V = volume of test solution in mL, W = dry weight of sample in g, and D = dilution factor = 1.
Individual anthocyanins from liquid samples were quantified in μg/mL using the following equation:
where P0 = peak area of target analyte in sample chromatogram, b0 = y-intercept of calibration curve for the target analyte, m0 = slope of calibration curve for the target analyte, and D = dilution factor = 1. The calculations used to determine the Horwitz Ratio (HorRat), a normalized performance parameter used to evaluate overall method precision, are provided below:
where SD(r) = the population standard deviation.
where C = the concentration of the analyte expressed as a mass fraction.
Preparation of Test Samples
Freeze-dried raw material and powdered extract.—Grind freeze-dried cranberries and cranberry extract powder to <60 mesh (250 μm) powder. Weigh 0.250 g (±0.025 g) test sample into a 50 mL conical tube, add 20 mL extraction solvent using a graduated cylinder, vortex for 10 s, sonicate for 15 min, and shake on an angle at 180 rpm for 30 min. Vortex test solutions for 10 s and centrifuge at 5000 rpm for 5 min. Decant the supernatant into a 25 mL volumetric flask and bring to volume with extraction solvent. Invert the flask 20 times to mix, and filter approximately 1 mL solution through a 0.45 μm Teflon filter into an amber HPLC vial for analysis.
Juice.—Thoroughly mix the juice by inverting the container approximately 20 times, or until no sediment is visible. Centrifuge 10 mL juice at 5000 rpm for 10 min. Dilute 1000 μL with 500 μL extraction solvent, and filter approximately 1 mL solution through a 0.45 μm nylon filter into an amber HPLC vial.
Juice cocktail.—Thoroughly mix the juice cocktail by inverting the container approximately 20 times or until no sediment is visible. Centrifuge 10 mL cocktail at 5000 rpm, and filter approximately 1 mL solution through a 0.45 μm nylon filter into an amber HPLC vials.
Preparation of Calibration Solutions
The mixed anthocyanin reference solution (as described above) is diluted with a solution of 2% (v/v) concentrated HCl in methanol, as per the dilution scheme presented below, mixed well, and stored at −20°C when not in use. The final concentrations of the calibration standards are presented in Table 2.
Table 2.
Approximate concentrations (μg/mL) of individual anthocyanins at each dilution level of the calibration curve
| Linearity | C3Ga | C3Gl | C3Ar | P3Ga | P3Ar |
|---|---|---|---|---|---|
| 7 | 36.53 | 9.83 | 17.67 | 64.71 | 27.14 |
| 6 | 18.27 | 4.91 | 8.84 | 32.35 | 13.57 |
| 5 | 9.13 | 2.46 | 4.42 | 16.18 | 6.78 |
| 4 | 4.57 | 1.23 | 2.21 | 8.09 | 3.39 |
| 3 | 2.28 | 0.61 | 1.10 | 4.04 | 1.70 |
| 2 | 1.14 | 0.31 | 0.55 | 2.02 | 0.85 |
| 1 | 0.57 | 0.15 | 0.28 | 1.01 | 0.42 |
Linearity 7.—Pipet 500 μL mixed anthocyanin reference solution.
Linearity 6.—Dilute 500 μL linearity 7 solution with 500 μL reference solution diluent.
Linearity 5.—Dilute 500 μL linearity 6 solution with 500 μL reference solution diluent.
Linearity 4.—Dilute 500 μL linearity 5 solution with 500 μL reference solution diluent.
Linearity 3.—Dilute 500 μL linearity 4 solution with 500 μL reference solution diluent.
Linearity 2.—Dilute 500 μL linearity 3 solution with 500 μL reference solution diluent.
Linearity 1.—Dilute 500 μL linearity 2 solution with 500 μL reference solution diluent.
Single-Laboratory Validation Parameters
This method described was validated according to AOAC INTERNATIONAL guidelines for conducting a single-laboratory validation (SLV; 28).
Selectivity.—Selectivity was demonstrated by injecting each of the reference analytes and showing that all anthocyanins to be quantified were well resolved from potential matrix interferences with detection at 520 nm, as confirmed by a lack of signals from the matrix blanks. Resolution was considered adequate if baseline separation was observed between the analyte peaks and any other peaks in the chromatogram.
Linearity.—The linearity of each analyte was demonstrated for a seven-point calibration standard curve, prepared as described above. The calibration curves for each anthocyanin were plotted, and linear regression was used to determine the slope and y-intercept. Each calibration curve was visually inspected to confirm linearity. The correlation coefficient (r2) of the regression lines were calculated using linear regression for each quantified anthocyanin. An r2 of ≥99.5% was considered linear and, thus, acceptable for quantifying the anthocyanins in the different matrixes.
-
Method detection level (MDL) and LOQ.—The absence of a suitable sample blank precluded the use of the International Union of Pure and Applied Chemistry method for determination of detection limits for the analytes. As an alternative, the LOD for each analyte was determined using the U.S. Environmental Protection Agency MDL (29). The MDL is defined as the minimum concentration of substance that can be measured and reported with 99% confidence that the analyte concentration is greater than zero. A first set of nine replicate standard solutions containing a very low concentration of each of the analytes was used to determine the MDL. The concentration of each of the replicates was calculated. The calculation of the MDL was as follows:
where s = the sample SD of the replicates and t (0.01, n−1) = the t statistic with α = 0.01 and n − 1 degrees of freedom.A second set of seven replicate standard solutions containing another very low level of each of the analytes was also prepared and analyzed. The variances for each analyte at the two low levels were compared using variance ratio tests to ensure the assumption of the MDL method that the variances at low levels were equal was valid.
The LOQ was calculated as 10 times the sample SD of the results for the replicates used to determine the MDL.
Precision (repeatability).—Precision was evaluated by analyzing multiple replicates of each test sample. Four replicate preparations of each material were prepared and analyzed on each of 3 separate days. In total, 12 replicates of each material were prepared. The within-day, between-day, and total SD values were calculated for each of the individual anthocyanins, in each of the four materials. The HorRat value for each analyte in each material was also calculated to assess the overall precision of the method as described by Horwitz (30).
Accuracy.—Dried elderberry was used as the matrix blank and considered representative of dietary supplement finished products. The matrix blank was spiked with C3Ga at three spiking levels, corresponding to approximately 200, 100, and 50% of the expected concentrations in actual sample preparations. Each level was prepared in quadruplicate, and analyzed on 3 separate days, along with unfortified controls.
Stability Study: Reference Standard and Test Material Solutions
A freeze-dried cranberry sample and a mid-range mixed anthocyanin reference standard solution prepared on the first day of the precision analysis were used to assess the stability of the analytes in solution. Both samples were stored in the freezer at −25°C for 13 days. Each sample was analyzed by the described method at 7 and 13 days. Total anthocyanin concentration in the test solutions was quantified using standard curves generated from freshly prepared standards, and the results obtained at the three different time points were compared.
Youden Ruggedness Trial: A Factorial Study
A factorial study was performed to determine whether deviations in selected factors would affect the method performance. The trial used for this test was described by Youden and Steiner (31), further detailed by Wernimont (32), and examines seven factors at two levels in eight experiments. The seven factors examined were sample mass, sonication time, extraction solvent concentration, shaking time, sonicator bath temperature, injection volume, and centrifugation time. The parameter levels are designated in Table 3. Both freeze-dried cranberries and a cranberry extract powder were used as sample matrixes for the factorial study. Two-tailed variance ratio tests were used to compare the variances for each analyte observed from the eight experiments. These variances were also compared to the variance obtained for each of the analytes for the cranberry extract powder for the precision analysis described above.
Table 3.
Parameters used in the factorial study
| Factor | High value | Low value | Factor effect | Effect |
|---|---|---|---|---|
| Sample mass, mg | A = 275 | a = 175 | A and a | J |
| Sonication time, min | B = 20 | b = 10 | B and b | K |
| HCl in solvent, % | C = 2.5 | c = 1.5 | C and c | L |
| Shaking time, min | D = 40 | d = 20 | D and d | M |
| Sonicator temperature, °C | E = 40 | e = Ice bath | E and e | N |
| Injection volume, μL | F = 15 | f = 10 | F and f | O |
| Centrifugation time, min | G = 10 | g = 5 | G and g | P |
Results and Discussion
Method Validation Results: Performance Characteristics
Identification of C3Ga, C3Gl, C3Ar, P3Ga, and P3Ar in validation test samples was possible by comparing retention times and UV profiles to those of the mixed anthocyanin reference standard. Quantification of analytes was conducted using linear regression analysis from triplicate standard curves prepared on 3 separate days. Quadruplicate samples were also prepared on each of these days. Test sample matrixes included freeze-dried cranberry, cranberry extract powder, cranberry juice, and cranberry juice cocktail.
Selectivity.—C3Ga, C3Gl, C3Ar, P3Ga, and P3Ar were well resolved from potential matrix interferences with detection at 520 nm.
Linearity and analytical range.—All of the standard curves produced over the course of the study appeared linear upon visual inspection with all calculated r2 values above 99.5%. These results confirm the linearity of the analytical range studied. The analytical range was approximately 0.57–36.53 μg/mL for C3Ga, 0.15–9.83 μg/mL for C3Gl, 0.28–17.67 μg/mL for C3Ar, 1.01–64.71 μg/mL for P3Ga, and 0.42–27.14 μg/mL for P3Ar. For solid materials prepared by the described method, this translates to 0.06–3.65 mg/g for C3Ga, 0.02–0.98 mg/g for C3Gl, 0.03–1.77 mg/g for C3Ar, 0.10–6.47 mg/g for P3Ga, and 0.04–2.71 mg/g for P3Ar.
MDL and LOQ.—Variance checks showed that the method used was applicable for the analytes. The MDL and LOQ for each of the analytes are reported in Table 4.
Precision (repeatability).—Results from the precision analysis indicated that all analytes were determined with adequate precision in each of the matrixes. HorRat values were also acceptable for the anthocyanins, ranging from 0.18 to 1.06. AOAC guidelines describe the acceptable range of HorRat values to be 0.3–1.3. The low HorRat values (<0.3) were considered acceptable, as the analysis was performed by a well-trained analyst under tightly controlled conditions (28). Table 5 summarizes the precision results obtained over the course of the 3 days.
Accuracy.—A recovery study based on spiking C3Ga into negative control material (freeze-dried elderberry) at 200, 100, and 50% of expected levels was completed. The average recovery over these three levels was 99.79% with an RSD of 4.59%. Spike recovery results are given in Table 6.
Table 4.
The MDL and LOQ calculated for each of the analytes used in this study
| Analyte | MDL, μg/mL | LOQ, μg/mL |
|---|---|---|
| C3Ga | 0.02 | 0.06 |
| C3Gl | 0.02 | 0.05 |
| C3Ar | 0.01 | 0.02 |
| P3Ga | 0.01 | 0.04 |
| P3Ar | 0.01 | 0.03 |
Table 5.
Precision results summary of V. macrocarpon test samples
| Matrix | Analyte | Mean mg/g | s(w)a | s(b)b | s(t)c | RSDrd | HorRat |
|---|---|---|---|---|---|---|---|
| Freeze-dried cranberry | C3Ga | 1.11 | 0.02 | 0.02 | 0.03 | 2.96 | 0.53 |
| C3Gl | 0.03 | 0.01 | 0.01 | 0.04 | 12.70 | 1.32 | |
| C3Ar | 0.63 | 0.01 | 0.01 | 0.02 | 2.65 | 0.44 | |
| P3Ga | 1.82 | 0.03 | 0.03 | 0.05 | 2.62 | 0.51 | |
| P3Ar | 0.68 | 0.01 | 0.01 | 0.02 | 2.70 | 0.45 | |
| Cranberry extract powder | C3Ga | 0.39 | 0.01 | 0.01 | 0.01 | 2.77 | 0.42 |
| C3Gl | 0.02 | 0.01 | 0.01 | 0.01 | 11.20 | 1.07 | |
| C3Ar | 0.17 | 0.01 | 0.01 | 0.01 | 2.27 | 0.31 | |
| P3Ga | 0.44 | 0.01 | 0.01 | 0.01 | 2.73 | 0.43 | |
| P3Ar | 0.15 | 0.01 | 0.01 | 0.01 | 3.31 | 0.44 | |
|
| |||||||
| Mean μg/mL | |||||||
|
| |||||||
| Cranberry juice | C3Ga | 38.10 | 0.55 | 0.49 | 0.74 | 1.94 | 0.21 |
| C3Gl | 1.03 | 0.03 | 0.05 | 0.054 | 5.28 | 0.33 | |
| C3Ar | 23.50 | 0.54 | 0.48 | 0.72 | 3.08 | 0.31 | |
| P3Ga | 74.10 | 0.98 | 0.87 | 1.31 | 1.77 | 0.21 | |
| P3Ar | 29.90 | 0.51 | 0.39 | 0.64 | 2.15 | 0.22 | |
| Cranberry juice cocktail | C3Ga | 3.76 | 0.06 | 0.45 | 0.07 | 1.98 | 0.15 |
| C3Gl | 0.12 | 0.01 | 0.02 | 0.02 | 19.8 | 0.89 | |
| C3Ar | 2.04 | 0.04 | 0.03 | 0.05 | 2.61 | 0.18 | |
| P3Ga | 6.49 | 0.13 | 0.03 | 0.01 | 1.99 | 0.16 | |
| P3Ar | 2.24 | 0.06 | 0.03 | 0.06 | 2.85 | 0.28 | |
s(w) = Within-day SD.
s(b) = Between-day SD.
s(t) = Total SD.
RSDr = Total repeatability SD.
Table 6.
Negative control spike recovery results
| C3Ga spike level | Recovery, % | RSD, % |
|---|---|---|
| Level 1 (50%) | 98.24 | 5.18 |
| Level 2 (100%) | 99.43 | 4.95 |
| Level 3 (200%) | 101.69 | 2.89 |
Stability Study: Reference Standard and Test Material Solutions
No significant deviation in the total anthocyanin content was observed in the mixed standard and extracted solution of freeze-dried cranberry fruit when determined at 7 and 13 days, compared to t = 0. These results suggest that the anthocyanins are stable in solution when stored at −25°C for at least 13 days.
Youden Ruggedness Trial: A Factorial Study
The calculated effects of varying the various parameters did not appear to have a significant effect on the total percentage of anthocyanins extracted and determined. F-ratio variance tests indicated that none of the calculated variances for each of the analytes for each of the factors analyzed was significantly different from the variances calculated for the analytes in the cranberry extract powder sample during precision testing. This is illustrated graphically in Figure 2, whereby each calculated effect (J–P, Table 3) is plotted with the axis limits set as the overall method precision. Results of the Youden factorial study indicated that the optimized method is not significantly affected by changes to those specific factors.
Figure 2.
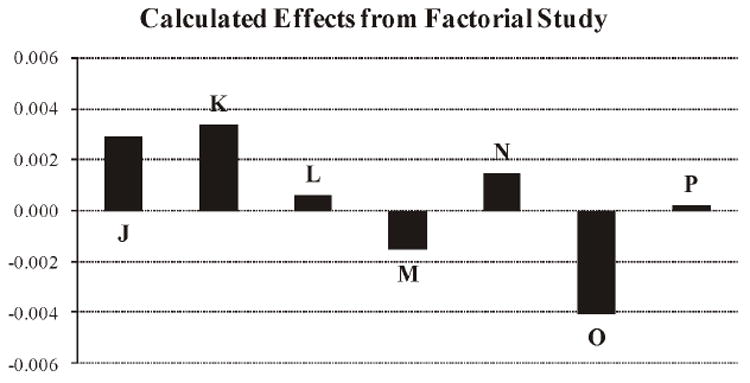
Calculated effect of factors on total anthocyanins (%, w/w) extracted from cranberry extract powder.
Conclusions
With the prevalence of cranberry products in the marketplace and ongoing interest in the scientific community on the potential health benefits of cranberry fruit, it is important that methods are validated to ensure confidence in analytical data. The HPLC method described here for the determination of the five major anthocyanins in raw materials and select finished products containing cranberry (V. macrocarpon) was subjected to an SLV according to AOAC guidelines (28), a stability study, and a Youden ruggedness trial. The results of these studies demonstrate that the method described is fit for the purpose of determining C3Ga, C3G1, C3Ar, P3Ga, and 3PAr in cranberry fruit and finished products (dried extracts, juice, and juice cocktail). It is recommended that the method be further evaluated for reproducibility and a composite measure of variation that includes between- and within-laboratory variation through a collaborative study. The paucity of information concerning purity and stability of commercially available calibration standards for anthocyanins makes it difficult to determine whether the process of normalization to C3Gl is valid for determination of all anthocyanins. Efforts should be made to independently confirm the purity of chemical reference materials prior to use as calibration standards for quantification.
Acknowledgments
We would like to acknowledge the Office of Dietary Supplements at the NIST for supporting this work through provision of chemical reference materials.
Contributor Information
Paula N. Brown, University of British Columbia Okanagan, 3333 University Way, Kelowna, British Columbia, Canada, V1V 1V7 and British Columbia Institute of Technology, 3700 Willingdon Ave, Burnaby, British Columbia, Canada, V5G 3H2
Paul R. Shipley, University of British Columbia Okanagan, 3333 University Way, Kelowna, British Columbia, Canada, V1V 1V7
References
- 1.Avorn J, Monane M, Gurwitz J, Glynn R, Choodnovskiy I, Lipsitz L. J Am Med Assoc. 1994;271:751–754. doi: 10.1001/jama.1994.03510340041031. [DOI] [PubMed] [Google Scholar]
- 2.Walker EB, Barney DP, Mickelsen JN, Walton RJ, Mickelsen RA., Jr J Fam Pract. 1997;45:167–168. [PubMed] [Google Scholar]
- 3.Kontiokari T, Sundqvist K, Nuutinen M, Pokka T, Koskela M, Uhari M. Br Med J. 2001;322:1571. doi: 10.1136/bmj.322.7302.1571. [DOI] [PMC free article] [PubMed] [Google Scholar]
- 4.Stothers L. Can J Urol. 2002;9:1558–1562. [PubMed] [Google Scholar]
- 5.Howell AB. Mol Nutr Food Res. 2007;51:732–737. doi: 10.1002/mnfr.200700038. [DOI] [PubMed] [Google Scholar]
- 6.Jepson RG, Craig JC. Cochrane Database Syst Rev. 2008;23 doi: 10.1002/14651858.CD001321.pub4. CD001321. [DOI] [PubMed] [Google Scholar]
- 7.Upton R, editor. American Herbal Pharmacopoeia and Therapeutic Compendium, Cranberry Fruit, Vaccinium macrocarpon Aiton, Standards of Analysis, Quality Control, and Therapeutics. American Herbal Pharmacopeia; Scotts Valley, CA: 2002. [Google Scholar]
- 8.Schmidt DR, Sobota AE. Microbios. 1988;55:173–181. [PubMed] [Google Scholar]
- 9.Ofek I, Goldhar J, Zafriri D, Lis H, Adar R, Sharon N. N Engl J Med. 1991;324:1599. doi: 10.1056/NEJM199105303242214. [DOI] [PubMed] [Google Scholar]
- 10.He X, Liu RH. J Agric Food Chem. 2006;54:7069–7074. doi: 10.1021/jf061058l. [DOI] [PubMed] [Google Scholar]
- 11.Nowack R. Wien Med Wochenschr. 2007;157:325–330. doi: 10.1007/s10354-007-0432-8. [DOI] [PubMed] [Google Scholar]
- 12.Pappas E, Schaich KM. Crit Rev Food Sci. 2009;49:741–781. doi: 10.1080/10408390802145377. [DOI] [PubMed] [Google Scholar]
- 13.Neto CC. J Nutr. 2007;137:168S–193S. doi: 10.1093/jn/137.1.186S. [DOI] [PubMed] [Google Scholar]
- 14.Neto CC, Amoroso JW, Liberty AM. Mol Nutr Food Res. 2008;52:S18–S27. doi: 10.1002/mnfr.200700433. [DOI] [PubMed] [Google Scholar]
- 15.Kuzminski L. Nutr Rev. 1996;54:S87–S90. doi: 10.1111/j.1753-4887.1996.tb03824.x. [DOI] [PubMed] [Google Scholar]
- 16.Nagy S, Wade RL. Methods to Detect Adulteration of Fruit Juice Beverages. Vol. 1. Agscience Inc.; Auburndale, FL: 1995. [Google Scholar]
- 17.Prior RL, Lazarus SA, Cao G, Muccitelli H, Hammerstone JF. J Agric Food Chem. 2001;49:1270–1276. doi: 10.1021/jf001211q. [DOI] [PubMed] [Google Scholar]
- 18.Zhang K, Zuo Y. J Agric Food Chem. 2004;52:222–227. doi: 10.1021/jf035073r. [DOI] [PubMed] [Google Scholar]
- 19.Fuleki FJ, Francis J. J Food Sci. 1968;33:266–274. [Google Scholar]
- 20.Mazza G, Cacace JE, Kay CD. J AOAC Int. 2004;87:129–145. [PubMed] [Google Scholar]
- 21.Andersen ØM. J Food Sci. 1989;54:383–384. [Google Scholar]
- 22.Cassinese C, de Combarieu E, Falzoni M, Fuzzati N, Pace R, Sardone N. J AOAC Int. 2007;90:911–919. [PubMed] [Google Scholar]
- 23.Deubert KH. J Agric Food Chem. 1978;26:1452–1453. doi: 10.1021/jf60220a041. [DOI] [PubMed] [Google Scholar]
- 24.Chen F, Sun Y, Zhao G, Liao X, Hu X, Wu J, Wang Z. Ultrason Sonochem. 2007;14:767–778. doi: 10.1016/j.ultsonch.2006.12.011. [DOI] [PubMed] [Google Scholar]
- 25.Chandra A, Rana J, Li Y. J Agric Food Chem. 2001;49:3515–3521. doi: 10.1021/jf010389p. [DOI] [PubMed] [Google Scholar]
- 26.Pascual-Teresa SD, Santos-Buelga C, Rivas-Gonzalo JC. J Sci Food Agric. 2002;82:1003–1006. [Google Scholar]
- 27.Moyer RA, Hummer KE, Finn CE, Frei B, Wrolstad RE. J Agric Food Chem. 2002;50:519–525. doi: 10.1021/jf011062r. [DOI] [PubMed] [Google Scholar]
- 28.Guidelines for Single Laboratory Validation of Chemical Methods for Dietary Supplements and Botanicals. AOAC INTERNATIONAL; Gaithersburg, MD: 2003. [Google Scholar]
- 29.Guidelines Establishing Test Procedures for the Analysis of Pollutants: Procedures for Detection and Quantification. Washington, DC: 2003. 40 CFR Pt. 146, Appendix B, rev. 1.11, Code of Federal Regulations. [Google Scholar]
- 30.Horwitz W. Anal Chem. 1982;54:67A–76A. [Google Scholar]
- 31.Youden WJ, Steiner EH. Statistical Manual of the AOAC. AOAC INTERNATIONAL; Gaithersburg, MD: 1975. [Google Scholar]
- 32.Wernimont GT. Use of Statistics to Develop and Evaluate Analytical Methods. AOAC INTERNATIONAL; Gaithersburg, MD: 1985. [Google Scholar]