Abstract
The third component of human complement (C3) plays a central role in innate immune function as its activation is required to trigger classical as well as alternative complement pathways. In this study, we have observed that sera from patients chronically infected with hepatitis C virus (HCV) displayed significantly lower C3 levels than sera from healthy individuals. Liver biopsy specimens from the same patients also exhibited lower C3 mRNA expression than liver tissues from healthy donors. C3 mRNA level was reduced in hepatocytes upon infection with cell culture-grown HCV genotype 1a or 2a in vitro. Further analysis suggested that HCV core protein displayed a weak repression of C3 promoter activity by downregulating the transcription factor farnesoid X receptor (FXR). On the other hand, HCV NS5A protein strongly downregulated C3 promoter activity at the basal level or in the presence of interleukin-1β (IL-1β) as an inducer. In addition, the expression of the transcription factor CAAT/enhancer binding protein beta (C/EBP-β), which binds to the IL-1/IL-6 response element in the C3 promoter, was inhibited in liver biopsy specimens. Furthermore, expression of C/EBP-β was reduced in hepatocytes infected with cell culture-grown HCV, as well as in hepatocytes transfected with the NS5A genomic region of HCV. Together, these results underscore the role of HCV NS5A protein in impairing innate immune function.
INTRODUCTION
The complement system is a set of biochemical pathways that help clear pathogen components from an organism as part of the innate and acquired immunity programs. It links the innate and adaptive immune responses by a variety of mechanisms, including enhancing humoral immunity, regulating antibody effector mechanisms, and modulating T cell function (11). Complement activation leads to a plethora of cellular responses ranging from apoptosis to opsonization (38). Evidence from several studies suggests that the complement system is also involved in the pathogenesis of a variety of liver disorders, including viral hepatitis, liver injury and repair, fibrosis, alcoholic liver disease, and liver ischemic/reperfusion injury (34). C3 complement protein plays a pivotal role in both classical and alternative pathways of complement activation. Chronic hepatitis C virus (HCV) infection is a leading cause of progressive liver disease. Interactions between HCV and the host immune surveillance system may play an important role in viral persistence. Serum C3 levels have been shown to be depleted in HCV-infected cirrhotic patients (3). C3 is also a member of acute-phase proteins (APPs), whose levels of expression are either positively or negatively regulated by cytokines during inflammation, chiefly through the regulation of the activities of their cognate genes (10, 15, 16, 35). C3 belongs to type I APP genes that are upregulated by interleukin-1 (IL-1), IL-6, tumor necrosis factor alpha (TNF-α), and glucocorticoids (GCs) or their various combinations (12). Studies on rat hepatoma cell lines indicated that IL-1β and IL-6 synergistically enhanced C3 mRNA levels and protein secretion (40). However, expression of C3 in human hepatoma cells has been shown to be primarily responsive to the cytokine IL-1 (17). Type I IL-1/IL-6-responsive elements (REs) are binding sites for CAAT/enhancer binding protein (C/EBP) transcription factors (33), which can mediate transcriptional induction by both IL-1 and IL-6. They had been identified on the promoters of most type I APP genes, including C3 (19, 42). Recently, treatment of human astrocytes with recombinant IL-1β alone had been found to induce C3 mRNA levels by ∼15-fold (27). Furthermore, IL-1β induction of C3 expression resulted in phosphorylation and activation of C/EBP-β that bound to C3 promoter in an IL-1β-dependent manner (27). C3 expression has also been shown to be regulated by other transcription factors like NF-κB in human intestinal epithelial cells (29) and by farnesoid X receptor (FXR) in rat hepatoma and human colorectal adenocarcinoma cells (22). The C3 promoter region regulated by FXR has been mapped, and C3 mRNA expression is induced by the FXR agonists chenodeoxycholic acid (CDCA) and GW4064 (22). In this study, we have examined the mechanisms for regulation of C3 complement synthesis by HCV. Our results suggested that the HCV NS5A protein primarily suppresses C3 complement expression by inhibiting expression of IL-1β-induced C/EBP-β transcription factor in human hepatocytes.
MATERIALS AND METHODS
Patient materials.
Paired serum samples and liver biopsy specimens from chronically HCV-infected patients (n = 12) were used, as previously described (8). Commercially available control liver RNAs were procured (Clonetics, CA; CloneTech, CA; and Lonza, NJ) and used in this study. Sera from healthy volunteers were used as controls.
C3 ELISA.
HCV-infected patient sera were used for C3 estimation by a commercially available enzyme-linked immunosorbent assay (ELISA) kit (Abnova, Taiwan).
Cells and transfections.
Human hepatoma cells (Huh7) were maintained in Dulbecco's modified Eagle's medium (DMEM) supplemented with 10% heat-inactivated fetal calf serum. Immortalized human hepatocytes (IHH) were generated and maintained in small-airway epithelial cell growth medium ([SABM] Lonza, MD) supplemented with 5% heat-inactivated fetal calf serum as previously described (9, 37). IHH and Huh7 cells were used for infection with HCV genotypes 1a and 2a, respectively, as previously described (18), and RNA was extracted 3 days postinfection. Huh7 cells were transfected with plasmid DNA from a mammalian expression vector (pcDNA3) containing either the full-length (FL) HCV genome or a specific HCV genomic region under the control of a cytomegalovirus (CMV) promoter using Lipofectamine 2000 (Life Technologies, Inc., MD). Stable cell colonies were selected using neomycin and pooled for subsequent studies to avoid artifactual results from clonal variation. Parental cells transfected with empty vector DNA were used in parallel as a negative control.
Real-time PCR.
C3 or C/EBP-β mRNA quantitation was performed by real-time PCR analysis using specific TaqMan primers and probes (Applied Biosystems, CA). RNA was isolated from liver biopsy specimens as well as from Huh7 cells infected with HCV or transiently transfected with plasmids expressing specific HCV genomic regions by using TRIzol (Invitrogen). cDNA synthesis was done using random hexamers and a SuperScript III first-strand synthesis kit (Invitrogen). C3 and C/EBPβ mRNAs were evaluated using specific oligonucleotide primers (Applied Biosystems gene expression assays Hs01100879-m1 and PPM04471E-200 for C3 and Hs00270923-s1 for C/EBP-β) after normalization with glyceraldehyde 3-phosphate dehydrogenase (GAPDH) (Mm99999915-g1) or 18S RNA (Hs03928992-g1).
Luciferase assay.
HepG2 cells were transfected with a C3 promoter luciferase reporter construct (200 ng/well) (Addgene Inc., MA), alone or together with HCV core or nonstructural proteins (NS2, NS3/NS4A [NS3/4A], or NS5A) or a full-length genome (HCV FL) construct (500 ng/well) in a 24-well plate. In experiments assessing effects of IL-1β and/or IL-6, cells were treated with the cytokine (10 ng/ml for IL-1β and 50 ng/ml for IL-6) at 24 h posttransfection. Cells were lysed by reporter lysis buffer (Promega, WI) 48 h after transfection, and luciferase activity was measured using a luminometer (Opticomp II; MGM Instruments).
Western blotting.
Proteins in cell lysates were resolved by SDS-PAGE, transferred onto a nitrocellulose membrane, and blotted with the appropriate primary antibody. Positive signals were detected using a peroxidase-conjugated secondary antibody. Protein bands were visualized using an enhanced chemiluminescence detection kit (Super Signal West Pico; Thermo Chemical Company, IL). Cellular actin was detected similarly for comparison of protein load in each lane.
Statistical analysis.
Results were expressed as the mean ± standard deviation (SD), and statistical analyses were performed using a two-tailed unpaired Student t test or one-way analysis of variance (ANOVA) in GraphPad Prism, version 5 (GraphPad, La Jolla, CA). A P value of <0.05 was considered statistically significant.
RESULTS
HCV infection inhibits the expression of C3 complement component.
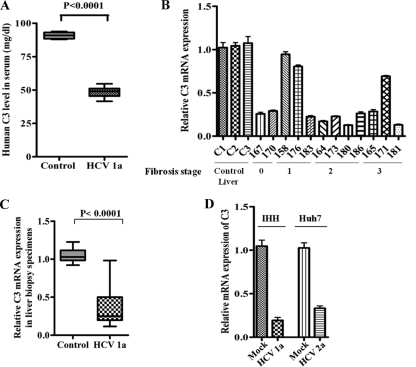
In order to investigate the role of HCV infection on C3 expression, we evaluated the total level of C3 protein by ELISA in 12 sera from chronically HCV-infected patients. Six sera from healthy individuals were included as controls for comparison. A significant reduction in total C3 levels was observed in patient sera compared to control levels (Fig. 1A), with the C3 levels from individual patient sera shown in Table 1. The levels of C3 mRNA in paired HCV-infected liver biopsy specimens were evaluated by real-time PCR analyses. For this, C3 mRNA status was measured from RNA extracted from liver biopsy samples. Nine out of 12 HCV-infected liver biopsy specimens exhibited a significant reduction in C3 mRNA expression (∼4-fold) compared with RNAs from healthy control human liver RNA (Fig. 1B). The reduction is further exemplified in the corresponding box diagram comparing pooled averages of mRNA expression levels between healthy and infected (patient) liver biopsy specimens (Fig. 1C). Three out of 12 patient liver biopsy specimens tested for C3 mRNA expression by real-time PCR did not show a reduction in C3 expression. However, C3 expression from corresponding patient sera showed a significant reduction in all 12 samples. We do not know the reason for this difference, which could be due to the variations in HCV-infected liver biopsy regions employed in the study or to the susceptibility of serum C3 to proteolytic cleavage. Further, the changes in the C3 level did not correlate with the liver fibrosis stage (shown at the bottom of the x axis in Fig. 1B) or with rheumatoid factor, serum albumin, or alkaline phosphatase levels in the blood of these patients (Table 1), as previously reported with altered C4 complement status (8). The levels of serum albumin and alkaline phosphatase for the 12 HCV patients used in our study were within the normal range. Only 2 out of 12 patients had elevated rheumatoid factor levels. Corresponding levels from noninfected samples were not considered because there was no observable deviation of these results from the normal range in infected samples.
Fig 1.
HCV infection transcriptionally represses C3 expression. (A) A significant reduction in total C3 expression among HCV genotype 1a-infected patient sera (n = 12) compared with sera from (n = 6) from healthy controls. (B and C) Downregulation of C3 mRNA expression in HCV genotype 1a-infected paired liver biopsy specimens (marked with 3-digit numbers) compared with non-HCV-infected control liver tissues (C1, C2, and C3) by real-time PCR. Results were normalized to endogenous 18S RNA and are shown as individual samples organized according to the fibrosis stage of the patient liver (B) as well as in a box plot (C) (P < 0.0001, as a group of experimental samples compared to controls using one-way ANOVA). (D) Estimation of C3 mRNA expression by real-time PCR from IHH infected with HCV genotype 1a or Huh7 cells infected with HCV genotype 2a. C3 mRNA expression in parental hepatocytes was arbitrarily set at 1, and the results for the infected hepatocytes were statistically significantly different (P < 0.0001) using one-way ANOVA.
Table 1.
Clinical and virological parameters of HCV infected patients included in the study
| Liver biopsy specimena | Sexb | Fibrosis stage | Grade of activity | HCV viral load (IU/ml) | Rheumatoid factor (amt [IU/ml]c | Serum albumin (g/dl)d | Alkaline phosphatase (U/liter)e | Total C3 level (mean ± SD [mg/dl]) |
|---|---|---|---|---|---|---|---|---|
| 158 | M | 1 | 6,687,000 | − | 4.6 | 85 | 46.8 ± 2.2 | |
| 164 | M | 2 | Mild activity, grade 2 | 1,095,730 | − | 4.8 | 82 | 46.6 ± 2.7 |
| 165 | F | 3 | Mild activity, grade 2 | 1,001,400 | − | 48.3 ± 1.4 | ||
| 167 | F | 0 | 928,400 | − | 4.3 | 82 | 52.2 ± 0.85 | |
| 170 | M | 0 | 69,000,000 | − | 50.7 ± 1.3 | |||
| 171 | F | 3 | Mild activity grade 2 | 2,69,0000 | − | 4.5 | 110 | 43.6 ± 1.6 |
| 173 | F | 2 | Periportal fibrosis, mild activity, grade 2 | 432,700 | + (240) | 4.5 | 84 | 49.8 ± 1.3 |
| 176 | M | 1 | Stage 1 activity | 1,87,2412 | − | 4.6 | 67 | 52.8 ± 1.4 |
| 180 | M | 1 | Stage 2 activity | 3,624,000 | − | 4.1 | 78 | 47.8 ± 2.8 |
| 181 | F | 3 | Stage 2 activity | 3,929,434 | − | 3.8 | 82 | 48.4 ± 1.7 |
| 183 | F | 1 | Mild activity, grade 2 | 160,700 | + (480) | 4.1 | 89 | 55.8 ± 1.6 |
| 186 | M | 2 | Stage 2 activity | 5,690,000 | − | 4.5 | 50 | 43.7 ± 2.9 |
All 12 patients were infected with HCV genotype 1a.
M, male; F, female.
The presence (+) or absence (−) of rheumatoid factor in blood is indicated.
The normal range is 3.4 to 5.5 g/dl.
The normal range is 33 to 133 U/liter.
We also measured C3 mRNA expression in hepatocytes infected with cell culture-grown HCV. A reduction in C3 expression was observed in IHH infected with HCV genotype 1a (clone H77) or in Huh7 hepatoma cells infected with HCV genotype 2a (clone JFH1) compared to mock-infected hepatocytes (Fig. 1D). Together, these results suggested that HCV infection inhibits C3 complement expression at the transcriptional level in hepatocytes, which is also reflected in the total C3 levels in paired chronically infected patient sera or liver biopsy specimens.
C3 complement synthesis is primarily regulated by HCV core and NS5A proteins.
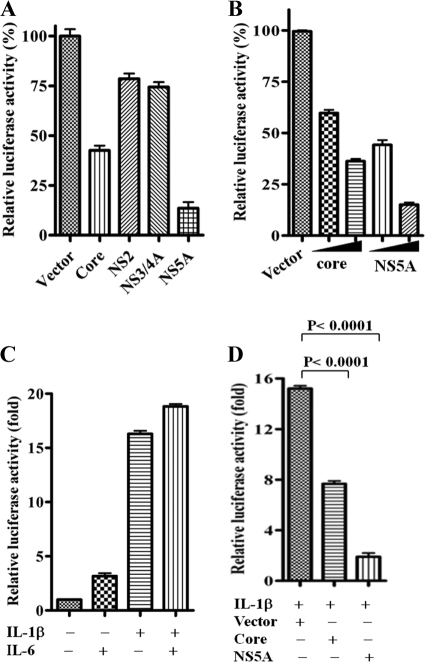
Since we observed an inhibition of C3 at the mRNA level, the role of the HCV core and nonstructural proteins was examined for C3 promoter regulation. For this, we used a C3 promoter construct with a luciferase reporter gene tag to identify specific HCV proteins involved in transcriptional regulation of C3 complement component. The C3 promoter-reporter construct was transfected into HepG2 cells along with plasmids encoding individual HCV proteins (core, NS2, NS3/4A, or NS5A). Cells were lysed 48 h after transfection, and promoter activity was measured by luciferase assay. Our results suggested that while C3 promoter activity was modestly inhibited by HCV core protein, it was significantly reduced in the presence of HCV NS5A protein (Fig. 2A). Since the luciferase-based promoter activity is highly sensitive, we did not consider a ∼25% reduction of luciferase activity from NS2 and NS3/4A DNA-transfected cells as significant. Thus, the results indicated that HCV NS5A protein and, to a lesser extent, core protein attenuate C3 promoter activity. Further study revealed that downregulation of C3 promoter activation occurred in a dose-dependent manner in cells transfected with HCV core or NS5A DNA (Fig. 2B). As with other acute phase proteins, the expression of C3 is regulated by IL-1β/IL-6 cytokines (17, 26, 27). We examined the effect of viral protein expression on C3 promoter activity in the presence of these cytokines. The level of C3 induction by IL-1β alone (∼16-fold) did not significantly improve upon addition of IL-6 (∼18-fold), whereas IL-6 alone induced C3 promoter activity by only ∼3-fold (Fig. 2C). We therefore used only IL-1β for induction of C3 expression in this study. Next, we examined the effect of HCV core and NS5A protein expression on IL-1β-induced C3 promoter activity. Our results suggested that IL-1β-induced C3 promoter activity is most significantly attenuated in HCV NS5A-expressing cells (Fig. 2D).
Fig 2.
HCV core and NS5A proteins inhibit C3 promoter activity. (A) Basal suppression of C3 promoter activity by HCV core and NS5A proteins in a luciferase reporter assay. In contrast, NS2 or NS3/4A did not display a major effect on C3 promoter activity. The results obtained were statistically significantly different (P < 0.0001) from the values of the vector control by an unpaired two-tailed t test. (B) Core and NS5A proteins downregulated C3 promoter activity in a dose-dependent manner (100 ng/well and 200 ng/well; the amount is indicated by the height of the black triangle below the bars). The results obtained were statistically significant (P < 0.0001) from the value of the vector control by an unpaired two-tailed t test. (C) IL-1β- and/or IL-6-mediated induction of C3 promoter activity. Results obtained were statistically significantly different (P < 0.0001) from the uninduced control using one-way ANOVA. (D) HCV core and NS5A proteins also suppressed IL-1β-induced C3 promoter activation.
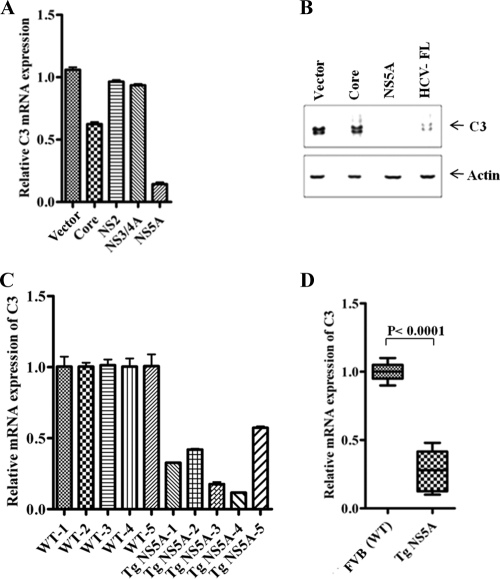
Next, we examined the role of HCV proteins in C3 mRNA expression in IL-1β-induced hepatocytes. IL-1β treatment of Huh7 cells expressing HCV NS5A exhibited ∼90% reduction in C3 mRNA expression (Fig. 3A). On the other hand, HCV core protein produced only a 40% reduction. HCV NS2 or NS3/4A did not cause a change in C3 mRNA expression, which further suggested their insignificant inhibitory effect on C3 promoter activity (Fig. 2A). We also investigated the effect of HCV core or NS5A protein or full-length gene expression on C3 protein status in IL-1β-treated hepatocytes by Western blot analysis (Fig. 3B). Our results indicated that the induction of C3 was significantly inhibited in NS5A DNA-transfected cells compared to core protein- or HCV FL-transfected cells. The fact that NS5A (without addition of IL-1β) significantly repressed C3 promoter activity (Fig. 2A) indicates that it may play an inhibitory role at the basal level of C3. However, the expression of C3 was almost undetectable by Western blot analysis in the absence of IL-1β (data not shown). We further verified C3 regulation at the transcriptional level in an in vivo system using NS5A-expressing transgenic mouse liver (25). C3 mRNA expression was significantly decreased in mouse liver expressing NS5A protein (Fig. 3C and D) compared to levels in normal littermates. The results are represented from individual mouse liver (Fig. 3C) and as a pooled average in a box diagram (Fig. 3D). This set of experiments indicated that HCV NS5A protein significantly represses complement C3 expression at both the mRNA and protein levels in transfected hepatocytes as well as in transgenic mouse liver.
Fig 3.
HCV NS5A expression downregulates C3 mRNA expression in human hepatocytes and in transgenic mouse liver. (A) Huh7 cells transfected with HCV core or NS5A protein-encoding plasmids followed by IL-1β treatment displayed significant reduction in C3 mRNA expression by real-time PCR. NS2 or NS3/4A as negative controls did not display any significant effect on C3 mRNA levels. 18S RNA was used as an endogenous control for normalization. C3 mRNA expression in parental hepatocytes was arbitrarily set at 1, and the comparative results are statistically significantly different (P < 0.0001, as a group of experimental samples using one-way ANOVA). (B) Western blot analysis of IL-1β-induced C3 expression in Huh7 cell lysates transfected with HCV protein DNA revealed NS5A-mediated C3 downregulation. (C) Reduction in C3 mRNA expression in transgenic mouse liver expressing HCV NS5A protein (TgNS5A; n = 5) by real-time PCR. Liver RNA from nontransgenic littermates (wild type [WT]) of the same genetic background (FVB; n = 5) was used as control for comparison. (D) Comparison of average values of TgNS5A C3 mRNA levels against FVB controls, arbitrarily set as 1. GAPDH was used as an endogenous control.
HCV infection downregulates C/EBP-β-mediated C3 promoter activation.
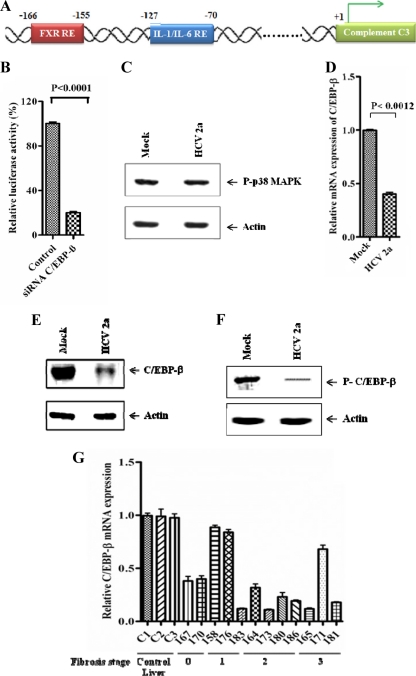
C/EBP-β, a member of the CCAAT/enhancer binding protein (C/EBP) family, is one of the key transcription factors responsible for induction of various acute-phase genes including C3 (17, 19, 42). C/EBP-β binding sites (IL-1/IL-6 RE) are critical response elements (Fig. 4A) responsible for IL-1β/IL-6-mediated C3 regulation (19, 26, 27, 42). The involvement of C/EBP-β as a transcription factor for C3 expression in hepatocytes was verified in HepG2 cells by using C/EBP-β small interfering RNA (siRNA). Knockdown of C/EBP-β reduced IL-1β-mediated C3 promoter activity (Fig. 4B). Previous reports suggested that activated p38 mitogen-activated protein kinase (MAPK) phosphorylates C/EBP-β, which is essential for its DNA-binding ability and transcriptional activity (4, 30). Phospho-p38 MAPK levels were unaltered in HCV genotype 2a-infected hepatocytes compared to levels in mock-infected cells (Fig. 4C), indicating that p38 MAPK activation is not affected in HCV-mediated C3 downregulation. Next, we studied mRNA and protein expression levels of C/EBP-β in virus-infected cell lysates. Real-time PCR and Western blot analyses suggested that the expression of total C/EBP-β is suppressed in hepatocytes infected with HCV (Fig. 4D and E). Recent studies in astrocytes suggested that p38 MAPK-dependent phosphorylation of C/EBP-β at Thr235 is required for IL-1β-mediated transcriptional activation of C3 promoter (26, 27). We investigated the phospho-C/EBP-β status in hepatocytes infected with HCV. A reduced expression of phospho-C/EBP-β in virus-infected hepatocytes was observed (Fig. 4F) and could be due to inhibition of total C/EBP-β expression. We further determined C/EBP-β mRNA levels in liver biopsy specimens from HCV-infected patients (Fig. 4G). The results closely followed C3 expression patterns (Fig. 1B) with a significant reduction in C/EBP-β mRNA levels in samples where C3 expression was inhibited, suggesting a link between C3 regulation and C/EBP-β expression. Interestingly, both C/EBP-β and C3 expression levels were unchanged in the same three liver biopsy specimens. Therefore, the inhibition of C3 expression by HCV appeared to be mediated by suppression of C/EBP-β, thereby rendering it ineffective as a transcriptional activator for C3 promoter.
Fig 4.
HCV infection inhibits C/EBP-β expression. (A) Schematic view of human C3 promoter containing FXR and IL-1/IL-6 response elements. (B) Knockdown of C/EBP-β by siRNA attenuated IL-1β-induced C3 promoter activation in HepG2 cells. (C) Phospho-p38 MAPK levels remained unchanged in HCV genotype 2a-infected Huh 7 cells compared with uninfected controls. Cellular actin was used for comparison of protein load in each lane. (D) Reduction in C/EBP-β mRNA level in Huh7 cells infected with HCV genotype 2a, as estimated by real-time PCR. 18S RNA was used as an endogenous control. (E and F) Western blot analysis for total C/EBP-β and phospho-C/EBP-β in hepatocytes infected with HCV genotype 2a. Cellular actin was used for comparison of protein load in each lane. (G) C/EBP-β mRNA expression status in liver biopsy specimens from chronically HCV-infected patients in comparison to non-HCV-infected control liver tissues (C1, C2, and C3) by real-time PCR (P < 0.0001 as a group of experimental samples compared to controls by one-way ANOVA). Results were normalized to endogenous 18S RNA and are shown as individual samples organized according to the fibrosis stage of the patient liver.
HCV core protein inhibits C3 promoter activation and FXR expression in hepatocytes.
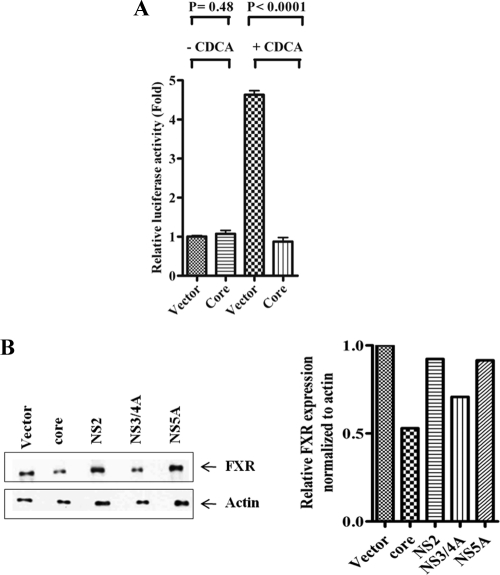
Farnesoid X receptor (FXR) is an intracellular bile acid-sensing transcription factor that regulates complement C3 expression by binding to a distinct FXR response element in the C3 promoter (22). FXR agonist CDCA activated C3 promoter, and the presence of HCV core protein inhibited CDCA-induced C3 promoter activation (Fig. 5A). Western blot analysis revealed that expression of FXR was modestly inhibited in HCV core and NS3/NS4A protein-expressing hepatocytes while remaining unchanged in hepatocytes transfected with NS2 and NS5A DNA (Fig. 5B). Thus, the results indicated that the HCV core and NS3/4A proteins weakly inhibit C3 synthesis by interfering with the optimal expression of FXR transcriptional factor.
Fig 5.
HCV core protein downregulates FXR promoter activation and suppresses FXR protein expression in human hepatocytes. (A) HCV core protein suppressed FXR-mediated C3 promoter activity induced by CDCA in a luciferase reporter assay. (B) Western blot analysis of Huh7 cell lysates transfected with HCV plasmid DNAs revealed core protein-mediated FXR downregulation. Cellular actin was used for comparison of protein load in each well. FXR expression in each band was quantified by normalizing values to corresponding actin levels using densitometric analysis.
HCV NS5A suppresses C/EBP-β expression in hepatocytes.
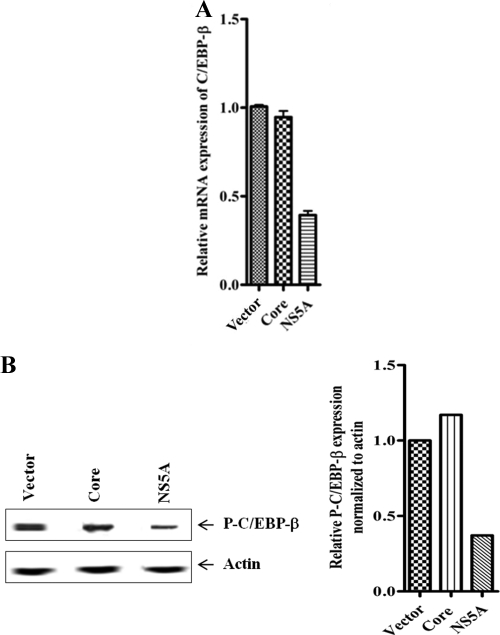
We examined mRNA expression levels of C/EBP-β in Huh7 cells transfected with plasmid DNA encoding HCV core or NS5A protein, followed by IL-1β treatment. Interestingly, a significant inhibition of C/EBP-β mRNA expression was observed in NS5A-transfected hepatocytes but not in core protein-transfected cells (Fig. 6A). Western blot analysis further revealed that IL-1β-mediated phospho-C/EBP-β expression was inhibited in NS5A-expressing hepatocytes compared to levels in mock-transfected cells. However, there was no detectable change in expression level of phospho-C/EBP-β in core protein-encoding DNA-transfected hepatocytes (Fig. 6B). Thus, the results suggested that the inhibitory effect of HCV NS5A protein is directed toward phospho-C/EBP-β expression, which in turn impairs IL-1β-mediated C3 transcriptional activation.
Fig 6.
HCV NS5A suppresses C/EBP-β expression in human hepatocytes. (A) C/EBP-β mRNA level was significantly suppressed in Huh7 cells transiently transfected with NS5A DNA in contrast to transfection with HCV core protein DNA. 18S RNA was used as an endogenous control. C/EBP-β mRNA expression in parental hepatocytes was arbitrarily set as 1, and the results obtained were statistically significantly different for NS5A-transfected cells (P < 0.0001) but not for core protein-transfected cells (P = 0.17) by an unpaired two-tailed t test. (B) Western blot analysis for detection of IL-1β-mediated phospho-C/EBP-β expression in core or NS5A DNA-transfected Huh7 cells. Mock-transfected cells served as controls. Cellular actin was used for comparison of protein load in each well. Phospho-C/EBP-β (P-C/EBP-β) expression in each band was quantified by normalizing values to corresponding actin levels using densitometric analysis.
DISCUSSION
In this study, we have observed that the C3 complement component is significantly reduced in serum and liver biopsy specimens from chronically HCV-infected patients. C3 complement reduction did not appear to be related to the viral load or the stage of liver disease from this set of randomly selected patients, as previously reported with the C4 status (8). Further, the C3 mRNA level was reduced in hepatocytes infected with cell culture-grown HCV genotype 1a or 2a. Our results suggested that HCV NS5A protein significantly downregulates IL-1β-induced C3 promoter activation. The expression of C/EBP-β, which is responsible for transcriptional regulation of IL-1β-mediated C3 expression, is inhibited in liver biopsy specimens, HCV-infected hepatocytes, or hepatocytes transfected with HCV NS5A DNA.
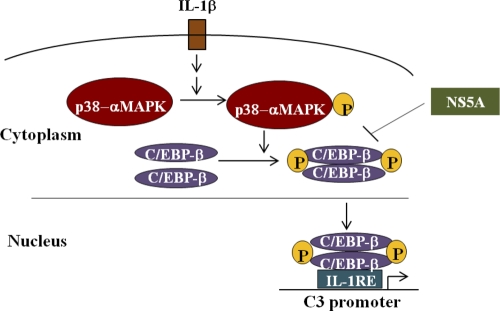
We have previously shown that HCV core and NS5A proteins display transcriptional regulatory roles on a number of cellular genes (1, 7, 24, 36). Furthermore, these two HCV proteins transcriptionally repress the C4 complement component by reducing expression of specific transcription factors involved at the basal level and gamma interferon (IFN-γ)-induced regulation (8). Other flaviviruses use their nonstructural NS1 protein to attenuate complement activation by either directly interacting with C4 (5) or recruiting C4b binding protein (6). In this study, we have shown that HCV NS5A protein significantly downregulates IL-1β-mediated C3 promoter activity. IL-1β binds to its cognate receptor and activates the MAP kinase signaling pathway, leading to phosphorylation and activation of p38 MAP kinase (Fig. 7). Phosphorylated p38-MAP kinase then activates the transcription factor C/EBP-β by phosphorylation, leading to its dimerization, and subsequent binding to IL-1/IL-6 response elements in the C3 promoter. Interestingly, we observed an inhibition of C/EBP-β mRNA expression in liver biopsy specimens. Phospho-C/EBP-β expression was inhibited in hepatocytes infected with cell culture-grown HCV. We also observed that phospho-C/EBP-β levels were not enhanced upon treatment of NS5A DNA-transfected hepatocytes with IL-1β compared with mock-transfected controls. Although HCV core protein modestly reduced C3 expression, phospho-C/EBP-β expression remained unchanged in IL-1β-treated core protein-transfected hepatocytes.
Fig 7.
Schematic diagram depicting the possible mechanism of HCV NS5A-induced C3 complement suppression in human hepatocytes.
Chronic HCV infection is a leading cause of hepatic cirrhosis and hepatocellular carcinoma. Typically 108 to 1011 copies of HCV RNA are present per gram of liver tissue during chronic HCV infection (41). However, the proportion of hepatocytes infected with HCV is apparently very low due to difficulties in detecting viral RNA in situ or very low expression levels of viral antigens. Although HCV RNA has been identified in hepatocytes from patients with chronic infection (32), only a small number of cells are found to express viral antigens by using conventional immunohistochemical methods or fluorescence microscopy (21, 39). A combination of 2-photon (2-PE) microscopy and virus-specific, fluorescent, semiconductor quantum dot (Qdot) probes has been used to determine the proportion of virus-infected hepatocytes (23). The results revealed expression of core antigen in up to 20% of hepatocytes in tissues from chronically infected patients with maximal plasma virus RNA loads of ∼106 IU/ml. However, the actual number of infected hepatocytes in patients with significant viral RNA loads may be greater than the sensitivity of the available detection procedures. This is relevant as we have observed significant changes in C3, C4, and other complement components (C1s, factor H, and C9) (unpublished observations) in liver biopsy specimens of chronically HCV-infected patients.
The complement system has been shown to contribute to the protection of the host from virus infection (28). Cold activation of complement (loss of hemolytic activity in serum during storage at low temperature) was observed in patients with chronic HCV infection, contributed to HCV-associated liver damage, and was useful in monitoring responses to interferon therapy in these patients (2, 13, 31). HCV core protein has been shown to bind with the gC1q receptor (gC1qR) on activated human peripheral blood T cells, causing inhibition of the T cell response (20, 43) by increasing the frequency of gC1qR+ CD4+ T cells (14). Here, we observed that HCV core protein modestly repressed C3 expression by downregulating FXR, another transcription factor that binds to a specific site outside IL-1/IL-6 RE for C3 expression.
In this study, our results from liver biopsy specimens of chronically HCV-infected patients, HCV-infected hepatocytes, and transgenic mouse liver expressing HCV proteins offer a novel aspect of complement regulation by HCV and, more specifically, by the NS5A protein. HCV NS5A protein exhibits a major role upon synthesis of complement components through modulation of transcriptional factors. Further studies will help in understanding additional unique mechanisms of complement regulation by HCV proteins and in identifying targets for therapeutic potential.
ACKNOWLEDGMENTS
We thank John Atkinson, Arup Banerjee, Bob Belshe, and Mike Diamond for helpful suggestions and Lin Cowick for preparation of the manuscript.
This work was supported by research grants AI068769 (R.R.), DK80812 (R.R.), and U54-AI057160 to the Midwest Regional Center of Excellence for Biodefense and Emerging Infectious Diseases Research from the National Institutes of Health.
Footnotes
Published ahead of print 14 December 2011
REFERENCES
- 1. Ait-Goughoulte M, et al. 2010. Hepatitis C virus core protein interacts with fibrinogen-beta and attenuates cytokine stimulated acute-phase response. Hepatology 51:1505–1513 [DOI] [PMC free article] [PubMed] [Google Scholar]
- 2. Akahane Y, et al. 1996. Cold activation of complement for monitoring the response to interferon in patients with chronic hepatitis C. Am. J. Gastroenterol. 91:319–327 [PubMed] [Google Scholar]
- 3. Ali OS, Abo-Shadi MA, Hammad LN. 2005. The biological significance of serum complements C3 and C4 in HCV-related chronic liver diseases and hepatocellular carcinoma. Egypt. J. Immunol. 12:91–99 [PubMed] [Google Scholar]
- 4. Aouadi M, et al. 2007. p38MAP Kinase activity is required for human primary adiposcyte differentiation. FEBS Lett. 581:5591–5596 [DOI] [PubMed] [Google Scholar]
- 5. Avirutnan P, et al. 2010. Antagonism of the complement component C4 by flavivirus nonstructural protein NS1. J. Exp. Med. 207:793–806 [DOI] [PMC free article] [PubMed] [Google Scholar]
- 6. Avirutnan P, et al. 2011. Binding of flavivirus nonstructural protein NS1 to C4b binding protein modulates complement activation. J. Immunol. 187:424–433 [DOI] [PMC free article] [PubMed] [Google Scholar]
- 7. Banerjee A, Ray RB, Ray R. 2010. Oncogenic potential of hepatitis C virus proteins. Viruses 2:2108–2133 [DOI] [PMC free article] [PubMed] [Google Scholar]
- 8. Banerjee A, et al. 2011. Transcriptional repression of C4 complement by hepatitis C virus proteins. J. Virol. 85:4157–4166 [DOI] [PMC free article] [PubMed] [Google Scholar]
- 9. Basu A, Meyer K, Ray RB, Ray R. 2002. Hepatitis C virus core protein is necessary for the maintenance of immortalized human hepatocytes. Virology 298:53–62 [DOI] [PubMed] [Google Scholar]
- 10. Baumann H, Gauldie J. 1994. The acute phase response. Immunol. Today 15:74–80 [DOI] [PubMed] [Google Scholar]
- 11. Carroll MC. 2004. The complement system in regulation of adaptive immunity. Nat. Immunol. 5:981–986 [DOI] [PubMed] [Google Scholar]
- 12. Castell JV, et al. 1989. Interleukin-6 is the major regulator of acute phase protein synthesis in adult human hepatocytes. FEBS Lett. 242:237–239 [DOI] [PubMed] [Google Scholar]
- 13. Charles ED, Dustin LB. 2009. Hepatitis C virus-induced cryoglobulinemia. Kidney Int. 76:818–824 [DOI] [PMC free article] [PubMed] [Google Scholar]
- 14. Cummings KL, Rosen HR, Hahn YS. 2009. Frequency of gC1qR+ CD4+ T cells increases during acute hepatitis C virus infection and remains elevated in patients with chronic infection. Clin. Immunol. 132:401–411 [DOI] [PMC free article] [PubMed] [Google Scholar]
- 15. Gabay C, Kushner I. 1999. Acute-phase proteins and other systemic responses to inflammation. N. Engl. J. Med. 340:448–454 [DOI] [PubMed] [Google Scholar]
- 16. Heinrich PC, Castell JV, Andus T. 1990. Interleukin-6 and the acute-phase response. Biochem. J. 265:621–636 [DOI] [PMC free article] [PubMed] [Google Scholar]
- 17. Juan TS, Wilson DR, Wilde MD, Darlington GJ. 1993. Participation of the transcription factor C/EBP delta in the acute-phase regulation of the human gene for complement component C3. Proc. Natl. Acad. Sci. U. S. A. 90:2584–2588 [DOI] [PMC free article] [PubMed] [Google Scholar]
- 18. Kanda T, et al. 2006. Generation of infectious hepatitis C virus in immortalized human hepatocytes. J. Virol. 80:4633–4639 [DOI] [PMC free article] [PubMed] [Google Scholar]
- 19. Kawamura N, Singer L, Wetsel RA, Colten HR. 1992. Cis-and trans-acting elements required for constitutive and cytokine-regulated expression of the mouse complement C3 gene. Biochem. J. 283:705–712 [DOI] [PMC free article] [PubMed] [Google Scholar]
- 20. Kittlesen DJ, Chianese-Bullock KA, Yao ZQ, Braciale TJ, Hahn YS. 2000. Interaction between complement receptor gC1qR and hepatitis C virus core protein inhibits T-lymphocyte proliferation. J. Clin. Invest. 106:1239–1249 [DOI] [PMC free article] [PubMed] [Google Scholar]
- 21. Krawczynski K, et al. 1992. Hepatitis C virus antigen in hepatocytes: immunomorphologic detection and identification. Gastroenterology 103:622–629 [DOI] [PubMed] [Google Scholar]
- 22. Li J, Pircher PC, Schulman IG, Westin SK. 2005. Regulation of complement C3 expression by the bile acid receptor FXR. J. Biol. Chem. 280:7427–7434 [DOI] [PubMed] [Google Scholar]
- 23. Liang Y, et al. 2009. Visualizing hepatitis C virus infections in human liver by two-photon microscopy. Gastroenterology 137:1448–1458 [DOI] [PubMed] [Google Scholar]
- 24. Majumder M, Ghose AK, Steele R, Ray R, Ray RB. 2001. Hepatitis C virus NS5A physically associates with p53 and regulates p21/waf1 gene expression in a p53-dependent manner. J. Virol. 75:1401–1407 [DOI] [PMC free article] [PubMed] [Google Scholar]
- 25. Majumder M, et al. 2003. Expression of hepatitis C virus non-structural 5A protein in the liver of transgenic mice. FEBS Lett. 555:528–532 [DOI] [PubMed] [Google Scholar]
- 26. Maranto J, Rappaport J, Dutta PK. 2008. Regulation of complement component C3 in astrocytes by IL-1b and morphine. J. Neuroimmune Pharmacol. 3:43–51 [DOI] [PubMed] [Google Scholar]
- 27. Maranto J, Rappaport J, Dutta PK. 2011. Role of C/EBP-β, p38 MAPK and MKK6 in IL-1β-mediated C3 gene regulation in astrocytes. J. Cell. Biochem. 112:1168–1175 [DOI] [PMC free article] [PubMed] [Google Scholar]
- 28. Mehlhop E, Diamond MS. 2006. Protective immune responses against West Nile virus are primed by distinct complement activation pathways. J. Exp. Med. 203:1371–1381 [DOI] [PMC free article] [PubMed] [Google Scholar]
- 29. Moon MR, et al. 1999. Complement component C3 production in IL-1β-stimulated human intestinal epithelial cells is blocked by NF-κB inhibitors and by transfection with ser 32/36 mutant IκBα. J. Surg. Res. 82:48–55 [DOI] [PubMed] [Google Scholar]
- 30. Nakajima T, et al. 1993. Phosphorylation at threonine-235 by a ras-dependent mitogen-activated protein kinase cascade is essential for transcription factor NF-IL6. Proc. Natl. Acad. Sci. U. S. A. 90:2207–2211 [DOI] [PMC free article] [PubMed] [Google Scholar]
- 31. Nomura H, et al. 1997. Hepatitis C virus-related liver damage is related to cold activation of complement. J. Clin. Gastroenterol. 25:529–534 [DOI] [PubMed] [Google Scholar]
- 32. Pal S, et al. 2006. Intrahepatic hepatitis C virus replication correlates with chronic hepatitis C disease severity in vivo. J. Virol. 80:2280–2290 [DOI] [PMC free article] [PubMed] [Google Scholar]
- 33. Poli V. 1998. The role of C/EBP isoforms in the control of inflammatory and native immunity functions. J. Biol. Chem. 273:29279–29282 [DOI] [PubMed] [Google Scholar]
- 34. Qin X, Gao B. 2006. The complement system in liver diseases. Cell. Mol. Immunol. 3:333–340 [PubMed] [Google Scholar]
- 35. Ramadori G, Christ B. 1999. Cytokines and the hepatic acute-phase response. Semin. Liver Dis. 19:141–155 [DOI] [PubMed] [Google Scholar]
- 36. Ray RB, Steele R, Meyer K, Ray R. 1997. Transcriptional repression of p53 promoter by hepatitis C virus core protein. J. Biol. Chem. 272:10983–10986 [DOI] [PubMed] [Google Scholar]
- 37. Ray RB, Meyer K, Ray R. 2000. Hepatitis C virus core protein promotes immortalization of primary human hepatocytes. Virology 271:197–204 [DOI] [PubMed] [Google Scholar]
- 38. Ricklin D, Hajishengallis G, Yang K, Lambris JD. 2010. Complement: a key system for immune surveillance and homeostasis. Nat. Immunol. 11:785–797 [DOI] [PMC free article] [PubMed] [Google Scholar]
- 39. Sansonno D, Lauletta G, Dammacco F. 2004. Detection and quantitation of HCV core protein in single hepatocytes by means of laser capture microdissection and enzyme-linked immunosorbent assay. J. Viral Hepat. 11:27–32 [DOI] [PubMed] [Google Scholar]
- 40. Stapp JM, Sjoelund V, Lassiter HA, Feldhoff RC, Feldhoff PW. 2005. Recombinant rat IL-1β and IL-6 synergistically enhance C3 mRNA levels and complement component C3 secretion by H-35 rat hepatoma cells. Cytokine 30:78–85 [DOI] [PubMed] [Google Scholar]
- 41. Sugano M, et al. 1995. Quantitation of hepatitis C viral RNA in liver and serum samples using competitive polymerase chain reaction. J. Clin. Pathol. 48:820–825 [DOI] [PMC free article] [PubMed] [Google Scholar]
- 42. Wilson DR, Juan TS, Wilde MD, Fey GH, Darlington GJ. 1990. A 58-base-pair region of the human C3 gene confers synergistic inducibility by interleukin-1 and interleukin-6. Mol. Cell. Biol. 10:6181–6191 [DOI] [PMC free article] [PubMed] [Google Scholar]
- 43. Yao ZQ, Nguyen DT, Hiotellis AI, Hahn YS. 2001. Hepatitis C virus core protein inhibits human T lymphocyte responses by a complement-dependent regulatory pathway. J. Immunol. 167:5264–5272 [DOI] [PubMed] [Google Scholar]


