Abstract
Hepatitis C virus (HCV) is one of the main causes of chronic liver disease. Although infection of hepatocytes is mainly responsible for manifestations of hepatitis C, the virus also invades the immune system by a yet-to-be-identified mechanism. Using human T cell lines and primary T lymphocytes as targets and patient-derived HCV as inocula, we aimed to identify how HCV gains entry into these cells. HCV replication was determined by detection of the HCV RNA replicative (negative) strand and viral proteins, while specific antibodies, knocking down gene expression and making otherwise-resistant cells prone to HCV, were employed to identify a receptor molecule determining T lymphocyte permissiveness to HCV infection. The results revealed that T cell susceptibility to HCV requires CD5, a lymphocyte-specific glycoprotein belonging to the scavenger receptor cysteine-rich family. Blocking of T cell CD5 with antibody or silencing with specific short hairpin RNA (shRNA) decreased cell susceptibility to HCV, while increasing CD5 expression by mitogen stimulation had the opposite effect. Moreover, transfection of naturally CD5-deficient HEK-293 fibroblasts with CD5 facilitated infection of these otherwise HCV-resistant cells. In contrast to T cells, hepatocytes do not express CD5. The data revealed that CD5 is a molecule important for HCV entry into human T lymphocytes. This finding provides direct insight into the mechanism of HCV lymphotropism and defines a target for potential interventions against HCV propagating in this extrahepatic compartment.
INTRODUCTION
Hepatitis C virus (HCV) infects over 170 million people globally and causes chronic hepatitis in up to 80% of patients, a condition that can progress to cirrhosis and liver cancer and that is the leading reason for liver transplantation. Although HCV is conventionally known to infect hepatocytes, a significant body of molecular and clinical evidence indicates that HCV also invades and replicates in cells of the immune system (3, 6, 8, 13, 17, 30, 31). These cells may in turn serve as a reservoir in which biologically competent virus persists.
The ability of HCV to infect human cells is currently interpreted in the context of the interactions identified between HCV strain JFH-1 or HCV pseudoparticles and human hepatocarcinoma cell lines. Based on these data, tetraspanin CD81 (1), glycosaminoglycans (12), scavenger receptor class B type 1 (SR-B1) (1, 15), and the tight-junction proteins claudin 1 (9) and occludin (2, 19, 35) have been proposed to be involved in HCV entry into human hepatocytes. On the other hand, the factors determining HCV lymphotropism remain entirely unknown. Analysis of HCV compartmentalization in infected patients demonstrated virus replication in both T and B lymphocyte subsets (7, 16, 28, 31, 33). The susceptibility of normal human T lymphocytes to infection in vitro with patient-derived HCV and their ability to support the entire cycle of HCV replication have been shown (22, 23). The propensity of HCV to infect the immune system is consistent with a significantly greater prevalence of lymphoproliferative disorders, such as non-Hodgkin's lymphoma and mixed cryoglobulinemia, and perhaps mucosa-associated lymphoid tissue lymphoma, in patients infected with HCV (4, 10, 13, 40, 42). It also is possible that HCV residing in immune cells, like other persistent viral infections (5, 14, 26, 29), is an important contributor to long-term virus persistence and that the infected immune cells are reservoirs from which infection can spread, for example, in patients grafted with new livers due to HCV-related end-stage disease or in recipients of seemingly HCV-negative donor organs (24, 25, 39).
MATERIALS AND METHODS
Cells.
Peripheral blood mononuclear cells (PBMC) were isolated from two healthy donors who had no history or molecular evidence of HCV exposure, as confirmed by HCV RNA analysis of sera by reverse transcription (RT)-PCR/nucleic acid hybridization (NAH) assay with a sensitivity of <10 virus genome equivalents (vge) per ml and the absence of anti-HCV antibody by enzyme immunoassay (Abbott Molecular, Mississauga, Ontario, Canada) (23, 33). Primary T lymphocytes were affinity purified from monocyte-depleted PBMC by negative selection using MACS magnetic microbeads (Miltenyi Biotec, Auburn, CA), as reported previously (22, 32). The T cells were 97 to 98% pure by flow cytometry. In some experiments, PBMC and primary T cells were stimulated with 5 μg/ml phytohemagglutinin (PHA) (Sigma-Aldrich, Oakville, Ontario, Canada) for 72 h in the presence of 20 IU/ml human recombinant interleukin-2 (rIL-2) (Roche Molecular Diagnostics, Pleasanton, CA), as reported previously (23, 33). Molt4 (CRL-1582) and Jurkat (TIB-152) cells were acquired from the American Type Culture Collection (ATCC) (Manassas, VA). PM1 cells were supplied by the National Institutes of Health AIDS Research and Reference Reagent Program (Rockville, MD) and CCRF-CEM cells (CEM) (ACC-240) by the Deutsche Sammlung von Mikroorganismen und Zellkulturen GmbH (Braunschweig, Germany). The Molt4, Jurkat, and CEM cell lines were originally derived from patients with acute T lymphoblastic leukemia (11), while PM1 cells were originally from a patient with acute cutaneous T cell lymphoma (21). The cells were cultured at 1 × 10⁵ cells/well in 5 ml of culture medium containing RPMI 1640 supplemented with 10% heat-inactivated fetal calf serum, 2 mM glutamine, and 0.1 mM nonessential amino acids, all from Invitrogen Life Technologies (Burlington, Ontario, Canada). In some experiments, the cells were stimulated for 72 h with phorbol myristate acetate (PMA) (Sigma-Aldrich) at 50 ng/ml in the presence of 500 ng/ml ionomycin (Sigma-Aldrich). In preliminary experiments, this treatment was found to be noncytopathic and efficiently augmented CD5 expression on the T cell lines investigated (Table 1). Cells not exposed to PMA/ionomycin, but cultured under the same conditions, served as controls.
Table 1.
CD5 and CD81 protein expression following T cell stimulation
| Cell type | % Positivity (MFI) |
|||
|---|---|---|---|---|
| CD5 |
CD81 |
|||
| Untreated | Treateda | Untreated | Treateda | |
| Molt4 | 99.8 (84) | 100 (104) | 99.8 (106) | 96.4 (54) |
| Jurkat | 97 (77) | 100 (103) | 98.8 (171) | 66.3 (38) |
| PM1 | 10 (18.8) | 53.6 (30.1) | 95.4 (107) | 80.0 (57) |
| CEM | 6.3 (6.4) | 20.6 (14.5) | 97.7 (166) | 55.7 (79) |
| PBMC | 68 (45) | 86 (70) | 98.9 (260) | NTb |
| Primary T cells | 86 (56) | 97 (75) | 99.8 (213) | NT |
T cell lines were treated with PMA (50 ng/ml) and ionomycin (500 ng/ml) for 72 h, whereas monocyte-depleted PBMC and T cells affinity purified from those PBMC were cultured in the presence of PHA (5 μg/ml) and IL-2 (20 IU/ml) for 72 h. The percentages of CD5- or CD81-positive cells were determined in untreated and treated cells by flow cytometry using the respective specific antibodies and an appropriate isotype antibody as controls. MFI values were read from flow cytometry plots.
NT, not tested.
Human hepatoma Huh7 cells, naive or carrying the HCV AB12-A2 replicon, were kindly provided by Joyce Wilson and Christopher Richardson (formerly from the Ontario Cancer Institute, Toronto, Ontario, Canada), while Huh7.5 cells infected with HCV JFH-AM2, a recombinant strain of HCV JFH-1 carrying a synonymous mutation at nucleotide 1681 of E2 and one nonsynonymous mutation each in the E2, p7, NS2, and NS5A sequences, were provided by Rodney Russell from Memorial University (St. John's, Newfoundland, Canada) (36). These cells served as positive HCV detection controls in selected experiments. Human hepatoma HepG2 cell (HB-8065) and human embryonic kidney 293 fibroblast (HEK-293 or 293 cells; CRL-1573) lines were supplied by ATCC. The hepatoma cell lines were maintained in Dulbecco's modified Eagle's medium (DMEM) supplemented with 10% fetal calf serum. Primary human hepatocytes isolated by microperfusion of a healthy portion of the liver of a 58-year old male donor were supplied by Dominion Pharmakine (Derio-Bizkaia, Spain).
HCV inocula.
Plasma from 5 patients (3 males and 2 females between 44 and 54 years old) with progressing chronic hepatitis C (CHC) and carrying HCV genotype 1a or 1b at levels of 1.1 × 10⁵ to 4.3 × 10⁷ vge/ml served as HCV infectious inocula (Table 2). PBMC from these individuals contained HCV at 2 × 10³ to 2.8 × 10⁵ vge/μg total RNA (Table 2). In some experiments, HCV strain JFH-1, derived from Huh7 hepatoma cells, was used as the inoculum (41).
Table 2.
Virological characteristics of patients with chronic hepatitis C whose plasma served as HCV inocula
| Patient (age [yr]/sexa) | HCV genotype | Plasma HCV RNA load (vge/ml)b | PBMC HCV RNA load (vge/μg total RNA)b |
|---|---|---|---|
| 47/F | 1a | 1.1 × 10⁵ | 1.8 × 10⁴ |
| 52/M | 1a | 8.6 × 10⁵ | 2 × 10³ |
| 51/M-a | 1a | 2.9 × 10⁷ | 2.8 × 10⁴ |
| 51/M-b | 1a | 7.3 × 10⁵ | NAc |
| 44/M | 1a | 5 × 10⁶ | 1.6 × 10³ |
| 54/F | 1b | 8.3 × 10⁴ | 1.1 × 10⁵ |
M, male; F, female. a and b, samples a and b, collected 1 year apart.
HCV RNA positive strand measured by real-time RT-PCR using RNA extracted from 250 μl of plasma or 1 μg of total RNA from PBMC.
NA, not available.
HCV infection assay.
Cultured T cell lines, either naive or stimulated with PMA/ionomycin for 72 h at 1 × 10⁵ cells/well; PHA-stimulated monocyte-depleted PBMC; and primary T lymphocytes at 1 × 10⁶ cells/well were supplemented with 5 ml of culture medium in 6-well plates and exposed for 24 h to HCV-positive plasma at ∼1 × 10⁵ HCV vge, to an equivalent volume of normal human plasma as a control, or, in some experiments, to ∼1 × 10⁴ vge of JFH-1 virus. Then, the cells were extensively washed, suspended in fresh culture medium, and cultured for 4 to 5 days postinfection (p.i.). In the case of PBMC and primary T cells exposed to HCV, the culture medium was alternatively supplemented with PHA (5 μg/ml; Sigma-Aldrich) or PHA and rIL-2 (20 IU/ml; Roche), and the cells were maintained in culture for 14 days, as reported by in our previous studies (22, 23).
Inhibition of HCV infection in T cells by treatment with telaprevir.
Telaprevir (TLPV), or VX-950, an HCV-specific protease inhibitor, was purchased from Vertex Pharmaceuticals (Cambridge, MA) and used to treat Molt4 T cells infected with wild-type HCV (18). In preliminary experiments, naïve Molt4 cells were exposed to increasing concentrations of TLPV ranging from 0.8 to 80 μM in the presence of 0.5% dimethyl sulfoxide (DMSO) for 7 days to determine non-cell-toxic concentrations. Cell numbers and viability were determined by trypan blue exclusion using a Countess cell counter (Invitrogen). TLPV concentrations equal to or below 4 μM were found to be nontoxic. Accordingly, 2 × 10⁵ Molt4 cells were incubated in duplicate with plasma-derived HCV in the presence or absence of 1 μM and 4 μM TLPV in 0.5% DMSO. Then, cells were harvested after 7 days p.i. for evaluation of HCV RNA positive- and negative-strand expression. Molt4 cells exposed to HCV and incubated in RPMI medium supplemented with 0.5% DMSO in the absence of TLPV were used as infection controls.
Inhibition of HCV infectivity with anti-CD5 and anti-CD81 antibodies.
In order to ascertain the roles of CD5 and CD81 in HCV entry into T cells, Molt4 cells at 1 × 10⁵ cells/reaction were incubated for 30 min at 4°C and then for 30 min at 37°C with either anti-CD5 monoclonal antibody (MAb) (clone CD5-5D7; Invitrogen), anti-CD81 MAb (clone JS-81; BD Biosciences Pharmingen, Mississauga, Canada), or an appropriate isotype antibody control at 2.5 μg in 50 μl of culture medium. The treated cells were transferred to a 6-well plate, supplemented with 5 ml culture medium, and inoculated with a patient's plasma containing approximately 1 × 10⁵ HCV genome copies or, in some experiments, with ∼1 × 10⁴ vge JFH-1. After 24 h, the cells were extensively washed and supplemented with fresh culture medium and, after 4 to 5 days of culture, harvested for analysis.
Silencing of CD5 by RNA interference.
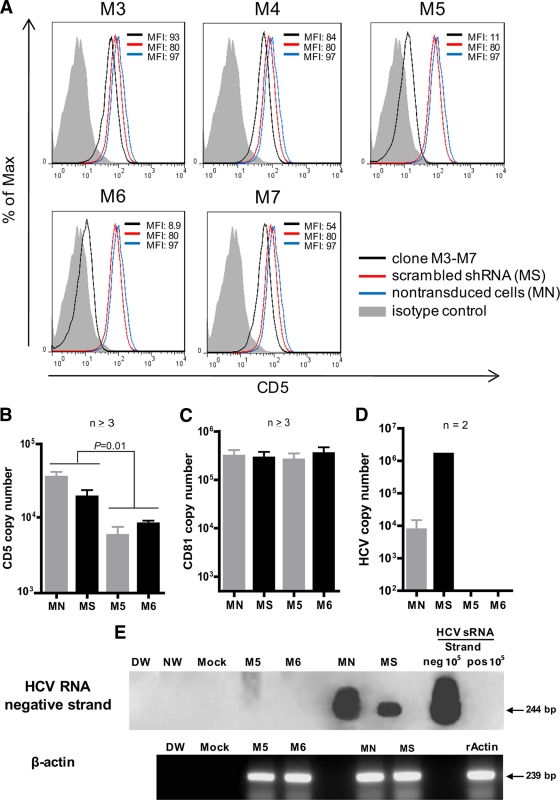
Lentiviral transduction particles carrying 5 different human CD5 short hairpin RNAs (shRNAs) (clones TRCN0000057653 to TRCN0000057657, designated M-3 to M-7) with a titer between 1.5 × 10⁷ and 2.2 × 10⁷ infectious viruses, together with nontarget control transduction particles (SHC001V), were prepared by Sigma-Aldrich. The particles were used to transduce 1 × 10³ Molt4 cells in 100 μl RPMI 1640 medium at multiplicities of infection of 1, 3, and 5 in 96-well plates in the presence of 2.5 μg/ml Polybrene (Sigma-Aldrich). The cells were incubated for 24 h at 37°C and then allowed to revive in fresh medium for 24 h. Successfully transduced cells were selected in the presence of 1.7 μg/ml puromycin (Sigma-Aldrich) for 7 days. The level of CD5 knockout was determined by flow cytometry with anti-CD5 MAb. Clones M-5 and M-6 showed the greatest inhibition of CD5 protein expression (see Fig. 5) and were used as targets in HCV infection experiments following the procedure described above.
Fig 5.
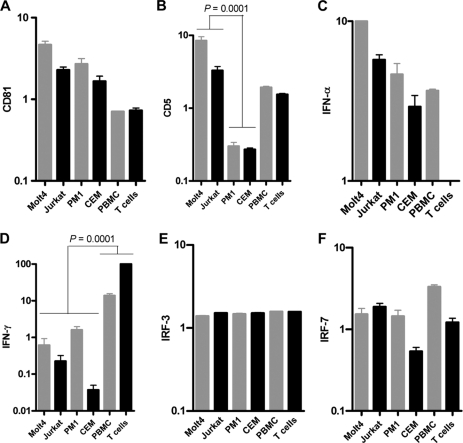
Expression of CD81, CD5, IFN-α, IFN-γ, IRF-3, and IRF-7 genes quantified in T cell lines, PBMC, and primary T cells by real-time RT-PCR using an equivalent of 50 ng total RNA per reaction. The expression levels were normalized against that of β-actin. The data bars show mean values and standard deviations (SD) of normalized copies of the gene of interest.
Cloning of CD5 and transfection of HEK-293 cells.
The complete CD5 cDNA sequence was amplified using total RNA from normal human PBMC and primers 5′-GCAGATCTATGCCCATGGGGTCTCTGC-3′ (sense) and 5′-GCGAATTCTTAGGAGGAGCGATGCAGAACC-3′ (antisense) containing BglII and EcoRI restriction sites (underlined), respectively, at 95°C for 30 s (denaturation), 59°C for 30 s (annealing), and 72°C for 90 s (extension) for 40 cycles. The 1,444-bp amplicon was cloned using the PCRII TOPO TA system (Invitrogen), and the excised fragment was sequenced in both directions. The resulting sequence was identical to that of human CD5 deposited in GenBank under accession number NM-14207. To create a transcription vector, the CD5 DNA was excised from the TOPO TA by digestion with EcoRI and Bglll restriction enzymes and ligated into the pIRES2-EGFP vector encoding enhanced green fluorescent protein (GFP) (BD Biosciences, Clontech, Mountain View, CA). Escherichia coli DH5α cells were transformed with the pIRES2-EGFPCD5 construct, cultured, and enriched in LB kanamycin agar and then in broth. Plasmid DNA was purified using a Qiaquik kit (Invitrogen).
HEK-293 cells, which naturally do not express CD5 and are not susceptible to HCV, were grown to 70% confluence in a 6-well plate and transfected with 4 μg of pIRES2-EGFPCD5 vector or with empty vector in the presence of 10 μl Lipofectamine in 250 μl Opti-MEM (both from Invitrogen). After 24 h, the cells were supplemented with fresh medium and left to revive for 6 h. Transfection efficiency was evaluated by GFP positivity via fluorescence microscopy. CD5 gene expression was ascertained in transfected 293 cells by RT-quantitative PCR, while CD5 protein was determined by flow cytometry and confocal microscopic analyses. For HCV infection, the cells were exposed to plasma containing ∼1 × 10⁶ HCV genome copies or to ∼1 × 10⁴ vge JFH-1. The inocula were removed after 48 h, and the cells were extensively washed, supplemented with fresh medium, and cultured for 4 to 8 days p.i. prior to analysis.
RNA extraction and cDNA synthesis.
Total RNA was extracted from 5 × 10⁶ to 1 × 10⁷ cells or 300 μl cell culture supernatant with TRIzol or TRIzol LS, respectively (Invitrogen). Mock extractions were performed in parallel as contamination controls (33). RNA predestined for quantification of cellular-gene expression was treated with DNase and transcribed to cDNA with Moloney murine leukemia virus reverse transcriptase (Invitrogen) as reported previously (33).
Detection of the HCV genome by RT-PCR/NAH.
The HCV genome was detected by PCR using cDNA derived from 1 or 2 μg of total RNA and primers against the HCV 5′ untranslated region (UTR) and the virus E2 region as described previously (33). The PCR cycling parameters were as detailed previously (33). Contamination controls routinely included a water sample instead of test cDNA, a mock extraction, and cDNA derived from PBMC of a healthy donor or from Molt4 or Jurkat cells exposed to normal human plasma (NHP) (mock infection). As positive controls, cDNAs from PBMC of patients with CHC who provided HCV inocula and the cloned HCV 5′-UTR-E2 (rHCV UTR-E2) fragment for this study were used (33). The specificity of the signal detection and the validity of controls were always confirmed by amplicon hybridization with a 32P-labeled recombinant HCV UTR-E2 fragment (33). The sensitivity of this assay was generally <10 vge/ml (<2 IU/ml) or <5 vge/μg of total RNA. In addition, when feasible, the HCV genome was also evaluated by real-time PCR using a LightCycler 480 (Roche Diagnostics, Mannheim, Germany) under previously established conditions (33).
Detection of HCV replication by Tth-based RT-PCR/NAH assay.
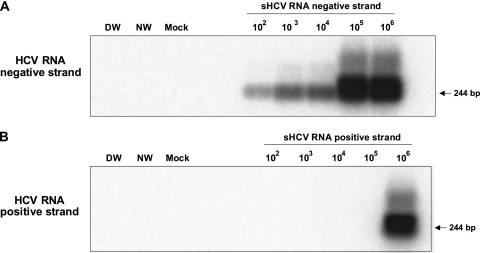
The HCV RNA negative (replicative) strand was determined by a strand-specific RT-PCR/NAH assay using rTth DNA polymerase (33). This enzyme catalyzes the polymerization of nucleotides into DNA using an RNA template in the 5′→3′ direction in the presence of manganese and the polymerization of nucleotides into duplex DNA in the 5′→3′ direction in the presence of magnesium. The details of the assay were described previously (33). The contamination controls were the same as those described above for the standard HCV genome detection assay. The PCR cycling parameters were as reported previously (33). The specificity of the assay comes from the RT step, in which a single HCV genome-specific sense primer (denoted UTR1 in reference 33) was used to prime the synthesis of HCV cDNA from the viral RNA template. Subsequently, the first-round (direct) PCR was initiated by the addition of the HCV-specific antisense primer (denoted RTU1 in reference 33). In this negative-strand detection assay, 10-fold serial dilutions of the HCV synthetic RNA (sRNA) negative strand were used as semiquantitative standards, while those of the HCV sRNA positive strand were used as the specificity control. As in the standard HCV genome detection assay outlined above, the specificity of PCR signals and the validity of controls were confirmed by nucleic acid hybridization using the 32P-labeled recombinant HCV UTR-E2 fragment (33). This assay detects ∼100 vge per reaction of the correct (negative) strand while nonspecifically identifying ≥106 vge per reaction of the positive strand (Fig. 1) (33, 34). Given that the total RNA templates used for this assay were usually between 2 and 4 μg, the overall sensitivity of the negative-strand detection assay was about 25 to 50 vge/μg of total RNA (33).
Fig 1.
Verification of the specificity and sensitivity of HCV RNA negative (replicative)-strand detection by strand-specific RT-PCR/NAH. (A and B) Tenfold serial dilutions of the synthetic HCV RNA negative strand (A) or synthetic HCV RNA positive strand (B) were amplified using HCV-specific antisense primer and rTth DNA polymerase under the conditions described in Materials and Methods. Contamination controls included water added instead of synthetic RNA, amplification by direct (DW) and nested (NW) reactions, and mock (M) treatment tested RNA. The specificity of RT-PCR products was further verified by NAH using a 32P-labeled rHCV 5′-UTR-E2 fragment as a probe. Positive signals showed the expected 244-bp 5′ UTR sequence-specific fragments. As shown, the assay detected 100 copies of the correct (negative) strand while nonspecifically identifying ≥106 copies of the positive strand.
RT-PCR quantification of cellular-gene transcription.
The levels of expression of CD5 and CD81 in naïve and PMA/ionomycin- or PHA-stimulated T cell lines, PBMC, and primary T cells, human hepatoma cell lines, and isolated primary human hepatocytes were quantified by real-time RT-PCR. Also, expression of cytokines potentially influencing the susceptibility of T cells to HCV infection, such as alpha interferon (IFN-α) and IFN-γ, as well as IFN regulatory factor 3 (IRF-3) and IRF7, were also measured. β-Actin and hypoxanthine phosphoribosyltransferase (HPRT) were measured as loading and expression controls. Primer sequences are shown in Table 3. All amplifications were carried out using cDNA derived from 50 ng of DNase-treated RNA in a LightCycler 480 (Roche Diagnostics) for 40 cycles under the following conditions: denaturation at 95°C for 30 s; annealing for 30 s at 59°C (CD5), 58°C (IFN-α, IFN-γ, IRF3, and IRF7), 57°C (β-actin), 56°C (CD81), or 55°C (HPRT); and extension at 72°C for 20 s.
Table 3.
Primer sequences used for real-time RT-PCR analysis
| Gene | Forward primer | Reverse primer |
|---|---|---|
| CD5 | 5′-TCAAGCGTCAAAAGTCTGCC-3′ | 5′-AGCCACACTGGAGGTTGTTG-3′ |
| CD81 | 5′-ACAAGGACCAGATCGCCAAG-3′ | 5′-AGTCAAGCGTCTCGTGGAAG-3′ |
| IFN-α | 5′-CAGCCTGAGTAACAGGAGGA-3′ | 5′-GCAGATGAGTCCTTTGTGGT-3′ |
| IFN-γ | 5′-TCAGCTCTGGATCGTTTTGG-3′ | 5′-TGTTTTAGCTGCTGGGGACA-3′ |
| IRF3 | 5′-TACGTGAGGCATGTGCTGA-3′ | 5′-AGTGGGTGGCTGTTGGAAAT-3′ |
| IRF7 | 5′-GCCCTTGCCTCCCCTGTTAT-3′ | 5′-CCACTGCAGCCCCTCATAG-3′ |
Flow cytometry.
To determine or confirm the phenotypic characteristics of the T cell lines used as HCV targets, the cells were stained with Alexa Fluor 488-conjugated anti-CD3 MAb (BD Pharminogen), phycoerythrin (PE)-conjugated anti-CD4 MAb (Chemicon International, Temecula, CA), and PE-conjugated anti-CD8 MAb (Chemicon). Detection of CD5 was done with allophycocyanin (APC)-conjugated anti-CD5 MAb (Invitrogen), while that of CD81 was done with fluorescein isothiocyanate (FITC)-labeled CD81 MAb (Invitrogen). Briefly, approximately 1 × 10⁶ cells per reaction were washed twice with phosphate-buffered saline and exposed to MAb or isotype antibody control on ice for 45 min. The cells were washed and then examined with a FACSCalibur cytometer (Becton Dickinson Biosciences, Mountain View, CA). The results from 104 gated cells were analyzed with CellQuest Pro software (Becton Dickinson Biosciences).
Confocal microscopy.
To detect HCV NS5A and core proteins, as well as CD5 protein, cells were fixed with 2% paraformaldehyde and permeabilized with 0.25% saponin. Double staining with rat anti-tubulin (Chemicon) and with either mouse anti-HCV NS5A MAb (Chemicon) or appropriate isotype antibody control (BD Biosciences) was done as previously reported (31). For staining of HCV core protein, cells were exposed to anti-HCV core MAb (Dainippon Sumitomo Pharma, Osaka, Japan) for 20 min on ice, washed, and then incubated with Alexa Fluor 488-labeled anti-mouse IgG MAb (Molecular Probes, Eugene, OR) for 20 min at ambient temperature. After washing, the cells were treated with 4′,6-diamidino-2-phenylindole (DAPI) (0.1 μg/ml; Sigma-Aldrich) and examined. Huh7 cells, naïve or carrying the HCV AB12-A2 replicon, and HuH7.5 cells infected with JFH-AM2 were used as controls. For double staining with anti-CD5 and anti-NS5a, cells were first exposed to anti-NS5a MAb overnight at 4°C, washed, and then exposed to Cy2-labeled donkey anti-mouse antibody (Jackson ImmunoResearch Laboratories Inc., West Grove, PA) on ice for 60 min. Subsequently, the cells were treated with APC-conjugated anti-CD5 MAb (Invitrogen) for 30 min on ice, washed, and counterstained with DAPI. The slides were examined under an Olympus BX50WI microscope with a FluoView FV300 confocal system (Olympus America Inc., Melville, NY). Approximately 1,000 cells per preparation were examined, positive cells were counted, and the percentage of positive cells versus the total cell number was calculated.
Western blotting.
To further ascertain that productive HCV infection was established in T cells, the presence of virus E2 protein was examined by immunoblotting in Molt4 cells infected with plasma-derived HCV. Thus, the infected cells collected at 5 days p.i. were dissolved in ice-cold RIPA buffer (1% NP-40, 0.5% deoxycholate [DOC], 0.1% sodium dodecyl sulfate [SDS], 150 mmol/liter NaCl in 50 mmol/liter Tris, pH 8.0; Sigma-Aldrich), and the proteins were separated by SDS-polyacrylamide gel electrophoresis (PAGE) at 20 μg protein/lane. After blotting onto a nitrocellulose membrane by wet transfer using the Bio-Rad SD cell system (Bio-Rad Laboratories, Mississauga, Ontario, Canada) (22, 27), the blots were exposed to 5% skim milk in Tris-buffered saline (pH 7.4) for 1 h at room temperature and then exposed overnight at 4°C to anti-E2 mouse MAb diluted 1:500 (provided by Arvind Patel, University of Glasgow, Glasgow, United Kingdom). The reactions were developed with horseradish peroxidase-conjugated goat anti-mouse IgG F(ab′)2 antibodies (Jackson ImmunoResearch, West Grove, PA), and signals were visualized using an enhanced chemiluminescence (ECL) detection kit (Sigma-Aldrich).
Statistical analyses.
Data were analyzed using Prism 4 software (GraphPad Software, Inc., San Diego, CA). Statistical significance was determined by a two-tailed Mann-Whitney or unpaired Student's t test, and P values of less than 0.05 were considered significant.
RESULTS AND DISCUSSION
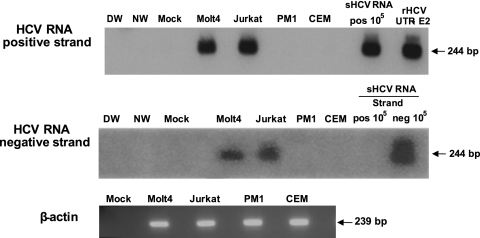
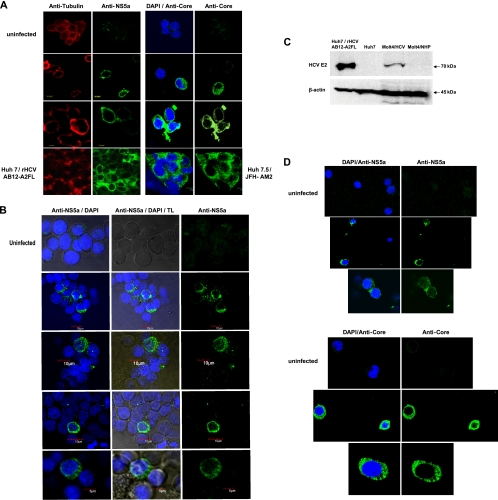
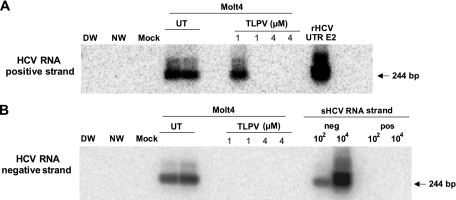
To identify factors facilitating T cell susceptibility to infection with wild-type HCV, we explored a previously established T lymphocyte-based HCV infection system in which plasma from patients with CHC serves as infectious inocula (22, 23). In a search for the most suitable and readily accessible human T cell targets other than mitogen-induced primary T lymphocytes (22, 23), the susceptibilities of Molt4, Jurkat, CEM, and PM1 human lymphoblastic T cell lines to infection with genotype 1 HCV were investigated. This initial study showed, as previously reported (22, 38), that Molt4 and Jurkat cells, as well as human primary T lymphocytes, are susceptible to HCV and can support HCV replication, as identified by detection of the virus RNA negative (replicative) strand (Table 4 and Fig. 2). The susceptibility of Molt4 and Jurkat cells to HCV infection was also confirmed by cytoplasmic detection of HCV nonstructural 5a (NS5a) and core proteins (Fig. 3). The percentages of NS5a-positive Molt4 cells enumerated under a confocal microscope ranged between 2 and 5%, and a higher number of positive cells correlated with a greater copy number of intracellular HCV RNA (Table 4). In agreement with these findings, HCV E2 protein was also identified in HCV-infected Molt4 T cells by Western blotting at a level lower than that displayed by Huh7 cells carrying HCV AB12-A2FL replicon, as expected (Fig. 3C). Furthermore, treatment of Molt4 cells with 1 μM or 4 μM TLPV inhibited replication of HCV, as evidenced by the absence of detectable HCV RNA replicative strands in these cells (Fig. 4), despite the apparent detection of HCV RNA positive strands in one of the two repeat cultures treated with 1 μM TLPV. On the other hand, HCV RNA positive and negative strands were readily detectable in non-TLPV-treated infected Molt4 cells, validating once again the authenticity of HCV replication in these T cells (Fig. 4). In contrast to Molt4 and Jurkat cells, PM1 cells were infrequently reactive for the HCV RNA positive strand and did not display detectable levels of NS5a or core protein, while CEM cells were consistently negative following exposure to virus (Fig. 2 and Table 4).
Table 4.
HCV infection of human T cell lines, PBMC, and primary T lymphocytes with wild-type virus carried in plasma of CHC patients
| HCV inoculum patient (age [yr]/sexa) | HCV genotype | HCV RNA positive-strand no./HCV RNA negative strand no.b |
|||||
|---|---|---|---|---|---|---|---|
| T cell line |
PBMC | Primary T cells | |||||
| Molt4 | Jurkat | PM1 | CEM | ||||
| 47/F | 1a | 1 × 10⁴/1 × 102 | 1 × 10³/5 × 101 | ND | ND | NT | NT |
| 52/M | 1a | 1 × 10⁴/1 × 102 | 1 × 10⁴/1 × 102 | NT | NT | NT | NT |
| 51/M-a | 1a | 1 × 10³/5 × 102 | NT | ND | NT | NT | NT |
| 51/M-b | 1a | 1.3 × 10³/5 × 102 | 5.4 × 10⁴/5 × 102 | 3.4 × 101/ND | ND | 6.7 × 10³/5 × 102 | 5.6 × 10³/5 × 102 |
| 44/M | 1a | 1.5 × 10⁷/1 × 103 | 2 × 10⁶/1 × 103 | 2.5 × 101/ND | ND | 1 × 10⁵/1 × 103 | 1 × 10⁵/1 × 103 |
| 54/F | 1b | 1.3 × 10³/1 × 102 | NT | NT | NT | 5.5 × 10⁴/1 × 103 | 1 × 10⁴/1 × 103 |
M, male; F, female. a and b, samples a and b, collected 1 year apart.
HCV RNA positive-strand numbers were determined by real-time RT-PCR or nested RT-PCR/NAH, whereas HCV RNA negative-strand numbers were determined by strand-specific RT-PCR/NAH, as described in Materials and Methods. The HCV load is expressed in vge/μg total RNA. ND, not detected; either both HCV RNA positive and negative strands or virus RNA negative strand only. NT, not tested.
Fig 2.
Infection of T cell lines with patient-derived HCV. Molt4, Jurkat, PM1, and CEM T cells were exposed to HCV inoculum from patient 44/M. HCV RNA positive and replicative strands were detected by RT-PCR/NAH assays as described in Materials and Methods. The synthetic HCV RNA positive strand (sHCV RNA pos) at 105 copies/reaction and the rHCV UTR-E2 fragment were used as positive and specificity controls for HCV RNA positive-strand detection. Synthetic HCV RNA positive (pos) and negative (neg) strands at 105 copies/reaction confirmed the assay specificity for detection of the virus RNA negative strand. Water amplified in direct (DW) and nested (NW) reactions and a mock extraction served as contamination controls. The positive signals showed the expected 244-bp oligonucleotide fragments.
Fig 3.
Detection of HCV proteins in Molt4 and Jurkat T cells infected with wild-type HCV. (A) Detection of HCV NS5a and core proteins in Molt4 cells infected with HCV from patient 44/M by confocal microscopy. Uninfected Molt4 cells served as negative controls, while Huh7 cells transfected with HCV AB12-A2FL replicon and Huh7.5 cells infected with JFH-AM2 served as positive staining controls. The cells were counterstained with anti-tubulin MAb or DAPI. The images were captured at ×60 magnification. (B) Detection of cytoplasmic expression of HCV NS5a protein in Molt4 cells infected with different patient-derived HCV inocula by confocal microscopy. The cells were counterstained with DAPI to identify nuclei and examined under transmitted light (TL; center column) to visualize the cytoplasm. The images were captured at ×60 magnification. (C) Identification of HCV E2 protein in Molt4 cells infected with wild-type HCV by Western blotting using anti-E2 MAb. Huh7 cells carrying rHCV AB12-A2FL replicon were used as a positive control, while naïve Huh7 cells and Molt4 cells exposed to NHP served as negative controls. Detection of β-actin protein served as a loading control. (D) Detection of HCV NS5a and core proteins in Jurkat T cells infected with different patient-derived HCV inocula. Uninfected cells were used as a negative control. Nuclei were counterstained with DAPI. The images were captured at ×60 magnification.
Fig 4.
Inhibition of HCV infection in Molt4 T cells treated with the HCV-specific protease inhibitor TLPV. Molt4 cells infected with wild-type HCV were treated with 1 μM or 4 μM TLPV or left untreated (UT) for 7 days postinfection. The HCV RNA positive strand was detected by RT-PCR with 5′ UTR-specific primers, and amplicon specificity was verified by NAH. The virus negative (replicative) strand was identified by the strand-specific RT-PCR/NAH assay, in which synthetic HCV RNA positive (pos) and negative (neg) strands at 102 and 105 copies/reaction were used as specificity controls. As positive controls, total RNA from Molt4 cells infected with HCV but not treated with TLPV was used. Other controls were as described in the legend to Fig. 2.
To identify the reasons behind the discrepant susceptibilities to HCV infection in the T cell lines, we reevaluated their phenotypic characteristics and assessed expression of CD81, as well as that of selected innate immunity response genes, which are known to limit viral infection. In addition, we determined the expression of CD5, which we had hypothesized to be involved in HCV entry based upon its essentially lymphocyte-restricted expression and also its inclusion in the scavenger receptor cysteine-rich family, as is the postulated HCV entry molecule SR-B1 (1, 37). The flow cytometry data confirmed that the T cell lines were uniformly CD3 positive, essentially CD8 negative, and variably CD4 reactive (data not shown). Interestingly, CD81 was displayed on comparable numbers of cells (mean, 98.2%; standard error of the mean [SEM], 0.5%) and with mean fluorescence intensities (MFI) (106 to 171) similar to those on fresh normal human PBMC and primary T cells (mean, 99.1%; SEM, 0.5%; MFI, 213 to 260). Conversely, CD5 was displayed by a significantly (P < 0.0001) greater number of Molt4 cells (mean, 98%; SEM, 0.6%; MFI, 84), Jurkat cells (mean, 92%; SEM, 2.7%; MFI, 77), and primary T cells (mean, 80%; SEM, 4.9%; MFI, 61) than PM1 (mean, 5.8%; SEM, 1.6%; MFI, 34) or CEM (mean, 5.6%; SEM, 1.6%; MFI, 32) cells. The expression of CD81 and CD5 proteins corresponded well to the transcriptional levels of the respective genes. Indeed, the CD81 mRNA levels were not significantly different in all T cell lines, while CD5 transcription was significantly (P < 0.0001) greater in HCV-permissive Molt4, Jurkat, and primary T cells and PBMC than in HCV-resistant PM1 and CEM cells (Fig. 5). Therefore, the results suggested that T cell receptiveness to HCV infection requires CD5 and is unlikely to be mediated by CD81 alone. Furthermore, expression profiles of IFN-α, IFN-γ, IRF-3, and IRF-7 transcription revealed no apparent correlation with T cell susceptibility to infection with wild-type HCV (Fig. 5).
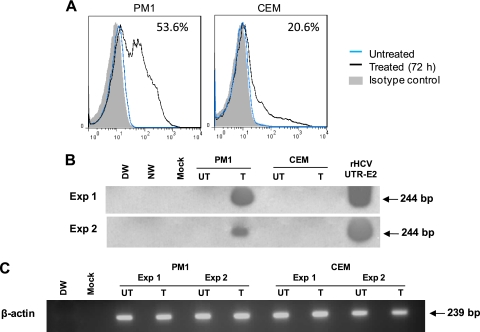
Since our previous studies consistently demonstrated that ex vivo mitogen stimulation of normal human T lymphocytes predisposes them to HCV infection (22, 23) and, with some exceptions, augments HCV replication in PBMC from HCV-infected individuals (31, 32), we tested whether stimulation of PM1 or CEM cells may make them prone to HCV infection. In this regard, treatment with PHA or PMA had been shown to upregulate CD5 on T lymphocytes (20). Therefore, we exposed T cell lines to nontoxic concentrations of PMA (50 ng/ml) with ionomycin (500 ng/ml), while normal human PBMC and purified primary T cells were treated with PHA prior to infection, as reported previously (22). As expected, the CD5 surface display was increased on all T cell lines examined (Table 1). However, while PM1 cells became prone to HCV infection, CEM cells remained virus resistant (Fig. 6). This permissiveness appeared proportional to the cell positivity for CD5. In fact, while 10% (MFI, 18.8) of naive PM1 cells were CD5 positive, 53.6% (MFI, 30.1) of them became CD5 reactive after stimulation. Treatment of CEM cells augmented CD5 positivity from 6.3% (MFI, 6.4) to 20.6% (MFI, 14.5), but this appeared to be insufficient to facilitate HCV infection. Following the same treatment, CD5 expression on Molt4 and Jurkat cells was increased (Table 1), and the cell receptiveness to HCV infection was augmented, albeit unremarkably (data not shown). Notably, stimulation of the T cell lines downregulated expression of cell surface CD81 (Table 1), making the postulated CD5 contribution to HCV T cell entry even more compelling.
Fig 6.
Upregulation of CD5 on nonpermissive PM1 cells confers their susceptibility to HCV infection. (A) HCV-resistant PM1 and CEM cells were treated with PMA/ionomycin for 72 h and examined for CD5 protein expression by flow cytometry. Stimulation significantly augmented the CD5 positivity of PM1, but not CEM, cells. The percentage of positive cells after stimulation is indicated in the upper right corner of each plot. (B) Untreated (UT) and treated/stimulated (T) PM1 and CEM cells were exposed to HCV from patient 51/M-b for 24 h, extensively washed, supplemented with fresh medium, and harvested for analysis after 5 days of culture. HCV RNA expression was detected in stimulated PM1 cells but not in stimulated CEM cells, while untreated cells were HCV nonreactive, indicating that an increase in CD5 expression on PM1 cells coincided with acquisition of permissiveness to HCV infection. The results from two independent infection experiments (Exp) are illustrated. (C) β-Actin expression in the PM1 and CEM cells shown in panel B.
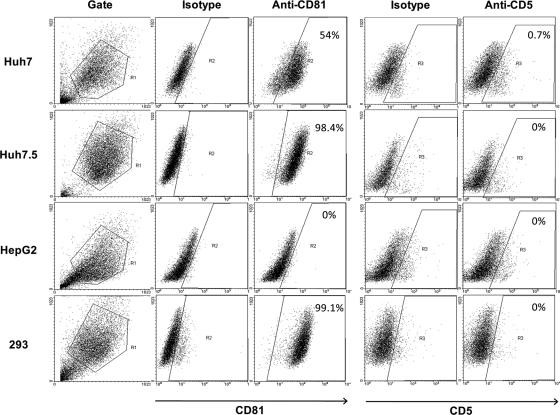
In the context of the above findings and since no relevant information was available, we tested whether human hepatocytes are endowed with CD5. Flow cytometry revealed that Huh7 and Huh7.5 hepatoma cells and HepG2 cells were essentially CD5 nonreactive, while, with the exception of HepG2 cells, they were strongly CD81 positive (Fig. 7). Quantification of CD5 mRNA by real-time RT-PCR revealed trace CD5 mRNA levels in the hepatoma cells and primary human hepatocytes and comparably high CD81 mRNA levels (data not shown). Taking these data together, it would be highly unlikely that CD5 can contribute to HCV infection of hepatocytes.
Fig 7.
CD81 and CD5 protein display by human hepatoma-derived cell lines and naive HEK-293 cells. The proteins' expression was determined by flow cytometry with anti-CD81 and anti-CD5 antibodies, as well as appropriate isotype controls. The percentage of positive cells is indicated in the upper right corner of each plot.
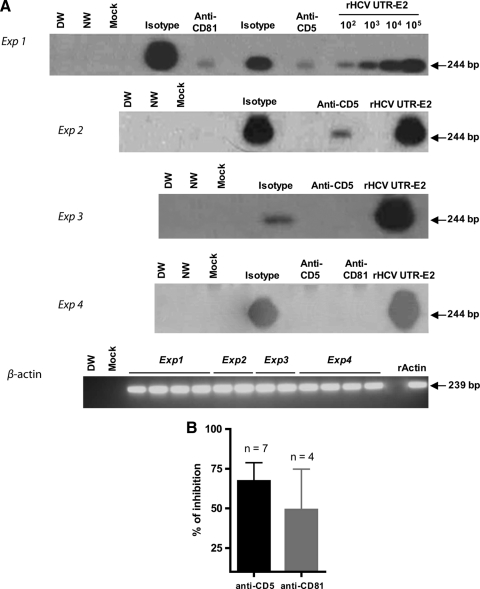
To ascertain the role of CD5 in HCV entry into T cells, Molt4 cells and freshly purified human T lymphocytes were preincubated with anti-CD5 MAb and then exposed to HCV. Under the same conditions, interference of anti-CD81 MAb with HCV infectivity was examined. Blocking of either CD5 or CD81 abolished or significantly decreased the susceptibility of Molt4 and primary T cells to HCV infection (Fig. 8A). Incubation with appropriate isotype controls (Fig. 8A) or an unrelated MAb to CD6 (data not shown) had no effect. Overall, the data from 7 separate experiments with anti-CD5 MAb and 4 with anti-CD81 MAb using three different HCV inocula gave a mean inhibition of 67.2% (SEM, 11.6%) and 49.1% (SEM, 25.6%), respectively, in HCV RNA expression in Molt4 target cells (Fig. 8B).
Fig 8.
Inhibition of HCV infection of T cells with anti-CD5 and anti-CD81 antibodies. (A) Molt4 cells (experiments 1 to 3) or fresh primary T cells (experiment 4) were exposed to HCV from patient 44/M (experiments 1 and 4), HCV from patient 51/M-b (experiment 2), and HCV from patient 51/M-a (experiment 3) in the presence of anti-CD5, anti-CD81, or a relevant isotype antibody control. The infection outcome was evaluated by RT-PCR/NAH. (B) Plot presentation of the data on inhibition of HCV RNA expression determined by RT-PCR/NAH assay in cells challenged with HCV that were obtained for all experiments performed, including those shown in panel A. The error bars indicate SEM.
Furthermore, silencing of CD5 expression with lentiviruses carrying CD5-specific shRNAs significantly (P < 0.05) inhibited HCV RNA expression, which was accompanied by the loss of virus RNA replicative strands in Molt4 cells relative to those transduced with control shRNA or untreated cells (Fig. 9A and B). This finding was supported by the significantly lower level (P < 0.05) of HCV RNA released by CD5-silenced cells than by untransduced Molt4 cells or Molt4 cells transduced with scrambled shRNA (Fig. 9D). It should be noted that selection of the cells in the presence of puromycin led to a partial decrease in their susceptibility to HCV infection, as evidenced by the lower levels of HCV RNA in cells transduced with scrambled shRNA than in untransduced cells (Fig. 5E). The level of CD81 expression was not affected in these experiments (Fig. 9C).
Fig 9.
Inhibition of CD5 expression in Molt4 cells makes them resistant to HCV infection. (A) Clones M-5 and M-6 of lentiviral particles carrying CD5 shRNA were most effective in knocking down CD5 protein, as revealed by flow cytometry with anti-CD5 antibody. (B and C) Inhibition of transcription of CD5 (B), but not CD81 (C), with clones M-5 and M-6 as quantified by real-time RT-PCR. (D) Molt4 cells transduced with clone M-5 or M-6, scrambled shRNA, or native cells were challenged with HCV from patient 44/M, and after 7 days of culture, the HCV released into the culture supernatant was quantified by real-time RT-PCR. (E) Replicating virus was identified by detection of the HCV RNA negative strand. Specificity and contamination controls were the same as those described in the legend to Fig. 2. β-Actin expression was used as a loading control and recombinant human actin (rActin) as a positive control. The error bars indicate SD.
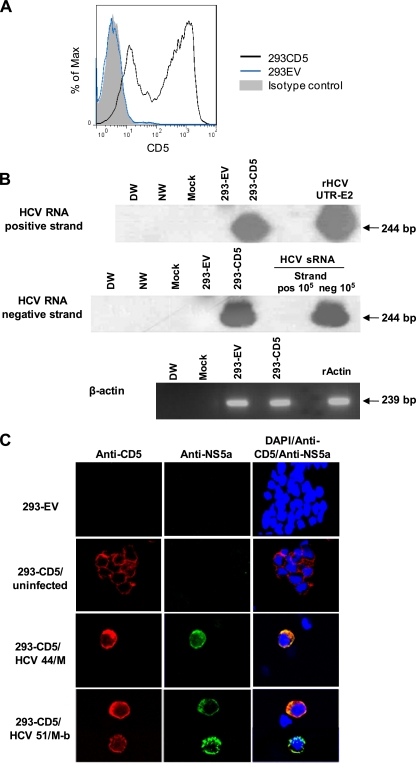
Finally, the involvement of CD5 in HCV entry was examined by transfectiing CD5-negative, CD81-positive human embryonic kidney 293 fibroblasts with complete human CD5 cDNA and then exposing the transfected cells to HCV. Up to 85% of HEK-293 cells became CD5 reactive (designated 293-CD5), while those transfected with the empty vector (293-EV cells) remained negative (Fig. 10A). At 4 days after virus exposure, 293-CD5 cells, but not 293-EV cells, expressed positive and negative virus RNA strands (Fig. 10B) and displayed NS5a protein (Fig. 10C). The association between cell positivity with CD5 and cytoplasmic expression of the NS5a protein was clearly apparent (Fig. 10C). This demonstrated that the presence of CD5 facilitated infection of these otherwise CD5-negative and HCV-nonpermissive cells, albeit at a relatively low level (≤1% of NS5A-positive cells).
Fig 10.
HEK-293 cells transfected with CD5 become susceptible to HCV. (A) HCV-resistant, CD5-negative 293 cells were transfected with plasmid encoding human CD5. (B) 293 cells transfected with CD5 (293-CD5) or empty vector (293-EV) were exposed to HCV inoculum from patient 51/M-b and examined for HCV RNA positive and negative strands by RT-PCR/NAH as described in Materials and Methods. Specificity and contamination controls were as outlined in the legend to Fig. 2. β-Actin expression was used as a loading control. (C) 293-EV, uninfected 293-CD5, and 293-CD5 cells challenged with HCV inoculum from patient 44/M or 51/M-b were stained with anti-CD5 and anti-NS5a antibodies and examined by confocal microscopy. Nuclei were counterstained with DAPI. The images were captured at ×60 magnification.
Of note, our attempts to infect T cell lines, primary T cells, PBMC, or 293-CD5 cells with the HCV laboratory strain JFH-1 were not successful. This may suggest that the ability to infect T lymphocytes is a characteristic of native, patient-derived HCV and, as we have found, does not depend on HCV genotypes (23; G. Skardasi and T. I. Michalak, unpublished data).
This study is the first to identify a molecule important for cell-specific HCV entry into human lymphocytes. In addition to primary T lymphocytes, only T cell lines displaying moderate to high levels of CD5 protein were found to be susceptible to HCV infection, despite comparable expression levels of CD81, the accepted, customary HCV coreceptor. Since anti-CD5 and anti-CD81 MAbs inhibited infection of permissive T cells, this may argue that both of these molecules are required for HCV entry into T cells. Notably, the ability of anti-CD81 to inhibit infection of human T cells with wild-type HCV was previously documented (22, 23). Considering the restricted expression of CD5, which in adults is essentially limited to T cells and a minor subset of B cells, it is likely that while CD81 may contribute to broad recognition of cells by HCV, CD5 facilitates HCV tropism specifically toward lymphocytes. On this note, while in this study we clearly documented the involvement of CD5 in T cell susceptibility to HCV infection, it remains to be established whether the protein may also play a role in HCV entry into B cells. Since the factors mediating HCV entry into Huh7 hepatoma cells reported thus far are not unique to hepatocytes, CD5 is the first molecule identified that governs cell permissiveness to HCV in a cell-type-specific manner. Our findings not only provide direct insight into the nature of HCV lymphotropism, but also open new options for the development of antiviral approaches targeting HCV that propagates in the lymphatic system. Although this is not yet a fully appreciated site of extrahepatic HCV occurrence, under certain clinical conditions, it may in fact be the largest reservoir of potentially pathogenic virus.
ACKNOWLEDGMENTS
We thank Christopher D. Richardson and Joyce Wilson for supplying the HCV AB12-A2FL full-length replicon in Huh7 cells and Rodney S. Russell for providing strain JFH-AM in Huh7.5 cells for control experiments. We also thank Takashi Wakita for providing HCV strain JFH-1 and Huh7 cells and Arvind Patel for AP33 antibody.
M.A.S. is a recipient of a National CIHR Research Training Program in Hepatitis C (NCRTP-HepC) Fellowship. T.N.Q.P. was supported by Postdoctoral Fellowship Awards from the NCRTP-HepC and the Canadian Association for the Study of the Liver/Hoffmann-La Roche/Astellas Pharma, Canada. T.I.M. holds the Senior Canada Research Chair in Viral Hepatitis/Immunology sponsored by the Canada Research Chair Program and funds from the Canadian Institutes of Health Research and the Canada Foundation for Innovation. This study was supported by an operating grant (MOP-77544) from the Canadian Institutes of Health Research (to T.I.M.).
We declare that no competing interests exist.
Footnotes
Published ahead of print 25 January 2012
REFERENCES
- 1. Bartosch B, et al. 2003. Cell entry of hepatitis C virus requires a set of co-receptors that include the CD81 tetraspanin and the SR-B1 scavenger receptor. J. Biol. Chem. 278:41624–41630 [DOI] [PubMed] [Google Scholar]
- 2. Benedicto I, et al. 2009. The tight junction-associated protein occludin is required for a postbinding step in hepatitis C virus entry and infection. J. Virol. 83:8012–8020 [DOI] [PMC free article] [PubMed] [Google Scholar]
- 3. Blackard JT, Kemmer N, Sherman KE. 2006. Extrahepatic replication of HCV: insights into clinical manifestations and biological consequences. Hepatology 44:15–22 [DOI] [PubMed] [Google Scholar]
- 4. Chuang SS, et al. 2010. Hepatitis C virus infection is significantly associated with malignant lymphoma in Taiwan, particularly with nodal and splenic marginal zone lymphomas. J. Clin. Pathol. 63:595–598 [DOI] [PubMed] [Google Scholar]
- 5. Ciurea A, et al. 1999. Persistence of lymphocytic choriomeningitis virus at very low levels in immune mice. Proc. Natl. Acad. Sci. U. S. A. 96:11964–11969 [DOI] [PMC free article] [PubMed] [Google Scholar]
- 6. Di Liberto G, et al. 2006. Clinical and therapeutic implications of hepatitis C virus compartmentalization. Gastroenterology 131:76–84 [DOI] [PubMed] [Google Scholar]
- 7. Ducoulombier D, et al. 2004. Frequent compartmentalization of hepatitis C virus variants in circulating B cells and monocytes. Hepatology 39:817–825 [DOI] [PubMed] [Google Scholar]
- 8. Durand T, et al. 2010. Occult infection of peripheral B cells by hepatitis C variants which have low translational efficiency in cultured hepatocytes. Gut 59:934–942 [DOI] [PubMed] [Google Scholar]
- 9. Evans MJ, et al. 2007. Claudin-1 is a hepatitis C virus co-receptor required for a late step in entry. Nature 446:801–805 [DOI] [PubMed] [Google Scholar]
- 10. Ferri C, et al. 1993. Infection of peripheral blood mononuclear cells by hepatitis C virus in mixed cryoglobulinemia. Blood 82:3701–3704 [PubMed] [Google Scholar]
- 11. Foley GE, et al. 1965. Continuous culture of human lymphoblasts from peripheral blood of a child with acute leukemia. Cancer 18:522–529 [DOI] [PubMed] [Google Scholar]
- 12. Germi R, et al. 2002. Cellular glycosaminoglycans and low density lipoprotein receptor are involved in hepatitis C virus adsorption. J. Med. Virol. 68:206–215 [DOI] [PubMed] [Google Scholar]
- 13. Gisbert JP, García-Buey L, Pajares JM, Moreno-Otero R. 2003. Prevalence of hepatitis C virus infection in B-cell non-Hodgkin's lymphoma: systematic review and meta-analysis. Gastroenterology 125:1723–1732 [DOI] [PubMed] [Google Scholar]
- 14. Griffin DE. 2010. Measles virus-induced suppression of immune responses. Immunol. Rev. 236:176–189 [DOI] [PMC free article] [PubMed] [Google Scholar]
- 15. Kapadia SB, Barth H, Baumert T, McKeating JA, Chisari FV. 2007. Initiation of hepatitis C virus infection is dependent on cholesterol and cooperativity between CD81 and scavenger receptor B type I. J. Virol. 81:374–383 [DOI] [PMC free article] [PubMed] [Google Scholar]
- 16. Laskus T, et al. 2000. Hepatitis C virus in lymphoid cells of patients coinfected with human immunodeficiency virus type 1: evidence of active replication in monocytes/macrophages and lymphocytes. J. Infect. Dis. 181:442–448 [DOI] [PubMed] [Google Scholar]
- 17. Lerat H, et al. 1996. Specific detection of hepatitis C virus minus strand RNA in hematopoietic cells. J. Clin. Invest. 97:845–851 [DOI] [PMC free article] [PubMed] [Google Scholar]
- 18. Lin K, Perni RB, Kwong AD, Lin C. 2006. VX-950, a novel hepatitis C virus (HCV) NS3-4A protease inhibitor, exhibits potent antiviral activities in HCV replicon cells. Antimicrob. Agents Chemother. 50:1813–1822 [DOI] [PMC free article] [PubMed] [Google Scholar]
- 19. Liu S, et al. 2009. Tight junction proteins claudin-1 and occludin control hepatitis C virus entry and are downregulated during infection to prevent superinfection. J. Virol. 83:2011–2014 [DOI] [PMC free article] [PubMed] [Google Scholar]
- 20. Lozano F, Alberola-Ila J, Places L, Gallart T, Vives J. 1990. Protein kinase C-dependent up-regulation of CD5 surface expression on normal and lymphoblastoid T cells. Immunology 70:434–439 [PMC free article] [PubMed] [Google Scholar]
- 21. Lusso P, et al. 1995. Growth of macrophage-tropic and primary human immunodeficiency virus type 1 (HIV-1) isolates in a unique CD4+ T-cell clone (PM1): failure to downregulate CD4 and to interfere with cell-line-tropic HIV-1. J. Virol. 69:3712–3720 [DOI] [PMC free article] [PubMed] [Google Scholar]
- 22. MacParland SA, Pham TNQ, Gujar SA, Michalak TI. 2006. De novo infection and propagation of wild-type Hepatitis C virus in human T lymphocytes in vitro. J. Gen. Virol. 87:3577–3586 [DOI] [PubMed] [Google Scholar]
- 23. MacParland SA, Pham TNQ, Guy CS, Michalak TI. 2009. Hepatitis C virus persisting after clinically apparent sustained virological response to antiviral therapy retains infectivity in vitro. Hepatology 49:1431–1441 [DOI] [PubMed] [Google Scholar]
- 24. McCaughan GW, Shackel NA, Bertolino P, Bowen DG. 2009. Molecular and cellular aspects of hepatitis C virus reinfection after liver transplantation: how the early phase impacts on outcomes. Transplantation 87:1105–1111 [DOI] [PubMed] [Google Scholar]
- 25. Melon S, et al. 2005. Hepatitis C virus reactivation in anti-hepatitic C virus-positive renal transplant recipients. Transplant. Proc. 37:2083–2085 [DOI] [PubMed] [Google Scholar]
- 26. Michalak TI. 2000. Occult persistence and lymphotropism of hepadnaviral infection: insights from the woodchuck viral hepatitis model. Immunol. Rev. 174:98–111 [DOI] [PubMed] [Google Scholar]
- 27. Michalak TI, Hodgson PD, Churchill ND. 2000. Postranscriptional inhibition of class I major histocompatibility complex presentation on hepatocytes and lymphoid cells in chronic woodchuck hepatitis virus infection. J. Virol. 74:4483–4494 [DOI] [PMC free article] [PubMed] [Google Scholar]
- 28. Navas S, Martin J, Quiroga JA, Castillo I, Carreno V. 1998. Genetic diversity and tissue compartmentalization of the hepatitis C virus genome in blood mononuclear cells, liver, and serum from chronic hepatitis C patients. J. Virol. 72:1640–1646 [DOI] [PMC free article] [PubMed] [Google Scholar]
- 29. Oldstone MB. 1996. Virus-lymphoid cell interactions. Proc. Natl. Acad. Sci. U. S. A. 93:12756–12758 [DOI] [PMC free article] [PubMed] [Google Scholar]
- 30. Pal S, et al. 2006. Productive replication of hepatitis C virus in perihepatic lymph nodes in vivo: implications of HCV lymphotropism. Gastroenterology 130:1107–1116 [DOI] [PubMed] [Google Scholar]
- 31. Pham TN, et al. 2008. Hepatitis C virus replicates in the same immune cell subsets in chronic hepatitis C and occult infection. Gastroenterology 134:812–822 [DOI] [PubMed] [Google Scholar]
- 32. Pham TNQ, et al. 2005. Mitogen-induced upregulation of hepatitis C virus expression in human lymphoid cells. J. Gen. Virol. 86:657–666 [DOI] [PubMed] [Google Scholar]
- 33. Pham TNQ, et al. 2004. Hepatitis C virus persistence after spontaneous or treatment-induced resolution of hepatitis C. J. Virol. 78:5867–5874 [DOI] [PMC free article] [PubMed] [Google Scholar]
- 34. Pham TNQ, Mercer SE, Michalak TI. 2009. Chronic hepatitis C and persistent occult hepatitis C virus infection are characterized by distinct immune cell cytokine expression profiles. J. Viral Hepat. 16:547–556 [DOI] [PubMed] [Google Scholar]
- 35. Ploss A, et al. 2009. Human occludin is a hepatitis C virus entry factor required for infection of mouse cells. Nature 457:882–886 [DOI] [PMC free article] [PubMed] [Google Scholar]
- 36. Russell RS, et al. 2008. Advantages of a single-cycle production assay to study cell culture-adaptive mutations of hepatitis C virus. Proc. Natl. Acad. Sci. U. S. A. 105:4370–4375 [DOI] [PMC free article] [PubMed] [Google Scholar]
- 37. Sarrias MR, et al. 2004. The scavenger receptor cysteine-rich (SRCR) domain: an ancient and highly conserved protein module of the innate immune system. Crit. Rev. Immunol. 24:1–37 [DOI] [PubMed] [Google Scholar]
- 38. Shimizu YK, Iwamoto A, Hijikata M, Purcell RH, Yoshikura H. 1992. Evidence for in vitro replication of hepatitis C virus genome in a human T-cell line. Proc. Natl. Acad. Sci. U. S. A. 89:5477–5481 [DOI] [PMC free article] [PubMed] [Google Scholar]
- 39. Thomas RM, et al. 2003. Infection with chronic hepatitis C virus and liver transplantation: a role for interferon therapy before transplantation. Liver Transpl. 9:905–915 [DOI] [PubMed] [Google Scholar]
- 40. Tkoub ME, Haioun C, Pawlotsky JM, Dhumeaux D, Delchier JC. 1998. Chronic hepatitis C virus and gastric MALT lymphoma. Blood 91:360. [PubMed] [Google Scholar]
- 41. Wakita T, et al. 2005. Production of infectious hepatitis C virus in tissue culture from a cloned viral genome. Nat. Med. 11:791–796 [DOI] [PMC free article] [PubMed] [Google Scholar]
- 42. Zignego AL, Giannini C, Monti M, Gragnani L. 2007. Hepatitis C virus lymphotropism: lessons from a decade of studies. Dig. Liver Dis. 39(Suppl. 1):S38–S45 [DOI] [PubMed] [Google Scholar]


