Abstract
A small fraction of HIV-infected individuals (<1%), referred to as elite controllers (EC), are able to maintain undetectable viral loads indefinitely without treatment. The role of the maturational phenotype of T cells in the control of HIV infection in these individuals is not well described. We compared the maturational and functional phenotypes of Gag-specific CD4 and CD8 T cells from EC, who maintain undetectable viral loads without treatment; relative controllers (RC), who maintain viral loads of <1,000 copies/ml without treatment; and noncontrollers (NC), who fail to control viral replication. EC maintained higher frequencies of HIV-specific CD4 T cells, less mature polyfunctional Gag-specific CD4 T cells (CD27+ CD57− CD45RO+), and Gag-specific polyfunctional CD4 T cells than those observed in NC. In EC, the frequency of polyfunctional Gag-specific CD8 T cells was higher than that observed in RC and NC. RC had a similar functional phenotype to that observed in NC, despite consistently lower viral loads. Finally, we found a direct correlation between the frequency of Gag-specific CD27+ CD57− CD45RO+ CD4+ T cells and the frequency of mature HIV-specific CD8 T cells. Altogether, our data suggest that immature Gag-specific interleukin-2 (IL-2)-producing CD4+ T cells may play an important role in spontaneous control of HIV viremia by effectively supporting HIV-specific CD8 T lymphocytes. This difference appears to differentiate EC from RC.
INTRODUCTION
Most untreated HIV-infected patients have high levels of HIV replication that lead to a rapid deterioration of the immune system. HIV controllers are able to maintain low viral loads (VLs) in the absence of antiretroviral therapy, delaying the progression to AIDS by years (5). A rare subset (<1% of all HIV-infected individuals), known as elite controllers (EC), are capable of spontaneously maintaining undetectable viral loads (15).
Determining the host immune mechanisms responsible for the control of HIV viremia would facilitate the future design of immunotherapeutic studies. It is generally accepted that CD8 cell cytotoxic responses are at least partially responsible for the control of viral replication (12). Preserved CD8 T cell polyfunctionality (2, 16, 19) and degranulation (18), interleukin-2 (IL-2) secretion to support CD4-independent proliferation (8, 13), and overrepresentation of protective HLA alleles (9, 17) have all been suggested to contribute to the control of viral replication in HIV controllers. In addition, preservation of IL-2-producing HIV-specific CD4 T cells has long been thought to contribute to the control of viremia (reviewed in reference 20).
Differences in maturation phenotype also appear to contribute to improved viral control. In progressors, HIV-specific CD8 T cells display a more immature profile than that observed for other antigen-specific CD8 T cells (3, 7), and terminally differentiated HIV-specific CD8 T cells are observed more frequently in relative controllers (RC) than in progressors (1). HIV-specific CD4 T cells, responsible for supporting long-term memory, acquire a more mature phenotype and lose their self-renewing capacity (8, 24). In contrast to progressors, controllers preserve IL-2 production even in effector CD4 T cells (21). Even though altered T cell maturation patterns are consistently modified in HIV progressors (7, 24), their role in the control of viremia is not well described. In this study, we characterized the maturational and functional phenotypes of RC and EC and compared them to those observed for noncontrollers (NC).
MATERIALS AND METHODS
Subjects.
Peripheral blood mononuclear cells (PBMCs) were obtained from 40 untreated asymptomatic chronically HIV-infected subjects recruited from the Infectious Diseases Service at Virgen del Rocío University Hospital in Seville, Spain, and were stored at the HIV Biological Bank of the Spanish AIDS Research Network (RIS). Twenty samples were from individuals with persistent viral control (median, 215.7 months; interquartile range [IQR], 132.8 to 241.16 months). Nine of the 20 controllers had undetectable viral loads (<50 HIV RNA copies/ml) and were defined as EC. The remaining 11 controllers showed viral loads between 50 and 1,000 HIV RNA copies/ml and were defined as RC. In addition, 20 study subjects with persistent viral loads of >2,000 HIV RNA copies/ml (median, 21.7 months; IQR, 17.9 to 155.4 months) were defined as NC. Informed consent was obtained and was reviewed and approved by the ethical committee of the hospital for all subjects prior to enrollment in this study.
Cell stimulation.
Frozen PBMCs were thawed and washed twice with R-10 medium (RPMI 1640 supplemented with 10% heat-inactivated calf serum, 100 U/ml penicillin G, 100 μl/ml streptomycin sulfate, and 1.7 mM sodium glutamine). Thawed cells were resuspended in R-10 containing 10 U/ml DNase I (Roche Diagnostics) and rested for 2 h before being used. Cells were stimulated at 2 × 10⁶ PBMCs/ml in the presence of 1 μg/ml of anti-CD28, 1 μg/ml of anti-CD49d (BD Biosciences), 10 μg/ml of brefeldin A (BFA) (Sigma Chemical Company), and 0.7 μg/ml of monensin (BD Biosciences), in the absence or presence of peptide antigens. Directly conjugated monoclonal anti-CD107a was added at the beginning of incubation. Six-hour stimulations were performed for both cytomegalovirus (CMV) (pp65)- and HIV (Gag)-specific peptide pool stimulation.
Antibodies.
Directly conjugated anti-IL-2–Cy55–peridinin chlorophyll protein (PerCP), anti-CD3–Cy7–allophycocyanin (APC), anti-gamma interferon (anti-IFN-γ)–phycoerythrin (PE), anti-tumor necrosis factor (anti-TNF)–Cy7–PE, anti-CD14–Pacific Blue (PB), and anti-CD19–PB monoclonal antibodies were obtained from BD Biosciences; anti-CD45RO–Texas Red PE (TRPE) and anti-CD27–Cy5–PE were from Beckman Coulter; anti-CD4–Cy55–PE was from Caltag; and anti-PRF1–fluorescein isothiocyanate (FITC) clone B-D48 was from Cell Sciences. Anti-CD107a–Alexa 680, anti-CD8–Q-Dot 655 (QD655), and anti-CD57–QD565 were conjugated in our laboratory according to standard protocols (http://drmr.com/abcon/index.html).
Immunofluorescence staining and flow cytometric analysis.
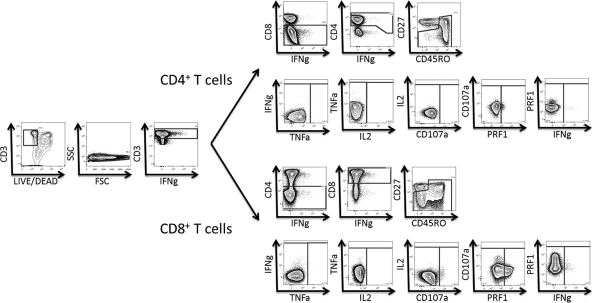
Previously stimulated PBMCs were washed and stained for 10 min with a pretitrated quantity of Live/Dead fixable violet dead cell stain (Invitrogen). Cells were then surface stained at room temperature for 30 min with 100 μl of Dulbecco's phosphate-buffered saline (PBS) containing pretitrated amounts of anti-CD14, anti-CD19, anti-CD8, anti-CD45RO, anti-CD27, and anti-CD57. Cells were then washed and permeabilized using a Cytofix/Cytoperm kit (BD Biosciences) according to the manufacturer's instructions. Cells were stained intracellularly with anti-CD3, anti-CD4, anti-IFN-γ, anti-TNF-α, anti-IL-2, and anti-PRF1 and then washed and fixed in PBS containing 1% paraformaldehyde (PFA). Flow cytometry was performed for all subjects on the same day that the experiment was performed. Twelve-color, 14-parameter flow cytometry was performed on an LSRII flow cytometer (BD Immunocytometry Systems) equipped for the detection of 18 fluorescence parameters. A minimum of 300,000 events were collected for each sample. Electronic compensation was conducted with antibody capture beads (BD Biosciences) stained separately with individual monoclonal antibodies. Analysis was performed using FlowJo, version 9.2 (Tree Star), as previously described (6). Briefly, singlet cells were identified based on forward scatter height (FSC-H) and forward scatter area (FSC-A). Dead cells, B cells, and monocytes were excluded from the live CD19− CD14− gate. CD3+ CD8− CD4+ T cells or CD3+ CD4− CD8+ T cells were selected sequentially. Different CMV- or HIV-specific T cells were identified by IFN-γ, TNF-α, IL-2, CD107a, and PRF1 production. Maturation patterns were then analyzed using CD45RO, CD27, and CD57 expression. According to these markers, naive T cells (T cells that have never encountered their specific antigen) are defined as CD45RO− CD27+ cells, memory T cells (antigen-experienced T cells) are defined as CD45RO+ CD27+ cells, and mature effector T cells are defined by the absence of CD27 expression (CD45RO+ for effector memory T cells and CD45RO− for terminally differentiated effector memory CD45RA+ T cells). The accuracy of these phenotypes has been reported previously (10). A representative example of the gating strategy is shown in Fig. 1. A standard virus-specific response was defined by intracellular cytokine production of IFN-γ, TNF-α, and/or IL-2 in response to virus-specific peptide pools. Subjects were categorized as responders or nonresponders according to their standard response. Graphs were made using Pestle, version 1.6.2 (provided by M. Roederer, NIH, Bethesda, MD), and Spice, version 5.2 (provided by M. Roederer, NIH, Bethesda, MD) (22).
Fig 1.
Representative plots showing the gating strategy and functional responses to Gag 15-mers overlapping by 11 amino acids.
Peptide pools.
Peptide pools consisting of 15-mer peptides overlapping by 11 residues covering the entire Gag and pp65 proteins were constructed (NIH AIDS Research and Reference Reagent Program [https://www.aidsreagent.org/index.cfm]) (6). Each pool contained 400 μg of each peptide, and peptides in incubation mixtures were each present at a concentration of 2 μg/ml. All peptides were >70% pure.
Statistical analysis.
Continuous variables are expressed as medians (IQR), and categorical variables are expressed as percentages. Nonparametric linear regression analysis was done using the Spearman rank test. The Mann-Whitney U test was used to analyze differences between unpaired groups. Differences between paired samples were determined by the Wilcoxon signed rank test. All P values of <0.05 were considered significant. Statistical analysis was performed using Statistical Package for the Social Sciences software (SPSS 17.0; SPSS, Chicago, IL). Prism, version 5.0 (GraphPad Software, Inc.), was used for the generation of graphs.
RESULTS
Spontaneous control of HIV viremia is associated with Gag-specific T cell responses.
Gag and pp65 peptide pools were used to determine the frequencies of pp65- and Gag-specific CD4 and CD8 T cells (defined by detectable IFN-γ, TNF-α, and/or IL-2 cytokine expression) in our cohort. The gating strategy is shown in Fig. 1. As shown in Table 1, a larger number of EC (8/9 patients [89%]) than RC (7/11 patients [64%]) showed HIV-specific CD4 T cell responses. Moreover, only 45% (9/20 patients) of the NC group showed Gag-specific CD4 cell responses. These differences were statistically significant (P = 0.027). HIV-specific CD8 T cells were found in approximately 90% of controllers (8/9 EC and 10/11 RC) and only 65% of NC (13/20 patients [65%]). Differences between groups did not show any statistical significance for CD8 T cell responses, although there was a trend toward higher responses among the controllers (P = 0.102). Six of 20 NC (30%), but none of the controllers—either EC or RC—completely lacked Gag-specific responses. In contrast, similar response rates were found among all groups for both CD4 (EC, 78%; RC, 73%; NC, 80% [P = 0.826])- and CD8 (EC, 67%; RC, 64%; NC, 65% [P = 0.951])-specific pp65 responses.
Table 1.
Patient characteristics and percentages of HIV- and CMV-specific T cell responsesc
| Patient | Age (yr) (sexa) | HLA-B type | VL (HIV RNA copies/ml) | CD4 count (cells/ml) | % HIV responseb |
% CMV responseb |
||
|---|---|---|---|---|---|---|---|---|
| CD4 cells | CD8 cells | CD4 cells | CD8 cells | |||||
| EC01 | 46 (M) | NA | <50 | 619 | 0.327 | 0.668 | 0.303 | 1.143 |
| EC02 | 52 (M) | B35/B44 | <50 | 552 | 1.214 | 1.803 | NR | 0.651 |
| EC03 | 48 (M) | B08/B13 | <50 | 597 | 0.690 | 0.972 | 6.770 | 1.312 |
| EC04 | 40 (M) | B14/B51 | <50 | 950 | 0.876 | 1.142 | 0.652 | 0.467 |
| EC05 | 45 (M) | B27/B49 | <50 | 676 | 1.645 | 3.993 | 1.855 | NR |
| EC06 | 47 (F) | B07/B55 | <50 | 429 | 0.515 | 1.103 | 0.422 | 3.003 |
| EC07 | 48 (F) | B51/B57 | <50 | 963 | NR | 1.387 | NR | NR |
| EC08 | 54 (F) | B07/B55 | <50 | 414 | 1.144 | NR | 2.534 | NR |
| EC09 | 42 (F) | B35/B53 | <50 | 562 | 1.535 | 1.136 | 2.285 | 1.486 |
| RC01 | 43 (F) | B08/B27 | 60 | 714 | NR | 4.296 | 1.533 | 0.459 |
| RC02 | 34 (M) | NA | 173 | 555 | NR | 2.952 | 2.260 | NR |
| RC03 | 44 (F) | B14/B44 | 269 | 470 | 2.585 | 0.921 | 0.302 | 1.131 |
| RC04 | 45 (M) | B38/B44 | 356 | 428 | 8.049 | 3.726 | NR | 0.332 |
| RC05 | 36 (F) | NA | 392 | 580 | NR | 0.423 | NR | 0.750 |
| RC06 | 26 (F) | B13/B18 | 537 | 783 | 0.663 | 0.301 | 1.943 | 0.312 |
| RC07 | 40 (M) | NA | 540 | 719 | 0.336 | 0.831 | 0.362 | NR |
| RC08 | 41 (M) | B40/B44 | 623 | 624 | NR | 1.903 | NR | NR |
| RC09 | 44 (F) | B14/B35 | 675 | 412 | 1.398 | 1.519 | 0.768 | 1.719 |
| RC10 | 25 (F) | NA | 851 | 497 | 0.306 | NR | 0.559 | NR |
| RC11 | 46 (F) | B07/B45 | 979 | 289 | 0.946 | 3.547 | 2.146 | 3.147 |
| NC01 | 46 (M) | B14/B51 | 2,150 | 319 | 0.360 | 2.069 | 0.463 | NR |
| NC02 | 49 (F) | B35/B50 | 2,930 | 291 | 0.933 | 2.017 | 6.273 | 0.628 |
| NC03 | 26 (F) | B51/B52 | 5,100 | 726 | NR | 1.524 | 0.601 | 0.315 |
| NC04 | 48 (M) | B40/B44 | 6,350 | 151 | 0.301 | 0.342 | NR | 1.025 |
| NC05 | 44 (F) | B07/B15 | 10,000 | 347 | NR | 5.514 | 0.309 | 5.114 |
| NC06 | 33 (M) | B50/B57 | 10,400 | 152 | NR | NR | 0.334 | 0.375 |
| NC07 | 45 (F) | B45/B51 | 18,399 | 572 | 0.351 | 0.332 | 0.499 | 0.378 |
| NC08 | 52 (M) | B08/B50 | 20,000 | 450 | 0.502 | 1.455 | 0.539 | NR |
| NC09 | 26 (F) | B18/B58 | 26,700 | 478 | 0.954 | 2.181 | 0.734 | NR |
| NC10 | 40 (M) | B18/B37 | 35,800 | 575 | NR | NR | 0.306 | 0.433 |
| NC11 | 43 (F) | B07/B18 | 40,500 | 414 | 0.622 | 0.596 | 2.522 | 1.784 |
| NC12 | 40 (M) | B07/B14 | 40,500 | 984 | NR | 1.254 | NR | NR |
| NC13 | 43 (M) | NA | 43,400 | 457 | NR | NR | 0.300 | 0.565 |
| NC14 | 45 (M) | B15/B44 | 49,400 | 567 | NR | NR | 3.024 | 0.356 |
| NC15 | 47 (M) | NA | 51,800 | 94 | 0.346 | 0.659 | NR | 1.356 |
| NC16 | 39 (F) | B08/B27 | 67,205 | 355 | 1.272 | NR | 1.222 | NR |
| NC17 | 45 (M) | NA | 88,700 | 650 | NR | NR | 0.970 | NR |
| NC18 | 41 (M) | NA | 107,000 | 355 | NR | 1.526 | 0.775 | 0.730 |
| NC19 | 32 (M) | B18/B35 | 109,000 | 479 | NR | NR | NR | NR |
| NC20 | 42 (M) | B35/B45 | 152,000 | 259 | NR | 2.441 | 1.186 | 0.961 |
M, male; F, female.
Percentage of cytokine-based T cell response after Gag (HIV)- or pp65 (CMV)-specific stimulation. NR, nonresponder.
NA, not available.
Immature HIV-specific CD4 T cells are increased in elite controllers and are associated with spontaneous control of HIV viremia.
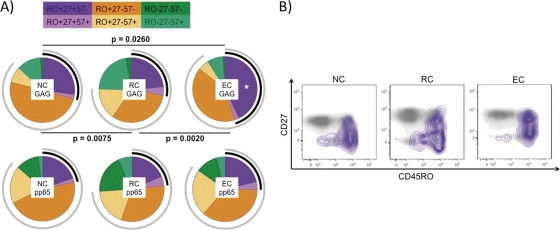
To analyze the level and characteristics of the HIV-specific response better, only subjects categorized as responders (Table 1) were considered. Absolute numbers of HIV-specific CD4 T cells were increased in the EC group (for EC versus NC, P = 0.0041). Maturation patterns of the HIV-specific CD4 cell responses were then analyzed. As shown in Fig. 2A, all three groups showed statistically significantly different maturation profiles as defined by surface expression of CD45RO, CD27, and CD57. The EC group had a significantly increased frequency of the most immature (CD4+ CD45RO+ CD27+ CD57−; Mem57−) T cell subset (Fig. 2B). Nevertheless, when maturation patterns of CMV-specific T cell responses were analyzed, no differences were found between groups. Absolute numbers of the Mem57− CD4 cell subset were significantly increased in EC (for EC versus NC, P = 0.038; for EC versus RC, P = 0.0311), but not in RC, compared to NC (for RC versus NC, P = 0.7577).
Fig 2.
Gag-specific CD4 T cell response. (A) Maturation patterns (analyzed by CD45RO, CD27, and CD57 expression) of pp65- and Gag-specific T cells. Black arcs correspond to CD27 expression, and gray arcs correspond to CD45RO expression. Statistically significant differences among the maturation patterns are shown in the figure. Gag-specific CD4 T cells with the CD45RO+ CD27+ CD57− (Mem57−) maturation profile were increased significantly (*) in the EC group. (B) Gag-specific CD4 T cells (defined by intracellular cytokine production of IFN-γ, TNF-α, and/or IL-2) are shown with purple isobars and overlaid onto two-dimensional plots for total CD4+ T cells plotted against CD27 and CD45RO. EC, elite controllers; RC, relative controllers; NC, noncontrollers.
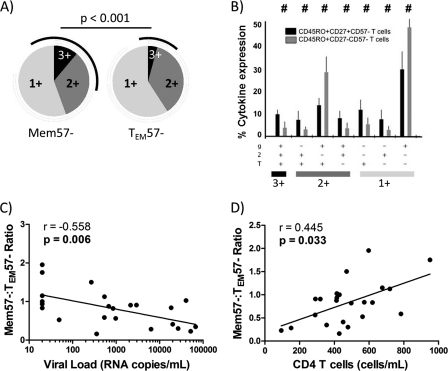
To determine whether HIV-specific Mem57− CD4 T cells were more polyfunctional than their more mature counterparts, cytokine expression patterns were determined for immature (Mem57−) and mature effector (CD4+ CD45RO+ CD27− CD57−; TEM57−) HIV-specific CD4 T cells. When the average polyfunctionality was analyzed, a higher frequency of IFN-γ+ TNF-α+ IL-2+ (3-function) polyfunctional T cells was observed in the Mem57− immature subset than in the TEM57− subset (Fig. 3A). In addition, all IL-2-expressing phenotypes were also more frequent in the immature subset (Fig. 3A and B). Only the less polyfunctional phenotypes, i.e., IFN-γ+ TNF-α+ IL-2− and IFN-γ+ TNF-α− IL-2−, were overrepresented in the HIV-specific mature CD4 T cell subset (Fig. 3B). Since HIV-specific Mem57− CD4 T cells were increased in the EC group, while RC and NC HIV-specific responses showed a more mature profile, and since both subsets showed different polyfunctionality profiles, we tested whether the HIV-specific Mem57−/TEM57− CD4 T cell ratio could be associated with the patient's CD4 T cell count and viral load. Interestingly, higher ratios were associated with both lower viral loads (Fig. 3C) and higher absolute CD4 T cell counts (Fig. 3D). A higher Mem57−/TEM57− ratio could be achieved by two different situations: (i) accumulation of Mem57− immature T cells that do not progress to TEM maturational status and (ii) a higher loss of TEM T cells because of cells undergoing terminal differentiation. However, as shown in Fig. 2A, terminally differentiated CD4 T cells (CD27− CD45RO−) were not increased in the EC group, suggesting that EC somehow preserve the immature phenotype of HIV-specific CD4 T cells.
Fig 3.
Gag-specific CD4 T cell maturation patterns and immunovirological status. (A) Pie charts showing Mem57− (CD45RO+ CD27+ CD57−) and TEM57− (CD45RO+ CD27− CD57−) HIV-specific T cells which produce 1, 2, or 3 functional responses to Gag stimulation. Black arcs show IL-2-containing functional responses. (B) Comparison of functionality of Gag-specific memory CD4 T cells (black bars) and Gag-specific effector CD4 T cells (gray bars). T, TNF-α; 2, IL-2; g, IFN-γ. (C) Correlation between the TEM57−/Mem57− ratio and HIV load. (D) Correlation between the TEM57−/Mem57− ratio and total peripheral CD4 T cell counts.
Mature HIV-specific CD8 T cells with differential functional profiles are overrepresented in elite controllers.
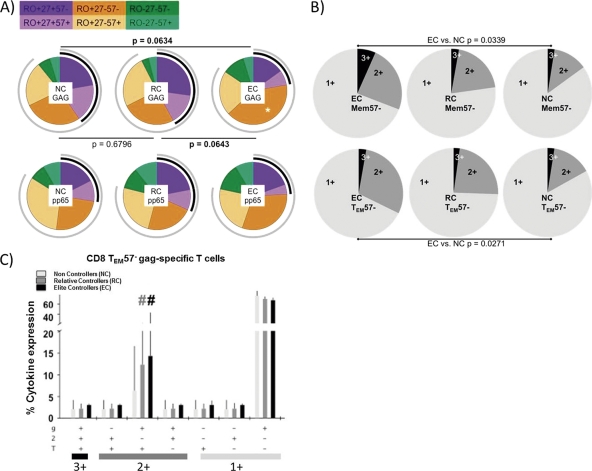
When the standard virus-specific CD8 cell response was analyzed, no differences were found among the different HIV groups (data not shown), as previously reported for HIV-specific CD8 T cells (1). However, EC showed different maturation patterns from those of RC or NC (Fig. 4A). Both RC and NC showed similar HIV response profiles, while EC HIV-specific CD8 T cells preferentially showed a mature phenotype (TEM57−) (Fig. 4A), to the detriment of more immature (Mem57−) subsets. Polyfunctionality levels of these subsets were then analyzed. EC showed higher frequencies of polyfunctional HIV-specific T cells in both the Mem57− and TEM57− subsets (Fig. 4B). However, when all functions were analyzed separately, TEM57− mature HIV-specific CD8 T cells showed a statistically significant increase in IFN-γ+ TNF-α+ IL-2− double-positive T cells in the EC group (Fig. 4C). Mem57− immature CD8 T cells, however, showed similar cytokine expression in every HIV group (data not shown).
Fig 4.
Gag-specific CD8 T cell response. (A) Maturation patterns of pp65- and Gag-specific CD8 T cells. Black arcs correspond to CD27 expression, while gray arcs correspond to CD45RO expression. Statistically significant differences among the pies are shown. Gag-specific CD8 T cells with the TEM57− maturation profile were increased significantly (*) in the elite controller group. (B) Individual pie charts show Mem57− and TEM57− HIV-specific T cells which produce 1, 2, or 3 functional responses to Gag stimulation for every HIV group. (C) Comparison of functionality of Gag-specific TEM57− effector T cells among the different HIV groups. T, TNF; 2, IL-2; g, IFN-γ; EC, elite controllers; RC, relative controllers; NC, noncontrollers. #, P < 0.05.
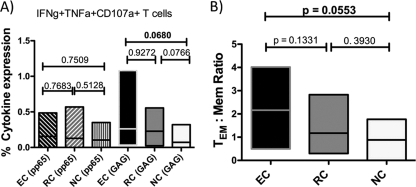
Since degranulation and cellular killing play an important role in viral control, we determined the frequency of cytotoxic T lymphocytes (CTL) which surface mobilized CD107a and produced perforin (PRF1) in response to antigenic stimuli. No difference in the frequency of PRF1-producing cells was observed between HIV- and CMV-specific T cells (data not shown). However, although not statistically significant, there was a trend toward a higher-frequency IFN-γ+ TNF-α+ CD107a+ triple-positive subset in the EC group (Fig. 5A). Expression of this polyfunctional subset in the CMV-specific CD8 T cell response was unchanged among the different groups analyzed. To determine whether the relationship between mature and immature HIV-specific CD8 T cells might influence the efficacy of the HIV-specific CD8 T cell response, we calculated the TEM/Mem ratio of these CD107a-expressing polyfunctional T cells. Again, although the difference was just short of statistical significance, the EC group showed higher ratios (namely, a more mature, CD27− response) than the other groups (Fig. 5B).
Fig 5.
Polyfunctional Gag-specific CD8 T cells. (A) Elite controllers have increased percentages of Gag-specific IFN-γ+ TNF-α+ CD107a+ T cells, while levels of pp65-specific IFN-γ+ TNF-α+ CD107a+ T cells are similar in every group. (B) The TEM/Mem ratio for Gag-specific IFN-γ+ TNF-α+ CD107a+ T cells is increased in elite controllers. TEM cells, CD45RO+ CD27− cells; Mem cells, CD45RO+ CD27+ cells; EC, elite controllers; RC, relative controllers; NC, noncontrollers.
Maturation profiles overrepresented in elite controllers are directly correlated in all HIV-infected patients.
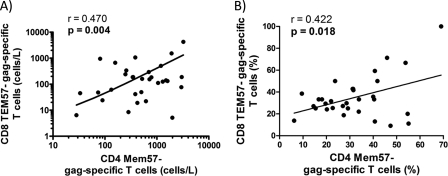
Finally, to test whether the presence of the more immature, more polyfunctional Mem57− CD4 T cells might help to support the more polyfunctional, more mature TEM57− CD8 T cells, we compared the levels of these CD4 and CD8 T cell subsets in all HIV-infected individuals in our cohort. As shown in Fig. 6, individuals with a larger immature HIV-specific CD4 cell response also had higher frequencies of TEM57− HIV-specific CD8 cell response for both absolute numbers and percentages (Fig. 6A and B, respectively). This result strongly suggests that the maintenance of a less mature memory CD4+ T cell population provides the necessary T cell help for optimal maturation of effective CD8+ T cell responses.
Fig 6.
Relationship between Gag-specific CD4 and CD8 T cell responses. A higher CD8 TEM57− Gag-specific T cell response is directly correlated with a higher CD4 Mem57− Gag-specific T cell response by both absolute numbers (A) and percentages (B).
DISCUSSION
Our results show that higher frequencies of HIV-specific TEM57− CD8 T cells are associated with spontaneous control of HIV replication in EC and suggest that the maintenance of these cells is important in controlling HIV infection. In addition, these data argue that it is important to maintain HIV-specific Mem57− CD4 cells during HIV infection; these cells most likely play an important role in support of the TEM57− CD8 T cell population.
The lack of HIV-specific proliferative CD4 cell responses is a hallmark of progressive HIV infection (14, 23). Our data confirm and extend the observations of others which have shown that individuals who are able to spontaneously control HIV replication are more likely to have a high frequency of HIV-specific CD4 T cells that produce IL-2 when stimulated. Production of IL-2 by CD4 T cells has consistently been associated with increased replicative capacity. In contrast, we found no difference in CMV-specific CD4+ T cell responses between controllers and NC, with CMV infection being controlled by both groups of individuals in our cohort. The EC and RC groups had the same frequency of HIV-specific CD8+ T cells (90%). However, EC had more HIV-specific CD4 T cells (89%) than RC (64%), thus revealing differences in HIV-specific responses between the EC and RC groups. It should be noted that while EC and RC always had an HIV-specific CD4 and/or CD8 cell response, 30% of the NC individuals completely lacked measurable HIV-specific T cells. This straightforward analysis shows the importance of T cell responses in HIV replication control.
Not only did EC have a higher magnitude of HIV-specific CD4 T cell response than RC, but they also had more polyfunctional T cells with a particular maturation phenotype. In agreement with this result, Emu et al. (8) previously reported that lower VLs (VLs of <10,000 RNA copies/ml in untreated or highly active antiretroviral therapy [HAART]-treated, partially suppressed individuals) were associated with higher percentages of memory CD4 T cells. For the HIV controller scenario, Potter et al. (21) compared RC subjects (defined as those having HIV VLs of <400 RNA copies/ml) to NC and found similar rates of IFN-γ-producing HIV-specific CD4 T cells in both groups. They also showed that p24-specific central memory (CD45RA− CCR7+) and effector memory (CD45RA− CCR7−) CD4 T cells from RC showed higher frequencies of IL-2 production than similar cells from NC. We extended these results by showing that HIV-specific CD4 T cells are increased in EC compared to RC. Our study extends this interesting work by demonstrating a greater effect in EC, which strongly suggests the importance of retaining a relatively immature phenotype in the CD4 T cell subset for the spontaneous control of HIV replication.
In contrast to our results, Addo et al. (1) reported that terminally differentiated (CD45RA+ CCR7−) HIV-specific cells are increased preferentially in RC compared to NC. Our data show that it is the CD27− CD45RO+ CD57− HIV-specific response that is increased significantly in controllers. This increase results in a more effective polyfunctional response (4). We saw no difference between the functional responses of NC, RC, and EC for the CD27− CD45RO− CD57− CD8+ population. In addition, we saw no significant difference in the frequency of the CD27− CD45RO− CD57− CD8+ T cell response in these groups. Several differences in experimental design could contribute to this difference. Addo et al. did not use asymptomatic viremic progressors as we did, and they also used different maturation markers. In addition, Addo et al. used single peptides, whereas we used pooled consensus Gag 15-mers overlapping by 11 amino acids.
In a recent study, a new functional feature of EC, i.e., rapid secretion of perforin (PRF1), was related to viral load control. Hersperger et al. (11) reported PRF1 level differences between EC and chronic progressors (CP), while EC and RC had similar Gag-specific PRF1 expression. Like Hersperger et al. (11), we included both surface mobilization of CD107a and increased PRF1 production as markers of cytolytic activity to determine whether subsets with different maturation patterns also showed enhanced cytotoxicity. Mature HIV-specific CD8 T cells from EC, but not CMV-specific T cells, showed an increase in the IFN-γ+ TNF-α+ CD107a+ triple-positive subset, suggesting that more mature HIV-specific CD8 T cells have higher cytotoxic abilities. However, we observed no differences in isolated PRF1 expression among our HIV groups. Hersperger et al. set their cutoff for CP as a load of >10,000 RNA copies/ml (9), while we set our cutoff at >2,000 RNA copies/ml. A limitation of our study is the modest number of EC analyzed (n = 9), since these patients, representing less than 1% of the overall total of HIV-infected patients, are difficult to recruit. Therefore, the lack of differences observed in the current study could be related to small sample numbers, and increased PRF1 levels may be detected in a larger cohort.
Despite the need for further longitudinal studies to establish whether these maturation phenotypes are the cause or consequence of the spontaneous control of viremia, our results strongly suggest that less mature HIV-specific “central memory-like” CD4+ T cells, by providing the required T cell help for optimal maturation of the “effector memory-like” HIV-specific T cell population, play an important role in the control of HIV replication. Immunotherapeutic trials should attempt to foster conditions which result in the production and maintenance of these cell types.
ACKNOWLEDGMENTS
We thank all patients for their help. We also acknowledge Marien Gutiérrez Sancho, Francisca Cano, and Magdalena Rodríguez for their priceless help with patient management.
S.F.-M. and E.R.-M. received grants from the Fondo de Investigaciones Sanitarias (CD10/00382 and CP08/00172, respectively). This study was supported by Redes Temáticas de Investigación en SIDA (ISCIII RETIC RD06/0006/0035 and RD06/0006/0021), Proyecto de Excelencia, CICE (P10-CTS-6313), Consejería de Salud, SAS (PI-0270, PI-0066, and PI0278), and Fondo de Investigación Sanitaria (PS09-00120). This work was funded in part by the Intramural Research Program of the Vaccine Research Center, National Institute of Allergy and Infectious Diseases, National Institutes of Health.
Footnotes
Published ahead of print 25 January 2012
REFERENCES
- 1. Addo MM, et al. 2007. Fully differentiated HIV-1 specific CD8+ T effector cells are more frequently detectable in controlled than in progressive HIV-1 infection. PLoS One 2:e321. [DOI] [PMC free article] [PubMed] [Google Scholar]
- 2. Almeida JR, et al. 2007. Superior control of HIV-1 replication by CD8+ T cells is reflected by their avidity, polyfunctionality and clonal turnover. J. Exp. Med. 204:2473–2485 [DOI] [PMC free article] [PubMed] [Google Scholar]
- 3. Appay V, et al. 2002. Memory CD8+ T cells vary in differentiation phenotype in different persistent virus infections. Nat. Med. 8:379–385 [DOI] [PubMed] [Google Scholar]
- 4. Betts MR, et al. 2006. HIV nonprogressors preferentially maintain highly functional HIV-specific CD8+ T cells. Blood 107:4781–4789 [DOI] [PMC free article] [PubMed] [Google Scholar]
- 5. Candotti D, et al. 1999. Status of long-term asymptomatic HIV-1 infection correlates with viral load but not with virus replication properties and cell tropism. J. Med. Virol. 58:256–263 [PubMed] [Google Scholar]
- 6. Casazza JP, et al. 2006. Acquisition of direct antiviral effector functions by CMV-specific CD4+ T lymphocytes with cellular maturation. J. Exp. Med. 203:2865–2877 [DOI] [PMC free article] [PubMed] [Google Scholar]
- 7. Champagne P, et al. 2001. Skewed maturation of memory HIV-specific CD8 T lymphocytes. Nature 410:106–111 [DOI] [PubMed] [Google Scholar]
- 8. Emu B, et al. 2005. Phenotypic, functional and kinetic parameters associated with apparent T-cell control of human immunodeficiency virus replication in individuals with and without antiretroviral treatment. J. Virol. 79:14169–14178 [DOI] [PMC free article] [PubMed] [Google Scholar]
- 9. Fellay J, et al. 2007. A whole-genome association study of major determinants for host control of HIV-1. Science 317:944–947 [DOI] [PMC free article] [PubMed] [Google Scholar]
- 10. Ferrando-Martínez S, Ruiz-Mateos E, Leal M. 2009. CD27 and CCR7 expression on naive T cells, are both necessary? Immunol. Lett. 127:157–158 [DOI] [PubMed] [Google Scholar]
- 11. Hersperger AR, et al. 2010. Perforin expression directly ex vivo by HIV-specific CD8+ T-cells is a correlate of HIV elite control. PLoS Pathog. 6:e1000917. [DOI] [PMC free article] [PubMed] [Google Scholar]
- 12. Hersperger AR, Migueles SA, Betts MR, Connors M. 2011. Qualitative features of the HIV-specific CD8+ T-cell response associated with immunologic control. Curr. Opin. HIV AIDS 6:169–173 [DOI] [PMC free article] [PubMed] [Google Scholar]
- 13. Jagannathan P, et al. 2009. Comparisons of CD8 T cells specific for human immunodeficiency virus, hepatitis C virus and cytomegalovirus reveal differences in frequency, immunodominance, phenotype and interleukin-2 responsiveness. J. Virol. 83:2728–2742 [DOI] [PMC free article] [PubMed] [Google Scholar]
- 14. Krowka JF, et al. 1989. Lymphocyte proliferative responses to human immunodeficiency virus antigens in vitro. J. Clin. Invest. 83:1198–1203 [DOI] [PMC free article] [PubMed] [Google Scholar]
- 15. Lambotte O, et al. 2005. HIV controllers: a homogeneous group of HIV-1 infected patients with spontaneous control of viral replication. Clin. Infect. Dis. 41:1053–1056 [DOI] [PubMed] [Google Scholar]
- 16. Lichterfeld M, et al. 2004. HIV-1-specific cytotoxicity is preferentially mediated by a subset of CD8(+) T cells producing both interferon-gamma and tumor necrosis factor-alpha. Blood 104:487–494 [DOI] [PubMed] [Google Scholar]
- 17. Migueles SA, et al. 2000. HLA B*5701 is highly associated with restriction of virus replication in a subgroup of HIV-infected long term nonprogressors. Proc. Natl. Acad. Sci. U. S. A. 14:2709–2714 [DOI] [PMC free article] [PubMed] [Google Scholar]
- 18. Migueles SA, et al. 2008. Lytic granule loading of CD8+ T cells is required for HIV-infected cell elimination associated with immune control. Immunity 29:1–13 [DOI] [PMC free article] [PubMed] [Google Scholar]
- 19. Peris-Pertusa A, et al. 2010. Evolution of the functional profile of HIV-specific CD8+ T cells in patients with different progression of HIV infection over 4 years. J. Aquir. Immune Defic. Syndr. 55:29–38 [DOI] [PubMed] [Google Scholar]
- 20. Porichis F, Kaufmann DE. 2011. HIV-specific CD4 T cells and immune control of viral replication. Curr. Opin. HIV AIDS 6:174–180 [DOI] [PMC free article] [PubMed] [Google Scholar]
- 21. Potter SJ, et al. 2007. Preserved central memory and activated effector memory CD4+ T cell subsets in human immunodeficiency virus controllers: an ANRS EP36 study. J. Virol. 81:13904–13915 [DOI] [PMC free article] [PubMed] [Google Scholar]
- 22. Roederer M, Nozzi JL, Nason MC. 2011. SPICE: exploration and analysis of post-cytometric complex multivariate datasets. Cytometry A 79:167–174 [DOI] [PMC free article] [PubMed] [Google Scholar]
- 23. Wahren B, et al. 1987. Characteristics of the specific cell-mediated immune response in human immunodeficiency virus infection. J. Virol. 61:2017–2023 [DOI] [PMC free article] [PubMed] [Google Scholar]
- 24. Younes SA, et al. 2003. HIV-1 viremia prevents the establishment of interleukin 2-producing HIV-specific memory CD4+ T lymphocytes endowed with proliferative capacity. J. Exp. Med. 198:1909–1922 [DOI] [PMC free article] [PubMed] [Google Scholar]


