

1. Introduction
Diffusion magnetic resonance imaging (diffusion MRI) is an imaging technique that is sensitive to three-dimensional diffusion of water molecules in the brain. The presence of microstructural barriers leads to an anisotropic diffusion pattern. This diffusion pattern is frequently represented by a tensor, from which white matter microstructural properties may be inferred and the underlying white matter orientation visualized (Basser PJ et al, 1994; Conturo TE et al, 1999; Mori S et al, 2002; Westin CF et al, 2002). Tractography algorithms have been proposed to characterize the connectivity of white matter fiber bundles (Basser PJ et al, 2000; Catani M et al, 2002; Conturo TE et al, 1999; Westin CF et al, 2002). Diffusion imaging and tractography is subject to certain artifacts and pitfalls that must be taken into consideration with respect to diffusion imaging (Le Bihan D et al, 2006). Partial volume mixing and proximity of a pathway to other pathways containing many more tracts propagating in a different direction are some of the factors that introduce errors, or even cause certain pathways to be missed completely. Nevertheless, these techniques are increasingly used for their capability to characterize white matter microstructure and connectivity, for which conventional MR is not sufficiently sensitive (Pagani E et al, 2005; Parker GJ and Alexander DC, 2003; Reich DS et al, 2006; Tuch DS 2004; Tuch DS et al, 2002).
Many important clinical applications of diffusion tractography involve delineation of specific WM fiber bundles. For example, presurgical applications generally conduct risk assessment exclusively on the fiber bundles located within or in the vicinity of a planned surgical site (Qiu TM et al, 2010; Spena G et al, 2010; Yogarajah M et al, 2009). Evaluation of disease progression in neurodegenerative disorders similarly involve regional assessment of axonal integrity, often focused on the fiber bundle impacted by disease progression (Goldberg-Zimring D et al, 2005; Pagani E et al, 2005; Reich DS et al, 2006; Sage CA et al, 2007). Consequently, separating the streamlines identified by whole brain tractography into distinct bundles is a fundamental step in many relevant clinical applications. However, classification of thousands of WM streamlines into specific fiber bundles remains a challenging task. The most frequently used technique applies prior knowledge regarding the fiber bundle’s path through the anatomy in order to manually define tractography seeding, selection, and/or exclusion regions—a strategy commonly referred to as multiple regions-of-interest (MROI) (Catani M et al 2002 and 2008; Mori S et al, 2002; Wakana S et al, 2007; Zhang W et al, 2008; Zhang Y et al, 2010). Other less widely used approaches include clustering methods (Maddah M et al, 2008; Niethammer M et al, 2006; O’Donnell LJ et al, 2006), and fiber bundle segmentation approaches (Eckstein I et al, 2009; Jonasson L et al, 2005). In the present study, we implemented the MROI approach because it is a well-accepted technique with some favorable characteristics: MROI is independent of arbitrary feature space divisions or segmentation thresholds and unlike bundle template matching approaches (Hua K et al, 2008) MROI allows tractography in the subject tensor volume, by this means preserving individual variability in the fiber trajectories. However, the manual drawing of MROI is time-consuming, requires extensive training, and presents opportunity for human fatigue, error, or expert variability to negatively affect the fiber bundle outcome. As such, automated detection of fiber bundles is a topic addressed with increasing frequency in the literature (Li H et al, 2010; Nazem-Zadeh MR et al, 2011; Oishi K et al, 2009; Voineskos AN et al, 2009; Zhang W et al, 2008; Zhang Y et al, 2010).
A basic step which is common to many recently proposed automated bundle detection algorithms is inter-subject alignment of multiple image volumes. This alignment process often involves an atlas composed of a single reference anatomy (Oishi K et al, 2009; Zhang W et al, 2008; Zhang Y et al, 2010), or composed of multiple reference anatomies (Li H et al, 2010; O’Donnell LJ et al., 2007; Voineskos AN et al, 2009). However, it has not been studied whether the use of an atlas introduces avoidable errors in the bundle detection scheme. It is not yet clear for example how atlas-to-subject alignments will ultimately impact results when the atlas is composed of a single reference anatomy, compared to it being composed of multiple reference anatomies. An additional avenue open for research is in the methodologies used for inter-subject anatomical alignments. A study using MROI recently demonstrated improved results when implementing inter-subject nonrigid alignments, as compared to rigid or affine alignment (Zhang Y. et al, 2010). However, it has not been shown whether inter-subject MROI alignments should be performed based on anatomical scalar images (such as MPRAGE), or if there are benefits to alignment utilizing the full tensor. Although, previous work by others suggests that superior results may be obtained by utilizing the directional information derived from diffusion imaging (Park HJ et al, 2003; Ruiz-Alzola J et al, 2002), other work has concluded structural MRI is superior for alignment (Zöllei L et al, 2010).
In this article, we propose and evaluate a consensus template fusion approach for identifying MROI. This overcomes the disadvantages of the manual process, by removing the need for interactive delineation of MROI, reducing the requirement for extensive training, and avoiding the opportunity for human fatigue, error, or expert variability to negatively affect the fiber bundle delineation. We present a comparative study of three methodologies for the automated detection of white matter fiber bundles. Fiber bundles obtained by the automated methods were compared against reference standard bundles delineated by manually drawn MROI in the same subjects. We evaluated the relative error in fiber bundle delineation when using different MR contrast types for inter-subject nonrigid alignments—we evaluated standard T1-weighted MPRAGE, scalar fractional anisotropy, and full tensor data. We then evaluated the comparative performance of the proposed automated methods for automatically reproducing six clinically important fiber bundles of interest in twenty healthy volunteers.
Based on our findings, we recommend our proposed MROI consensus map algorithm for the identification of white matter fiber bundles. It is capable of reproducing the outcomes obtained by the manual procedure. The innovation of this algorithm is the detection of MROI by performing a statistical fusion of multiple templates individually aligned to the target of interest. Through our evaluation experiments, we identified full tensor MR for inter-subject alignment as leading to the most accurate delineation of fiber bundles. Furthermore, the statistical fusion of multiple templates provides a consensus map of the MROI while preserving anatomical variability of the resulting white matter fiber bundles in the individual target.
2. Material and Methods
2.1 Subjects
We enrolled an age-matched group of 20 young volunteers (Mean: 17.8 yrs, SD: 1.1 yrs) with no history of neurobiological disorders; 10 males and 10 females. In compliance with Institutional Review Board guidelines, institutional study approval and signed individual participant consent forms were obtained for each volunteer.
2.2 Acquisition and preparation of MRI images
All of the study participants underwent MRI scanning at three Tesla using a Magnetom Trio scanner (Siemens, Erlangen, Germany). Anatomical T1-weighted and diffusion tensor images of the head were acquired for each participant.
The preparation of MR images consisted of generating for every study subject a set of similarly sampled, skull-stripped, and anatomically aligned T1-weighted (T1w), fractional anisotropy (FA), and diffusion tensor volumes (DT). This was done by the procedures that follow.
2.2.1 T1-weighted images
We acquired high-resolution 3D Magnetization Prepared Rapid Acquisition Gradient Echo (MPRAGE) T1-weighted images using a 32-channel head coil; we used 1.0mm thick contiguous axial slices and 0.8×0.8×1.0 mm3 voxels covering the entire head, TR/TE=1410ms/2.27ms, TI=800 ms, and flip angle=9°.
A segmentation of the intracranial cavity was created from this T1-weighted image using a previously described algorithm (Grau V et al, 2004; Weisenfeld NI and Warfield SK, 2009). The resulting intracranial segmentation was used as a mask to skull-strip all images volumes prior to anatomical alignments.
2.2.2 Diffusion images and tensor estimation
We acquired high spatial resolution diffusion weighted images using 30 directions and 5 baselines, B value=1000s/mm2; we used 2mm thick contiguous slices and isotropic 2×2×2 mm3 voxels covering the entire brain. In order to minimize eddy current distortion, a double balanced gradient scheme was applied (Reese TG et al, 2003). To achieve the smallest possible TE in order to minimize geometric distortion and signal loss, a parallel acquisition with an acceleration factor of 2 was used with a 32-channel head coil.
Compensation for residual distortions and patient motion was achieved by affine registration of all diffusion images to the b=0s/mm2 image using maximization of mutual information. The gradient directions were appropriately reoriented using previously described methods (Ruiz-Alzola J et al, 2002). We rigidly aligned the T1w image in order to match the corresponding diffusion images.
Least squares estimation was used at each diffusion image voxel to estimate a single tensor model derived from the 30 diffusion weighted images. The resulting DT volumes were used for fiber tracking and for producing the following scalar images:
FA – a standard fractional anisotropy image computed based on the relative prominence of the primary eigenvalue of the diffusion tensors.
color-coded FA – a red, green, and blue color-coded image derived from the diffusion tensor volume by projection of the primary eigenvector onto the orthogonal anatomical axes, with intensity modulated by FA (Douek P et al, 1991). This color-coded FA image serves as the reference frame for manual drawing of MROI.
2.3 Fiber tracking
We implemented a stochastic streamline tractography algorithm that combines the speed and efficacy of deterministic decision making at each voxel, with probabilistic sampling from the space of all streamlines. Streamlines were initialized at stochastically sampled locations inside the seeding MROI, and were constructed by stepping with sub-voxel resolution through the DT volume. For each potential trajectory we avoided loss of connectivity due to local aberrations by incorporating a low pass filter along the estimated pathway. The propagation of each streamline was terminated if the FA fell below 0.20, or if the tract trajectory angle exceeded 30 degrees (Van Hecke W et al, 2008). Only streamlines meeting the MROI select and/or exclude criteria were kept (MROI regions are described in Section 2.4).
Each streamline was determined in the following way: Ten trajectories per DT voxel inside the seed MROI are initiated in both directions parallel to the primary eigenvector. Direction of propagation, trajectory FA and trajectory angle are computed at every step as a linear combination of the current direction, FA, and angle, and the previous values of these quantities accumulated along the trajectory. Specifically, from each point pk, a new point along the trajectory is identified by stepping, with a fixed step size (s), in the direction indicated by the local tract orientation estimate (vk), such that: pk+1 = pk + vk s Each new point of the streamline, pk+1, is tested to ensure it resides inside the boundary defined by the intracranial cavity mask, a log-Euclidean estimate of the tensor at that point is then computed based on the tensors from the surrounding voxel neighborhood. The stepping direction is determined by a linear combination of tensor deflection (Lazar M et al, 2003) and primary eigenvector orientation, while the stopping criteria are based on minimum FA and step angle. To ensure trajectories meet the requirements of the known bundle anatomy, all streamlines must pass through selection MROI and were rejected if they passed through exclusion MROI.
2.4 Reference standard fiber bundles
For the purposes of this study, we have selected six white matter fiber bundles based on common clinical applications and their relevance to neurologic disorders. However, we expect that other fiber bundles not included in this list can be automatically detected in a similar fashion to those studied here.
Representative bundles of interest are denoted as follows:
CC – corpus callosum
SLF – superior longitudinal fasciculus
TR – anterior and superior thalamic radiation
CST – corticospinal tract
Cg – cingulum
OR – optic radiation
Initially, these bundles were delineated by expert manual drawing of MROI (referred to as templates), based on color-coded FA anatomical landmarks as previously described by others; fiber bundles derived by the manual procedure later serve as the reference standards for evaluating the experimental automated methodologies. The MROI strategies used for each bundle are illustrated in Figures 1 and 2, and are outlined as follows:
Fig. 1.

The 2D outline of hand drawn template MROI (seeding regions in white, exclusion regions in red, and inclusion regions in yellow) shown overlaid on a representative color-coded FA images. The MROI strategy depicted was used to delineate six fiber bundles of interest (as labeled in each panel).
Fig. 2.

Six reference standard fiber bundles (labeled in each panel) generated from hand drawn template MROI. These representative fibers bundles (in white) are visualized as projections from the three dimensional pathways together with two dimensional color-coded FA images which illustrate the other nearby white matter structures.
-
CC fiber bundle, based on the MROI strategy described by Catani M and Mesulam M., 2008.
Seeding: approximately the 5 central sagittal slices outlining the red-colored lateral radiations of the corpus callosum
Exclusion: approximately the 5 central sagittal slices outlining the brainstem
-
SLF fiber bundle, based on the MROI strategy described by Catani M and Thiebaut de Schotten M., 2008; Catani M and Mesulam M., 2008; and Wakana S et al, 2007.
Seeding: two seeding regions in each cerebral hemisphere were used found in the vicinity of the temporoparietal junction, approximately 4 contiguous sagittal slices outlining the green, anterior-posterior radiation of the superior fasciculus, and 4 contiguous sagittal slices outlining the blue, inferior-superior radiations
Exclusion: in order to exclude fibers not belonging to the SLF, we used the CC seeding region, defined above, as an exclusion region for SLF
-
TR fiber bundle, based on the MROI strategy described by Catani M et al, 2008; Zhang Y et al, 2010; and Wakana S et al, 2007.
Seeding: approximately 4 contiguous axial slices outlining the purple-green colored radiations that define the anterior limbs of the internal capsule
Exclusion: in order to exclude fibers not belonging to the TR, we used the CC seeding region, defined above, as an exclusion region for TR
-
CST fiber bundle, based on the MROI strategy described by Zhang Y et al, 2010; and Wakana S et al, 2007.
Seeding: two seeding regions, one is approximately 4 contiguous axial slices outlining the blue colored radiations outlining the posterior limbs of the internal capsule, the second is defined as approximately 3 contiguous axial slices defining blue colored superior-inferior radiations visible in the brain stem at approximately the level of the decussating of the superior cerebellar peduncle
Exclusion: in order to exclude fibers not belonging to the CST, we used the CC seeding region as an exclusion region for CST
Inclusion: both of the CST seeding regions of the left and right hemispheres were also mutually used as inclusion regions—all fibers therefore needed to traverse both of the left, or both of the right, seeding regions in order to be selected
-
Cg fiber bundle, based on the MROI strategy described by Catani M et al, 2008; and Zhang Y et al, 2010.
Seeding: two seeding regions, approximately 4 contiguous axial slices outlining the cigar-shaped green colored radiations of the cingulum bundle superior to the corpus callosum, and approximately 3 contiguous axial slices outlining the narrow blue-purple inferior radiations of the cingulum, visible adjacent to the brain stem
Exclusion: in order to exclude fibers not belonging to the Cg, we used the CC seeding region as an exclusion region for Cg
-
OR fiber bundle, based on the MROI strategy described by Yogarajah M et al, 2009.
Seeding: approximately 3 contiguous coronal slices outlining the base of Meyer’s loop; Meyer’s loop is defined in the axial slice where transition from the external limb of the internal capsule to cerebral peduncle is visible
Exclusion: in order to exclude fibers not belonging to the OR, we used the CC seeding region as an exclusion region for OR
Inclusion: approximately 2 coronal slices outlining the green colored occipital horn at the level of lateral ventricle including the stratum sagittal—all of the fibers therefore needed to pass this inclusion region or else were excluded.
2.5 Description of automated methodologies
We designed three experimental methods for the projection of manually drawn template MROI from various reference anatomies to the target subject DT volume of interest. These transformations consisted in every case of rigid, affine, followed by nonrigid alignment of the corresponding images: we evaluate the T1w, FA, or DT image modalities for the alignment across subjects. Standard rigid and affine algorithms based on mutual information were used as initialization for the successive nonrigid alignment described below.
2.5.1 Description of nonrigid alignment algorithm
For the nonrigid alignment of T1w, FA, or DT image modalities, we applied a robust algorithm relying on a block matching strategy. This strategy, already used for other applications on anatomical images (Commowick O. et al; 2006, Garcia V et al, 2010) was here further extended to register the DT images using the full tensor information.
To find the nonrigid transformation T between a reference image R and a floating image F, such that R≈ F○T, we utilize the following general algorithm, independent of the image modality considered:
-
For each pyramid level p = 1…M
-
For each iteration l = 1…L
Estimate sparse pairings C between R and F○T l−1 using a block-matching technique
Interpolate a dense correction field δTl from the sparse pairings
Reject outliers from the sparse pairings field
Interpolate the outlier free transformation correction δT̃l
Compose δT̃l with the current estimate of the transformation Tl = Tl−1○δT̃l
Regularize the new estimate of the transformation
-
The sparse pairings were obtained at each iteration through a block-matching technique that was previously utilized for rigid alignment (Ourselin S et al, 2000 and 2002). The obtained sparse matches were then interpolated to obtain a dense deformation field using a convolution with a Gaussian function weighted by the confidence in the pairings.
To remove potential outliers in the matching process, we coupled this block-matching technique with an outlier rejection scheme: the interpolated displacements in δTl were compared to the original pairings and if found to be too different were removed from the interpolation scheme. We used this method for the dense nonrigid alignment as it is able to produce smooth deformation fields and copes well with large deformations.
Although the general algorithm is virtually independent of image modality, the block-matching technique requires defining a similarity measure to compute pairings. For the alignment of scalar modalities such as T1w or FA, we used the local correlation coefficient between the blocks as the similarity measure (Ourselin S et al, 2000). The procedure for nonrigid alignment of the full tensor volumes, DT, uses a multivariate cross correlation appropriate for full tensor matching. It was designed to compare the whole tensor structure, as an extension of the squared correlation coefficient, but now applied to vector variables. We define the similarity measure based on the total covariance matrix, Λ, as:
where elements Σ represent the covariance matrices between 6-dimensional vectors, X and Y. Here X correspnds to the log-tensors in a block of the reference image R, and Y corresponds to the log-tensors in the tested block of the resampled image, F ○ Tl−1. The correlation matrix, Γ, can then be defined as:
The generalized squared correlation coefficient GCC between blocks of tensors is then defined as the average of the canonical correlations as extracted from the correlation matrix:
This expression is therefore analogous to the average of the squared singular values of Γ(X,Y), as was previously introduced by others to evaluate multivariate association based on canonical correlation analysis (Cramer EM and Nicewander WA, 1979).
When applying the transformation, it was also crucial to reorient the tensors according to the local rotation of the transformation. We chose a finite strain reorientation strategy in order to reorient tensors (Ruiz-Alzola J et al, 2002). This approach identifies the local rotation from the local Jacobian matrix of the transform for reorientation of the tensors. Furthermore, we ensured that the transformed tensor images remained symmetric positive definite despite the required interpolation, and that the similarity was computed between tensors in the tensor manifold, rather than Euclidean space. This was done by carrying out all the computations on tensors (computation of the similarity measure and image resampling) in the Log-Euclidean framework (Arsigny V et al, 2006).
The resulting dense deformation fields determined from this alignment process were subsequently applied to template MROI, in effect projecting them from the reference anatomical frame to the target anatomical frame where fiber tracking was then initiated. The experimental methodologies we designed to automatically perform these transformations are described below; and are schematically outlined in Figure 3.
Fig. 3.

Flow chart depiction of Ss-proj, Atlas-proj, and Cns-mp automated fiber bundle delineation methodologies; notice each method takes in a specific MROI reference to project onto the target tensor volume of interest. Included in the schematic are the common steps of fiber tracking from projected MROI and production of probabilistic track density images.
2.5.2 Single subject projection
This approach simply projects template MROI from a single reference DT volume (i.e., a single reference atlas) to the target DT volume of interest. To test the reliability of this approach we performed 19 similar trials for each of the 20 study participants (leave-one-out). We refer to the single subject projection method as ‘Ss-proj’ from this point forward.
The Ss-proj algorithm takes in a single subject DT reference volume with hand drawn template MROI, and the target DT volume of interest, to execute the following algorithm:
-
Nonrigid alignment of the reference DT to the target DT volume
-
For each fiber bundle
Use dense deformation fields from nonrigid alignment to project template MROI from the reference to the target
Initiate tractography algorithm using projected MROI, delineating the fiber bundle in the target DT volume
Compute a probabilistic streamline density image from resulting bundle tractography (Peters JM et al, 2011)
-
2.5.3 Atlas projection
This methodology initially required the creation of a multiple reference DT atlas. This atlas was produced by first nonrigidly aligning 19 reference DT volumes (leave-one-out), and then computing the average using an atlas creation procedure previously described by others (Guimond A et al, 2000). The DT atlas produced by this method served two purposes: 1) production of a color-coded FA atlas which enabled manual drawing of template MROI; 2) was utilized for nonrigid alignments to the target DT volume of interest.
As such, template MROI initially manually drawn on the color-coded FA atlas were then projected to the target DT volume by way of atlas-to-target nonrigid alignment. We refer to this atlas projection method as ‘Atlas-proj’ from this point forward. Furthermore, we note that this method is similar to Ss-proj with the important difference that Ss-proj uses an atlas composed of a single reference DT volume while Atlas-proj uses an atlas composed of the average of 19 reference DT volumes.
The Atlas-proj algorithm takes in a multiple subject average DT atlas, hand drawn template MROI, and the target DT to perform the following algorithm:
-
Nonrigid alignment of the atlas DT to the target DT volume
-
For each fiber bundle
Project template MROI from the atlas to the target
Initiate tractography
Compute streamline density image
-
2.5.4 MROI consensus map
This methodology automatically determines a local consensus region from a collection of template MROI separately projected to the target DT volume. To do this we independently project 19 template MROI to the target of interest (leave-one-out) and then perform a consensus map analysis using the Simultaneous Truth and Performance Level Estimation (STAPLE) algorithm (Warfield SK et al, 2004). The underlying consensus for all of the projected templates consequently defines target-specific MROI which we then use for fiber tracking in the target DT. We refer to this consensus map method as ‘Cns-mp’ from this point forward.
The Cns-mp algorithm takes in multiple single subject DT reference volumes each with hand drawn template MROI, and a target DT volume of interest, to execute the following algorithm:
-
For each of 19 DT references in database
Perform parallel nonrigid alignment to the target DT volume
-
For each fiber bundle of interest
-
Use dense deformation fields from nonrigid alignments to project 19 template MROI from the reference DT volumes to the target DT volume
After all MROI templates are projected to target DT volume perform statistical analysis to determine the underlying consensus map
Use the consensus map MROI to initiate tractography
Compute streamline density image
-
In order to determine a target-specific MROI in the target DT volume, we first project the full set of MROI templates (n = 19) and from these compute the consensus map and performance parameters indicating how similar each template is to the consensus. Computation of consensus MROI was performed using the STAPLE algorithm (Warfield SK et al, 2004). This algorithm takes in a set of templates defined as label maps as an image matrix and performs the statistical analysis described in Appendix A. This approach computes the underlying target-specific MROI which most closely estimates the manually drawn MROI.
2.6 The evaluation procedure
Evaluation of the automated methods was based on how similar the resulting fiber bundles were to reference standard bundles derived by the manual procedure. As both approaches construct a collection of stochastically generated fiber trajectories and therefore a probabilistic streamline density image, bundle error was quantified by the root-mean-squared (RMS) difference between the resulting streamline density images. A number of approaches have been used to characterize the amount or certainty of connectivity indicated by tractography, including a probabilistic index of connectivity (Parker GJ et al., 2003), an area adjusted measure (Roberts TP et al., 2005), and ratios of streamline counts (Peters JM et al., 2011; Yeatman JD et al., 2011). We computed streamline density images by counting the number of streamlines traversing each voxel, and dividing by the total number of streamlines in the entire volume (Peters JM et al. 2011). As such, these images simultaneously quantify both the spatial extent and also the density of the three dimensional fiber bundle produced by tractography (see Figure 4). It follows that fiber bundle delineations demonstrating perfect correspondence to the reference standard will yield an RMS error equal to zero. This overlap measure is analogous to a Jaccard’s Similarity Index or Dice Coefficient, but in this application offers the added advantage of accounting for continuous intensity mismatch in addition to simply the binary overlap.
Fig. 4.

Representative probabilistic streamline density scalar images derived from six reference standard fiber bundles of interest (labeled in each panel).
We statistically evaluated the streamline density images generated by each automated MROI methodology in comparison to the reference standard streamline density images created by manual MROI placement. Voxels not associated with the white matter fiber bundle have a streamline density of 0; the location of each white matter fiber bundle is indicated by the streamline density, with the most dense regions corresponding to the most central part of the fiber bundle, and the least dense region corresponding to the voxels that may include spurious streamlines. In comparing different MROI strategies, our focus of interest was on the intermediate range of streamline densities, between the extremes of the most dense regions and the least dense regions, as these reflect the regions in which different MROI estimation approaches may have the largest effect. For each MROI automated methodology, for each subject, for each fiber bundle, we computed the number of voxels that had a density (d) in the range: 0.2 <= d/dmax < 0.5. We used Cramer’s Test, a nonparametric permutation test for univariate or multivariate two-sample problems (Baringhaus L and Franz C, 2004), to test for statistically significant differences between the reference standard and each automated methodology.
2.6.1 Comparisons across image modality used in nonrigid alignments
As a preliminary study, we observed RMS error as a function of the MR image modality that was implemented for nonrigid anatomical alignments. We tested the T1w, FA, and DT modalities and randomly chose the CC and the CST fiber bundles for this evaluation.
Using the Ss-proj method, we automatically delineated CC and CST fiber bundles in all of the study participants by implementing nonrigid alignments based on the T1w, FA, and DT, and then compared the resulting RMS errors. Having determined which of these alignment strategies yielded the lowest RMS error, we then implement that modality in the subsequent comparative evaluation of the automated methodologies.
2.6.2 Comparisons across automated methodologies
We automatically delineated the CC, SLF, TR, CST, Cg and OR fiber bundles in all of the study participants using Ss-proj, Atlas-proj, and Cns-mp then compared the mean RMS errors observed. All of the nonrigid anatomical alignments implemented in this part of our study were done based on the best performing strategy as determined by the previous preliminary study across the image modalities. Finally, having identified the best performing automated methodology, we then performed an optimization procedure in order infer the minimum number (n) of templates required for consistent bundle delineation outcomes.
2.7 Optimizing the number of templates
The optimization of the best performing automated methodology consisted of identifying the minimum n needed to achieve consistent fiber bundle outcomes, thus minimizing total computation time required by the algorithm. To do this, we plotted the mean RMS error variance as a function of the number of templates used—n was varied from n = 2, to n = 19 and was at each iteration composed of a randomly selected set of templates chosen from the pool of 19 possible templates (leave-one-out). This approach was used in order to identify plateau regions in these plots which would suggest the point at which additional templates no longer affected the RMS error variance. This optimization step was similarly performed for the CC, SLF, TR, CST, Cg, and OR fiber bundles, in each case using the identical set of n randomly chosen templates.
3. Results
3.1 Comparisons across modality used in nonrigid alignments
Using Ss-proj for the analysis, we observed the mean RMS error in CC and CST delineation as a function of the image modality used: T1w, FA, and DT. We noted an approximately two-fold reduction in the RMS error for CC delineations (mean errors: FA = 0.00063, T1w = 0.00049, DT = 0.00047) as compared to CST delineations (FA = 0.0011, T1w = 0.00091, DT = 0.00082). Importantly, for both fiber bundles tested the DT modality generally yielded lower error than either the T1w or FA modalities—with the FA modality generally yielding the highest error of the three. These results are summarized in Figure 5. Based in these trends, we used the DT modality for all subsequent nonrigid alignments in the study.
Fig. 5.
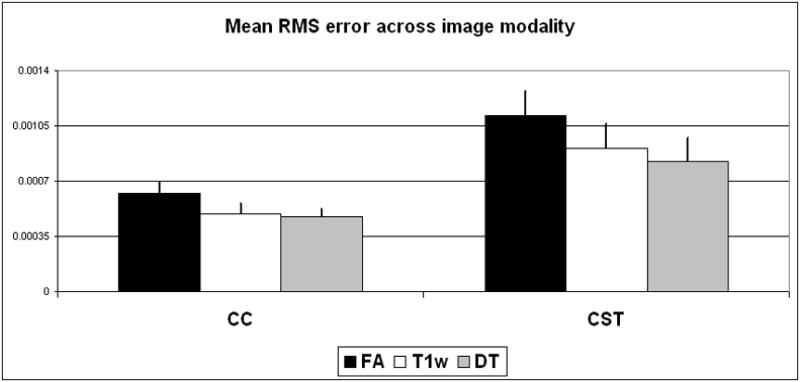
Mean RMS error in Ss-proj delineation of CC and CST fiber bundles in 20 study participants using various image modalities (FA, T1w, and DT), error bars represent the standard deviation from the mean. Note the DT modality generally demonstrated the lowest RMS errors.
3.2 Automated bundle delineation results
Of the 360 automated bundle delineations we performed in this part of the study—6 bundles in 20 subjects using 3 different automated methods—the highest RMS error we observed was for the delineation of CST in subject No. 18 using Atlas-proj, RMS error of 0.0021 (binary overlap analysis resulted in Jaccard Similarity Index of 0.37), while the lowest RMS error observed was for the delineation of CC in subject No. 14 using Cns-mp (RMS = 0.00033, Jaccard Index = 0.79). These worst and best delineation results are noteworthy as they outline the full range of outcomes observed in our study; see Figure 6 for a comparison of automated results overlaid against the reference standard.
Fig. 6.
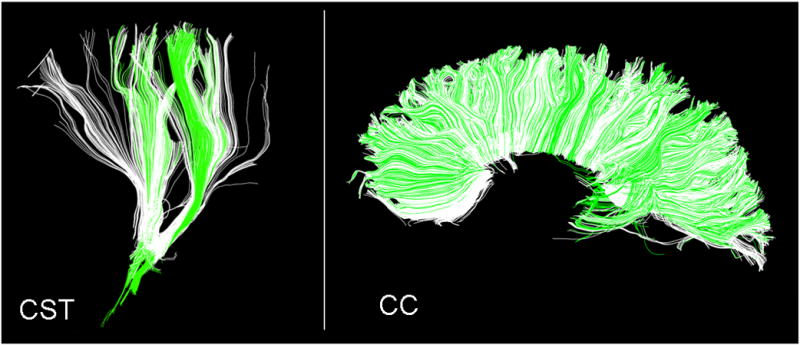
Illustration of the worst and best bundle delineation outcomes observed in our comparisons of automated methodologies. Left panel: CST delineation in subject No. 18, using Atlas-proj (RMS = 0.0021, Jaccard Similarity Index = 0.37). Right panel: CC delineation in subject No. 14 using Cns-mp (RMS error = 0.00033, Jaccard Index = 0.79). Reference standard fiber bundles from manual delineation are shown in green, the automatically generated fiber bundles are shown in white.
3.2.1 Comparisons across fiber bundles
Of the 6 fiber bundles we tested, CC generally demonstrated the most reliable results, i.e., the lowest RMS errors of any of the bundles tested. Conversely, OR and CST generally demonstrated the highest errors. These trends are illustrated in Figure 7; CC demonstrated the lowest error of any fiber bundle regardless of the automated method used, while OR and CST generally demonstrated higher errors across the various methods.
Fig. 7.

Group mean RMS error in the automatic delineation of six fiber bundles using various automated methodologies. Error bars represent the standard deviation from the mean. Notice the Cns-mp method consistently yielded lower RMS error for all fiber bundles than was observed for Ss-proj or Atlas-proj.
3.2.2 Comparisons across automated methodologies
All three automated methodologies tested were able to delineate 6 out of 6 fiber bundles of interest in 20 out of 20 participants studied. However, the bundle delineations differed depending on the automated method used. Out of the three automated methods we tested, the Cns-mp methodology consistently yielded the lowest errors for delineation of 6 out of 6 fiber bundles of interest. Conversely, the highest errors were observed for the Atlas-proj method, a trend seen in 4 of 6 fiber bundles we tested, with the exceptions that CC and OR delineation using Ss-proj demonstrated higher RMS error than Atlas-proj. Figure 7 summarizes these findings.
Univariate and multivariate Cramer’s Tests were used to compare the streamline density images from each automated methodology to the streamline density images from the manual reference standard. We carried out a multivariate Cramer’s Test to test the null hypothesis of no difference between each automated methodology and the manual reference standard for all six white matter fiber bundles (CC, TR, Cg, CST, SLF, and OR). This identified two automated strategies as statistically significantly different from the reference standard (SS_proj and Atlas_proj), and one not statistically significantly different (Cns_mp). We then carried out a univariate Cramer’s Test to test the null hypothesis of no difference between each automated methodology and the manual reference standard, independently for each white matter fiber bundle. The p-value of each of these tests is reported in Table 1. The automated strategies that are not statistically significantly different from the reference standard are highlighted in Table 1 by color coding (gray-colored).
Table 1.
P-values from multivariate and univariate Cramer’s Test for testing the null hypothesis of no difference to the reference standard; gray-colored entries highlight p-values which indicate no statistically significant differences between an automated result and the manual reference standard.
| multivariate or univariate test region | p-values for each methodology | ||
|---|---|---|---|
| SS_proj | Atlas_proj | Cns_mp | |
| CC, TR, Cg, CST, SLF, OR | < 10E-4 | < 10E-4 | 0.186 |
|
| |||
| CC | 0.001 | 0.007 | 0.192 |
| TR | 0.002 | 0.162 | 0.459 |
| Cg | 0.022 | < 10E-4 | 0.844 |
| CST | 0.757 | < 10E-4 | 0.251 |
| SLF | 0.035 | < 10E-4 | 0.089 |
| OR | 0.518 | 0.045 | 0.142 |
3.3 Optimizing the number of templates
The plots of mean RMS error variance as a function of the number of templates used with Cns-mp demonstrated a distinct plateau after a minimum of n = 4 templates were used for CC; n = 13 templates for TR, SLF and OR; and n = 17 templates for CST and Cg delineations. Figure 8 illustrates these findings.
Fig. 8.
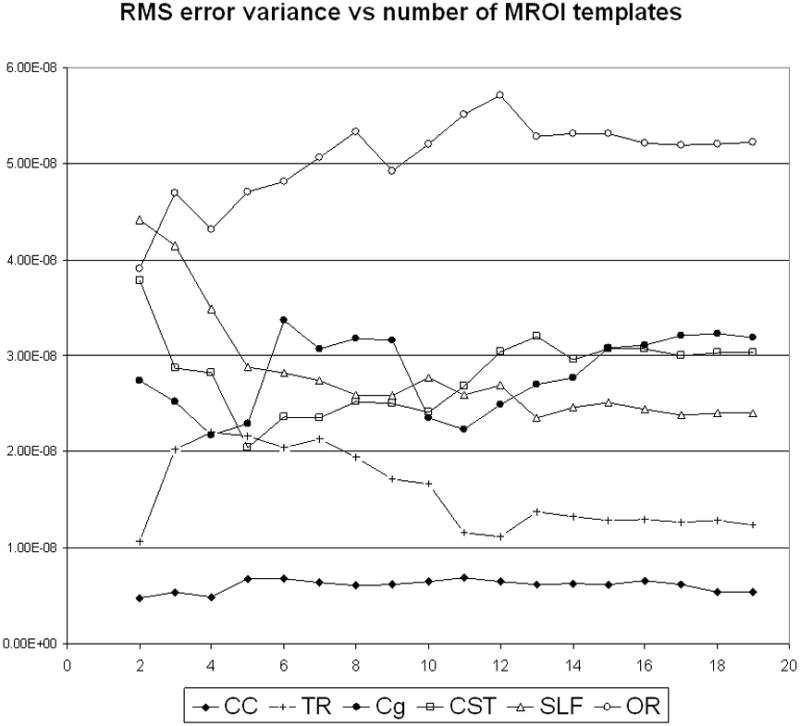
Group mean RMS error variance as a function of the number of MROI templates used by Cns-mp for the delineation of six fiber bundles of interests. Notice plateau regions in these plots.
4. Discussion and Conclusions
In this study we designed and tested three methodologies (Ss-proj, Atlas-proj, and Cn-map) for automated detection of the brain’s white matter fiber bundles—using the MROI strategy previously described by others (Catani M et al 2002; Mori S et al, 2002; Wakana S et al, 2007; Zhang W et al, 2008; Catani M et al, 2008; Zhang Y et al, 2010). We demonstrated that our proposed multiple template consensus label fusion algorithm (Cns-mp) derived from the Simultaneous Truth and Performance Level Estimation framework (Warfield SK et al, 2004) reproduced fiber bundles most consistent with manually generated reference standards. Given that an integral feature of all the automated methodologies we tested is inter-subject alignment, we conducted a preliminary study evaluating the T1-weighted, fractional anisotropy, and diffusion tensor MR modalities as the basis for these alignments. We found that implementation of the full tensors yielded superior fiber bundle delineation outcomes. We therefore outlined an algorithm for performing nonrigid alignments based on a similarity measure able to compare the whole tensor structure. An efficient, stochastic tractography algorithm based on the log-Euclidean framework was also outlined in this study, appropriate for efficient tractography analysis in this application. The goal of our study was to evaluate the feasibility of automatically reproducing reference standard fiber bundles derived from carefully hand drawn MROI in 20 healthy volunteers. The proposed automated methodologies were evaluated based on detection of 6 clinically relevant fiber bundles of the brain, denoted: CC, SLF, TR, CST, Cg, and OR.
We found that of the three image modalities tested for nonrigid anatomical alignments, the full tensor modality (DT) resulted in lower errors than the T1w or FA scalar modalities. Using the DT modality we subsequently demonstrated that our Cns-mp approach could reproduce 6 out of the 6 fiber bundles of interest, in 20 out of 20 subjects—yielding lower RMS error than was possible by the Ss-proj or Atlas-proj methodologies. Lastly, we determined that a minimum of approximately 17 MROI templates were sufficient for consistently delineating all 6 bundles of interest using the Cns-mp methodology.
An important finding of this study suggests the proposed Cns-mp method is an improvement over other commonly used approaches. We demonstrated improved results by Cns-mp over methods utilizing a single subject reference atlas (Ss-proj), which is similar to that presently implemented in the field (Zhang W et al, 2008; Oishi K et al, 2009; Zhang Y et al, 2010). We also demonstrated improved bundle delineations by Cns-mp over Atlas-proj, which is similar to commonly used methods utilizing a multiple reference atlas (Voineskos A et al, 2009; Li H et al, 2010). These findings suggest that individual variability, between a single reference atlas and a subject of interest, can account for a high degree of fiber bundle error—in agreement with similar findings by other groups which suggest that fiber bundle delineation is highly sensitive to variability in MROI placement (Catani M et al, 2008; Mori S et al, 2002; Wakana S et al, 2007; Zhang W et al, 2008; Zhang Y et al, 2010). Furthermore, we showed that reducing the individual variability in the atlas by creating an unbiased atlas derived from an average of multiple references does not afford an advantage with respect to reduction of fiber bundle errors—in the case of CST, Cg and CC this approach instead increased the resulting error (see Figure 7). This suggests that an averaged atlas lacks the fine details necessary for effective alignment to the target DT. Conversely, the proposed Cns-mp methodology is able to preserve the sharp detail of single subject references thereby maintaining robustness in the alignment. Furthermore, by computing a consensus region from numerous, independently projected templates this methodology achieves a target-specific combination of the templates without suffering the blurring effects of multiple reference atlas averaging.
Our findings in the assessment of nonrigid alignment strategies demonstrate that scalar FA images while derived directly from the diffusion tensors, yields higher fiber bundle delineation error than the full tensor modality. A similar effect was noticed for the T1w modality, which although being of relatively high spatial resolution and offering superior resolution of gray and white matter tissues, similarly resulted in higher errors than the full tensor modality (Figure 5). Given that hand drawn MROI are anchored to anatomical features visible in the color-coded FA images and that fiber tracking is carried out in the DT volume directly, it is reasonable to anticipate superior results from inter-subject alignments based on the full tensor modality. This may have been expected given previous studies by others (Park HJ et al, 2003); however, to our knowledge our study is the first to quantitatively demonstrate this effect in automated fiber bundle outcomes.
The fiber bundles of interest in this study were chosen based on common clinical applications and relevance to neurologic disorders, we expect that other fiber bundles not studied here can be similarly delineated using our proposed method. However, it must be noted that of the 6 fiber bundles of interest, the CC and TR were the most reproducible, while the CST and OR were the least (Figure 7). This may be due to increased anatomical variability in the color-coded FA landmarks used to define the MROI, which then propagated errors to the fiber bundles produced.
We emphasize that the Cns-mp automated methodology introduced here is independent of the specific fiber tracking or nonrigid tensor alignment algorithms that are utilized. Here we have implemented state-of-the-art single tensor stochastic tractography and nonrigid block-matching alignment algorithms; however, other algorithms for tractography and/or nonrigid alignment may be implemented with the Cns-mp approach. We note that the key advantage will be derived from the statistical consensus map analysis outlined here.
The main limitation of our study derives from the lack of a true validation method. Our results are based exclusively on the ability to reproduce fiber bundles derived from manually drawn MROI. It is not clear how accurate this reference standard should be considered. The goal of the study therefore was limited to reproducing manually derived fiber bundles as closely as possible, even if the accuracy of this reference standard remains under development in the field (Catani M et al 2002 and 2008; Mori S et al, 2002; Wakana S et al, 2007; Zhang W et al, 2008; Zhang Y et al, 2010). A careful quantitative evaluation of how the changes in MROI placement may impact the fiber bundle outcomes was left outside the scope of our study—this is because the primary outcome of interest was the fiber bundle delineation and not necessarily the MROI placement. An additional limitation to the results presented here derives from the use of healthy volunteers. It is not yet clear how the proposed methods will perform in patients suffering from neurobiological disorders causing large deforming structural lesions or infiltration of white matter fiber bundles. Additional study on diverse patient populations may be warranted in future work. As such, it is important that formation of template MROI be done on suitable reference populations. As the intended target population at our institution is pediatric clinical cases of both cases, we chose a population of young references of both sexes. Generally, we recommend selection of a reference population that appropriately suits the typical targets of interest.
In conclusion, we have demonstrated that the Cns-mp methodology proposed here is an effective equivalent to the more tedious and error prone procedure of manually defining MROI in every subject of interest. This method is fully automatic and therefore can produce consistent results not affected by rater error or variability. Figure 9 illustrates the fiber bundle delineation outcomes achievable by Cns-mp in a representative subject.
Fig. 9.

Automatically generated fiber bundles using Cns-mp in a representative participant. The six fiber bundles of interest are color-coded for illustrative purpose as follows: corpus callosum CC (black), superior longitudinal fasciculus SLF (blue), anterior and superior thalamic radiation TR (gray), corticospinal tract CST (green), cingulum Cg (red) and optic radiation OR (yellow).
Highlights.
The brain’s white matter fiber bundles using diffusion weighted imaging and tractography
Propose an automated methodology using a commonly applied tractography seeding strategy
Demonstrate lower error by our label map fusion method than other conventionally used methods
Test and recommend a reliable method for automated delineation of fiber bundles
Acknowledgments
This investigation was supported in part by National Institutes of Health grants R01 RR021885, R01 EB008015, R03 EB008680, R01 LM010033, and by a pilot grant from The National Multiple Sclerosis Society.
6. Appendix A
The STAPLE algorithm as implemented here takes in a set of MROI templates defined as label maps as an image matrix, labeling of each voxel in an image of I voxels can then be referred to as the decision (dij) indicating the label given by each template (j) for voxel i ∈ [1,…I]. The performance parameters, θ = {θ1,…,θj,…θJ} describe the agreement over the whole image between the templates and the estimate of the consensus. Each θj is represented by an L × L matrix, where L is the number of labels (including background), and θjs′s is the probability that template j gave the label s′ to a voxel i when the consensus MROI label is s, θ js′s = P(dij = s′| Ti = s)
Given that the consensus MROI, T, is unknown an Expectation-Maximization (EM) approach (Dempster P et al, 1977) is used to estimate T and θ by way of the maximization of the expected value of the complete data log-likelihood Q(θ|θ(k)), such that:
where Wsi denotes the posterior probability of T for label s: P(Ti = s |D, θ(k)). The EM algorithm proceeds to identify the optimal estimate of θ̂ by iterating the following steps:
E-Step: compute Q(θ|θ(k)), the expected value of the complete data log-likelihood given the estimates of the performance parameter at the preceding iteration: θ(k). Evaluating this expression requires the posterior probability of T: P(T | D, θ(k)), which is of course known
M-Step: estimate new performance parameters at iteration k+1, θ(k+1), by maximizing Q(θ |θ(k))
This approach therefore establishes the underlying target-specific MROI which most closely estimates manually drawn MROI, without the need for user interaction.
Footnotes
Publisher's Disclaimer: This is a PDF file of an unedited manuscript that has been accepted for publication. As a service to our customers we are providing this early version of the manuscript. The manuscript will undergo copyediting, typesetting, and review of the resulting proof before it is published in its final citable form. Please note that during the production process errors may be discovered which could affect the content, and all legal disclaimers that apply to the journal pertain.
References
- Arsigny V, Fillard P, Pennec X, Ayache N. Log-Euclidean metrics for fast and simple calculus on diffusion tensors. Magn Reson Med. 2006 Aug;56(2):411–21. doi: 10.1002/mrm.20965. [DOI] [PubMed] [Google Scholar]
- Baringhaus L, Franz C. On a new multivariate two-sample test. Journal of Multivariate Analysis. 2004;88:190–206. [Google Scholar]
- Basser PJ, Mattiello J, LeBihan D. Estimation of the effective self-diffusion tensor from the NMR spin echo. J Magn Reson B. 1994 Mar;103(3):247–54. doi: 10.1006/jmrb.1994.1037. [DOI] [PubMed] [Google Scholar]
- Basser PJ, Pajevic S, Pierpaoli C, Duda J, Aldroubi A. In vivo fiber tractography using DT-MRI data. Magn Reson Med. 2000 Oct;44(4):625–32. doi: 10.1002/1522-2594(200010)44:4<625::aid-mrm17>3.0.co;2-o. [DOI] [PubMed] [Google Scholar]
- Catani M, Howard RJ, Pajevic S, Jones DK. Virtual in vivo interactive dissection of white matter fasciculi in the human brain. Neuroimage. 2002 Sep;17(1):77–94. doi: 10.1006/nimg.2002.1136. [DOI] [PubMed] [Google Scholar]
- Catani M, Mesulam M. The arcuate fasciculus and the disconnection theme in language and aphasia: history and current state. Cortex. 2008 Sep;44(8):953–61. doi: 10.1016/j.cortex.2008.04.002. [DOI] [PMC free article] [PubMed] [Google Scholar]
- Catani M, Thiebaut de Schotten M. A diffusion tensor imaging tractography atlas for virtual in vivo dissections. Cortex. 2008 Sep;44(8):1105–32. doi: 10.1016/j.cortex.2008.05.004. [DOI] [PubMed] [Google Scholar]
- Commowick O, Arsigny V, Costa J, Ayache N, Malandain G. An Efficient Locally Affine Framework for the Registration of Anatomical Structures. Proceedings of the Third IEEE International Symposium on Biomedical Imaging (ISBI 2006); April 2006.pp. 478–481. [Google Scholar]
- Conturo TE, Lori NF, Cull TS, Akbudak E, Snyder AZ, Shimony JS, McKinstry RC, Burton H, Raichle ME. Tracking neuronal fiber pathways in the living human brain. Proc Natl Acad Sci U S A. 1999 Aug 31;96(18):10422–7. doi: 10.1073/pnas.96.18.10422. [DOI] [PMC free article] [PubMed] [Google Scholar]
- Cramer EM, Nicewander W. Some symmetric invariant measures of multi- variate association. Psychometrika. 1979;44:43–54. [Google Scholar]
- Dempster AP, Laird NM, Rubin DB. Maximum likelihood from incomplete data via the EM algorithm. Journal of the Royal Statistical Society, Series B. 1977 [Google Scholar]
- Douek P, Turner R, Pekar J, Patronas N, Le Bihan D. MR color mapping of myelin fiber orientation. J Comput Assist Tomogr. 1991 Nov Dec;15(6):923–9. doi: 10.1097/00004728-199111000-00003. [DOI] [PubMed] [Google Scholar]
- Eckstein I, Shattuck DW, Stein JL, McMahon KL, de Zubicaray G, Wright MJ, Thompson PM, Toga AW. Active fibers: matching deformable tract templates to diffusion tensor images. Neuroimage. 2009 Aug;47( Suppl 2):T82–9. doi: 10.1016/j.neuroimage.2009.01.065. [DOI] [PMC free article] [PubMed] [Google Scholar]
- Garcia V, Commowick O, Malandain G. A robust and efficient block-matching framework for non-linear registration of thoracic images. Proceedings of A Grand Challenge on Pulmonary Image Registration (EMPIRE 2010), held in conjunction with MICCAI; 2010. [Google Scholar]
- Goldberg-Zimring D, Mewes AU, Maddah M, Warfield SK. Diffusion tensor magnetic resonance imaging in multiple sclerosis. J Neuroimaging. 2005;15(4 Suppl):68S–81S. doi: 10.1177/1051228405283363. [DOI] [PubMed] [Google Scholar]
- Grau V, Mewes AU, Alcaniz M, Kikinis R, Warfield SK. Improved watershed transform for medical image segmentation using prior information. IEEE transactions on medical imaging. 2004;23:447–458. doi: 10.1109/TMI.2004.824224. [DOI] [PubMed] [Google Scholar]
- Guimond A, Meunier J, Thirion JP. Average Brain Models: A Convergence Study. Computer Vision and Image Understanding. 2000 February;77(2):192–210. [Google Scholar]
- Hua K, Zhang J, Wakana S, Jiang H, Li X, Reich DS, Calabresi PA, Pekar JJ, van Zijl PC, Mori S. Tract probability maps in stereotaxic spaces: analyses of white matter anatomy and tract-specific quantification. Neuroimage. 2008 Jan 1;39(1):336–47. doi: 10.1016/j.neuroimage.2007.07.053. [DOI] [PMC free article] [PubMed] [Google Scholar]
- Jonasson L, Bresson X, Hagmann P, Cuisenaire O, Meuli R, Thiran JP. White matter fiber tract segmentation in DT-MRI using geometric flows. Med Image Anal. 2005 Jun;9(3):223–36. doi: 10.1016/j.media.2004.07.004. [DOI] [PubMed] [Google Scholar]
- Landman BA, Wan H, Bogovic JA, Bazin PL, Prince JL. Resolution of Crossing Fibers with Constrained Compressed Sensing using Traditional Diffusion Tensor MRI. Proc Soc Photo Opt Instrum Eng. 2010;7623:76231H. doi: 10.1117/12.844171. [DOI] [PMC free article] [PubMed] [Google Scholar]
- Lazar M, Weinstein DM, Tsuruda JS, Hasan KM, Arfanakis K, Meyerand ME, Badie B, Rowley HA, Haughton V, Field A, Alexander AL. White matter tractography using diffusion tensor deflection. Hum Brain Mapp. 2003 Apr;18(4):306–21. doi: 10.1002/hbm.10102. [DOI] [PMC free article] [PubMed] [Google Scholar]
- Le Bihan D, Poupon C, Amadon A, Lethimonnier F. Artifacts and pitfalls in diffusion MRI. J Magn Reson Imaging. 2006 Sep;24(3):478–88. doi: 10.1002/jmri.20683. Review. [DOI] [PubMed] [Google Scholar]
- Li H, Xue Z, Guo L, Liu T, Hunter J, Wong ST. A hybrid approach to automatic clustering of white matter fibers. Neuroimage. 2010 Jan 15;49(2):1249–58. doi: 10.1016/j.neuroimage.2009.08.017. [DOI] [PubMed] [Google Scholar]
- Maddah M, Zöllei L, Grimson WE, Westin CF, Wells WM. A Mathematical Framework for Incorporating Anatomical Knowledge in DT-MRI Analysis. Proc IEEE Int Symp Biomed Imaging. 2008:4543943–108. doi: 10.1109/ISBI.2008.4540943. [DOI] [PMC free article] [PubMed] [Google Scholar]
- Mori S, Kaufmann WE, Davatzikos C, Stieltjes B, Amodei L, Fredericksen K, Pearlson GD, Melhem ER, Solaiyappan M, Raymond GV, Moser HW, van Zijl PC. Imagingcortical association tracts in the human brain using diffusion-tensor-based axonal tracking. Magn Reson Med. 2002 Feb;47(2):215–23. doi: 10.1002/mrm.10074. [DOI] [PubMed] [Google Scholar]
- Nazem-Zadeh MR, Davoodi-Bojd E, Soltanian-Zadeh H. Atlas-based fiber bundle segmentation using principal diffusion directions and spherical harmonic coefficients. Neuroimage. 2011 Jan;54( Suppl 1):S146–64. doi: 10.1016/j.neuroimage.2010.09.035. [DOI] [PubMed] [Google Scholar]
- Niethammer M, Bouix S, Westin CF, Shenton ME. Fiber bundle estimation and parameterization. Med Image Comput Comput Assist Interv. 2006;9(Pt 2):252–9. doi: 10.1007/11866763_31. [DOI] [PMC free article] [PubMed] [Google Scholar]
- O’Donnell LJ, Kubicki M, Shenton ME, Dreusicke MH, Grimson WE, Westin CF. A method for clustering white matter fiber tracts. AJNR Am J Neuroradiol. 2006 May;27(5):1032–6. [PMC free article] [PubMed] [Google Scholar]
- O’Donnell LJ, Westin CF. Automatic tractography segmentation using a high-dimensional white matter atlas. IEEE Trans Med Imaging. 2007 Nov;26(11):1562–75. doi: 10.1109/TMI.2007.906785. [DOI] [PubMed] [Google Scholar]
- Oishi K, Faria A, Jiang H, Li X, Akhter K, Zhang J, Hsu JT, Miller MI, van Zijl PC, Albert M, Lyketsos CG, Woods R, Toga AW, Pike GB, Rosa-Neto P, Evans A, Mazziotta J, Mori S. Atlas-based whole brain white matter analysis using large deformation diffeomorphic metric mapping: application to normal elderly and Alzheimer’s disease participants. Neuroimage. 2009 Jun;46(2):486–99. doi: 10.1016/j.neuroimage.2009.01.002. [DOI] [PMC free article] [PubMed] [Google Scholar]
- Ourselin S, Roche A, Prima S, Ayache N. Block Matching: A General Framework to Improve Robustness of Rigid Registration of Medical Images. Third International Conference on Medical Robotics, Imaging And Computer Assisted Surgery (MICCAI 2000), volume 1935 of Lectures Notes in Computer Science; Pittsburgh, Penn, USA. octobre 11–14 2000; Springer; pp. 557–566. [Google Scholar]
- Ourselin S, Stefanescu Radu, Pennec Xavier. Robust registration of multi-modal images: towards real-time clinical applications. Medical Image Computing and Computer-Assisted Intervention (MICCAI’02), volume 2489 of LNCS; Tokyo. September 2002; Springer; pp. 140–147. [Google Scholar]
- Qiu TM, Zhang Y, Wu JS, Tang WJ, Zhao Y, Pan ZG, Mao Y, Zhou LF. Virtual reality presurgical planning for cerebral gliomas adjacent to motor pathways in an integrated 3-D stereoscopic visualization of structural MRI and DTI tractography. Acta Neurochir (Wien) 2010 Nov;152(11):1847–57. doi: 10.1007/s00701-010-0739-x. [DOI] [PubMed] [Google Scholar]
- Park HJ, Kubicki M, Shenton ME, Guimond A, McCarley RW, Maier SE, Kikinis R, Jolesz FA, Westin CF. Spatial normalization of diffusion tensor MRI using multiple channels. Neuroimage. 2003 Dec;20(4):1995–2009. doi: 10.1016/j.neuroimage.2003.08.008. [DOI] [PMC free article] [PubMed] [Google Scholar]
- Parker GJ, Alexander DC. Probabilistic Monte Carlo based mapping of cerebral connections utilising whole-brain crossing fibre information. Inf Process Med Imaging. 2003 doi: 10.1007/978-3-540-45087-0_57. [DOI] [PubMed] [Google Scholar]
- Pagani E, Filippi M, Rocca MA, Horsfield MA. A method for obtaining tract-specific diffusion tensor MRI measurements in the presence of disease: application to patients with clinically isolated syndromes suggestive of multiple sclerosis. Neuroimage. 2005 May 15;26(1):258–65. doi: 10.1016/j.neuroimage.2005.01.008. [DOI] [PubMed] [Google Scholar]
- Peters JM, Sahin M, Vogel-Farley VK, Jeste SS, Nelson CA, Gregas MC, Prabhu SP, Scherrer B, Warfield SK. Loss of White Matter Microstructural Integrity Is Associated with Adverse Neurological Outcome in Tuberous Sclerosis Complex. Academic Radiology. 2011 doi: 10.1016/j.acra.2011.08.016. (in press) [DOI] [PMC free article] [PubMed] [Google Scholar]
- Reese TG, Heid O, Weisskoff RM, Wedeen VJ. Reduction of eddy-current-induced distortion in diffusion MRI using a twice-refocused spin echo. Magn Reson Med. 2003 Jan;49(1):177–82. doi: 10.1002/mrm.10308. [DOI] [PubMed] [Google Scholar]
- Reich DS, Smith SA, Jones CK, Zackowski KM, van Zijl PC, Calabresi PA, Mori S. Quantitative characterization of the corticospinal tract at 3T. AJNR Am J Neuroradiol. 2006 Nov–Dec;27(10):2168–78. [PMC free article] [PubMed] [Google Scholar]
- Roberts TP, Liu F, Kassner A, Mori S, Guha A. Fiber density index correlates with reduced fractional anisotropy in white matter of patients with glioblastoma. AJNR Am J Neuroradiol. 2005 Oct;26(9):2183–6. [PMC free article] [PubMed] [Google Scholar]
- Ruiz-Alzola J, Westin CF, Warfield SK, Alberola C, Maier S, Kikinis R. Nonrigid registration of 3D tensor medical data. Med Image Anal. 2002 Jun;6(2):143–61. doi: 10.1016/s1361-8415(02)00055-5. [DOI] [PubMed] [Google Scholar]
- Sage CA, Peeters RR, Görner A, Robberecht W, Sunaert S. Quantitative diffusion tensor imaging in amyotrophic lateral sclerosis. Neuroimage. 2007 Jan 15;34(2):486–99. doi: 10.1016/j.neuroimage.2006.09.025. [DOI] [PubMed] [Google Scholar]
- Spena G, Nava A, Cassini F, Pepoli A, Bruno M, D’Agata F, Cauda F, Sacco K, Duca S, Barletta L, Versari P. Preoperative and intraoperative brain mapping for the resection of eloquent-area tumors. A prospective analysis of methodology, correlation, and usefulness based on clinical outcomes. Acta Neurochir (Wien) 2010 Nov;152(11):1835–46. doi: 10.1007/s00701-010-0764-9. [DOI] [PubMed] [Google Scholar]
- Tuch DS, Reese TG, Wiegell MR, Makris N, Belliveau JW, Wedeen VJ. High angular resolution diffusion imaging reveals intravoxel white matter fiber heterogeneity. Magn Reson Med. 2002 Oct;48(4):577–82. doi: 10.1002/mrm.10268. [DOI] [PubMed] [Google Scholar]
- Tuch DS. Q-ball imaging. Magn Reson Med. 2004 Dec;52(6):1358–72. doi: 10.1002/mrm.20279. [DOI] [PubMed] [Google Scholar]
- Van Hecke W, Leemans A, Sijbers J, Vandervliet E, Van Goethem J, Parizel PM. A tracking-based diffusion tensor imaging segmentation method for the detection of diffusion-related changes of the cervical spinal cord with aging. J Magn Reson Imaging. 2008 May;27(5):978–91. doi: 10.1002/jmri.21338. [DOI] [PubMed] [Google Scholar]
- Voineskos AN, O’Donnell LJ, Lobaugh NJ, Markant D, Ameis SH, Niethammer M, Mulsant BH, Pollock BG, Kennedy JL, Westin CF, Shenton ME. Quantitative examination of a novel clustering method using magnetic resonance diffusion tensor tractography. Neuroimage. 2009 Apr 1;45(2):370–6. doi: 10.1016/j.neuroimage.2008.12.028. [DOI] [PMC free article] [PubMed] [Google Scholar]
- Warfield SK, Zou KH, Wells WM. Simultaneous truth and performance level estimation (STAPLE): an algorithm for the validation of image segmentation. IEEE Trans Med Imaging. 2004 Jul;23(7):903–21. doi: 10.1109/TMI.2004.828354. [DOI] [PMC free article] [PubMed] [Google Scholar]
- Wakana S, Caprihan A, Panzenboeck MM, Fallon JH, Perry M, Gollub RL, Hua K, Zhang J, Jiang H, Dubey P, Blitz A, van Zijl P, Mori S. Reproducibility of quantitative tractography methods applied to cerebral white matter. Neuroimage. 2007 Jul 1;36(3):630–44. doi: 10.1016/j.neuroimage.2007.02.049. [DOI] [PMC free article] [PubMed] [Google Scholar]
- Weisenfeld NI, Warfield SK. Automatic segmentation of newborn brain MRI. Neuroimage. 2009 Aug 15;47(2):564–72. doi: 10.1016/j.neuroimage.2009.04.068. [DOI] [PMC free article] [PubMed] [Google Scholar]
- Westin CF, Maier SE, Mamata H, Nabavi A, Jolesz FA, Kikinis R. Processing and visualization for diffusion tensor MRI. Med Image Anal. 2002 Jun;6(2):93–108. doi: 10.1016/s1361-8415(02)00053-1. Review. [DOI] [PubMed] [Google Scholar]
- Yeatman JD, Dougherty RF, Rykhlevskaia E, Sherbondy AJ, Deutsch GK, Wandell BA, Ben-Shachar M. Anatomical properties of the arcuate fasciculus predict phonological and reading skills in children. J Cogn Neurosci. 2011 Nov;23(11):3304–17. doi: 10.1162/jocn_a_00061. [DOI] [PMC free article] [PubMed] [Google Scholar]
- Yogarajah M, Focke NK, Bonelli S, Cercignani M, Acheson J, Parker GJ, Alexander DC, McEvoy AW, Symms MR, Koepp MJ, Duncan JS. Defining Meyer’s loop-temporal lobe resections, visual field deficits and diffusion tensor tractography. Brain. 2009 Jun;132(Pt 6):1656–68. doi: 10.1093/brain/awp114. [DOI] [PMC free article] [PubMed] [Google Scholar]
- Zhang W, Olivi A, Hertig SJ, van Zijl P, Mori S. Automated fiber tracking of human brain white matter using diffusion tensor imaging. Neuroimage. 2008 Aug 15;42(2):771–7. doi: 10.1016/j.neuroimage.2008.04.241. [DOI] [PMC free article] [PubMed] [Google Scholar]
- Zhang Y, Zhang J, Oishi K, Faria AV, Jiang H, Li X, Akhter K, Rosa-Neto P, Pike GB, Evans A, Toga AW, Woods R, Mazziotta JC, Miller MI, van Zijl PC, Mori S. Atlas-guided tract reconstruction for automated and comprehensive examination of the white matter anatomy. Neuroimage. 2010 Oct 1;52(4):1289–301. doi: 10.1016/j.neuroimage.2010.05.049. [DOI] [PMC free article] [PubMed] [Google Scholar]
- Zöllei L, Stevens A, Huber K, Kakunoori S, Fischl B. Improved tractography alignment using combined volumetric and surface registration. Neuroimage. 2010 May 15;51(1):206–13. doi: 10.1016/j.neuroimage.2010.01.101. [DOI] [PMC free article] [PubMed] [Google Scholar]