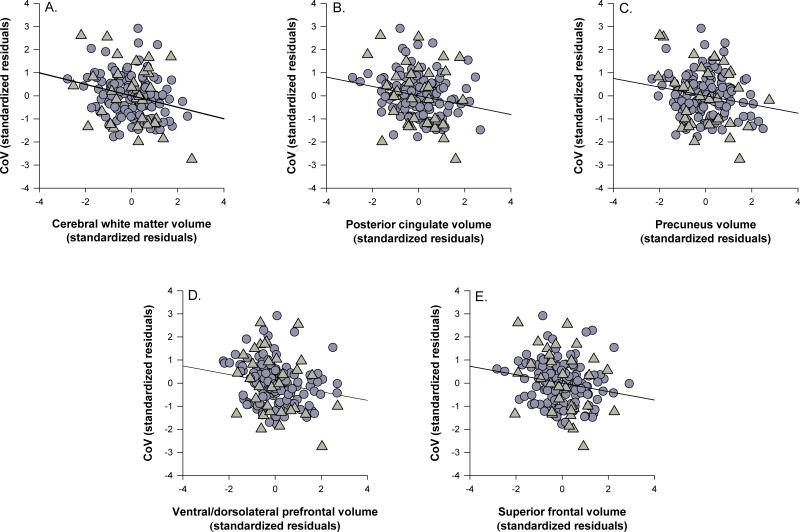
Figure 1.
Associations between global and regional volumes and the coefficient of variation. A) cerebral white matter, B) posterior cingulate, C) precuneus, D) ventral/dorsolateral prefrontal, E) superior frontal gyrus. Triangles indicate participants with early-stage Alzheimer's and circles indicate healthy older adults. Data are standardized residuals controlling for age, education, gender, scanner type, cardiovascular health, depression, CDR status, and interval between date of scan and date of cognitive assessment.

