

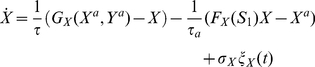
Abstract
Despite being governed by the principles of nonequilibrium transitions, gene expression dynamics underlying cell fate decision is poorly understood. In particular, the effect of signaling speed on cellular decision making is still unclear. Here we show that the decision between alternative cell fates, in a structurally symmetric circuit, can be biased depending on the speed at which the system is forced to go through the decision point. The circuit consists of two mutually inhibiting and self-activating genes, forced by two external signals with identical stationary values but different transient times. Under these conditions, slow passage through the decision point leads to a consistently biased decision due to the transient signaling asymmetry, whereas fast passage reduces and eventually eliminates the switch imbalance. The effect is robust to noise and shows that dynamic bifurcations, well known in nonequilibrium physics, are important for the control of genetic circuits.
Introduction
Cellular decision making is an inherently nonlinear process requiring multistability, a common feature in nonequilibrium physical systems. This process is driven by gene and protein circuits, which are fundamental for the regulation of many cellular processes, including cell differentiation [1], maintenance of pluripotency [2], developmental pattern formation [3], [4], apoptosis [5], and cell dedifferentiation leading to cancer [6]. In cellular decision making, the cell is forced to decide between alternative fates depending on extracellular conditions. A common circuit that sustains decision making is one in which the two master regulators of the two competing fates inhibit each other, while self-activating themselves in order to increase the stability of the decision outcome (Fig. 1A) [7]. When the interactions are sufficiently symmetric with respect to the two master regulators, this circuit exhibits bistability which is associated with two distinct cell fates and is the focus of our work. In fact, in order for the cell to be able to flexibly choose either of the two fates depending on the conditions, mutually inhibitory cellular decision circuits do need to be as structurally symmetric as possible. Therefore, knowledge of the intracellular circuit structure is insufficient to explain the outcome of phenotype selection. In this situation, external signals may provide the bias necessary for the bistable circuit to fall into one attractor or the other. However, it seems unlikely that the signals will be maintained asymmetric in the long term. Thus the question still remains, as to how does a consistent bias emerge from a symmetric bistable switch subject to signals that are symmetric in the steady state. Here we show that differences in the speed at which the input signals reach their (common) steady state are enough to provide a transient asymmetry that will bias the bistable switch in a consistent manner. In our model, this speed-dependent cellular decision making (SdCDM) arises from the inclusion of time-dependent bifurcation parameters, similarly to dynamic bifurcations in applied mathematics [8] and ramped nonequilibrium phase transitions in statistical physics [9]. Since external signals are clearly time-dependent and unlikely to emerge at the same rate in different pathways, we can expect SdCDM to play an important role in many cellular decision-making processes.
Figure 1. Paradigmatic integrated signaling–transcriptional circuit switch.

(A) Schematic representation: Nodes represent proteins, regulated by protein kinases with concentrations  and
and  , where
  and
and  stand for transcription factors that can be phosporylated to generate
  and
and  . Black lines represent transcriptional interactions, while grey lines stand for protein-protein interactions. (B) Time evolution of the input signals
  (black) and
  (grey), with
  . In this work
  is considered to have a rising time
  smaller than
  . (C) Amplitude of the transient asymmetry between signals
 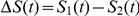 . Here the maximal asymmetry is
  (see also Table 1 and Methods).
Results
External signals induce symmetry breaking and transition to bistability
As mentioned above, we study a paradigmatic decision circuit consisting of two mutually repressive proteins under the action of two signals  and
and  (Fig. 1A), and equate attractor selection with cell fate decision. The proteins,
  and
and  , represent transcription factors (TFs) that, when phosphorylated (
 ,
,  ) and subsequently dimerized (
 ,
,  ), activate their own expression and repress that of the other TF. Many pairs of transcription factors have been shown to act according to this mechanism, including GATA1 and PU.1 in haematopoietic cell differentiation [1], Cdx2 and Oct3/4 in embryonic stem cell differentiation [10], and Pax2 and Pax4 in visual cell specification [11], and it is current practice to construct the models accordingly [7] (see Methods section).
With the intent of determining the number of attractors existing for a certain combination of input signals, we performed bifurcation analysis of the circuit using the software XPPAUT [12]. In order to focus on the asymmetry provided by the external signals, the values of all parameters associated with transcription or translation processes are assumed symmetric (see Eqs. (1) to (4) and Table 1 in Methods section). Bifurcation analysis shows that in the parameter space  (Fig. 2A) the system can be either monostable (regimes
  and
and  ) or bistable (regime
  ). The action of the two external signals takes the system from a state where the cell is undecided (point
  ) to a situation of bistability (
 ), where the system ends up in one of two possible states, which defines the result of cellular decision making. If the two signals
  and
and  are identical and evolve in time at equal rates, the cell undergoes a transition to bistability through the straight path
  . Everywhere along this path there is complete symmetry, and consequently the cell will choose its fate stochastically between the two equally possible stable states.
Table 1. Parameters in the decision genetic switch with external stimulation model.
| Parameter | Interpretation | Value |

|
External signal 1 |
 , ,  and and  , , 
|

|
External signal 2 |
 , ,  and and  , , 
|

|
Maximum amplitude of 
|

|

|
Rising times of 
|
– |

|
Maximum asymmetry between  and and 
|

|

|
Basal transcription rate multiplied by translation rate divided by  and protein degradation rates and protein degradation rates |

|

|
Ratio between binding and unbinding affinities of dimers to promoter regions for self-activation and cross-inhibition, respectively |

|

|
Ratio between rate of expression of the respective gene when homodimers are bound and basal transcription |

|

|
Combined dimensionless time scale for transcription and translation of proteins |
 and and 
|

|
Dimensionless time scale for phosphorylation processes |

|

|
Intensity of Gaussian noise  with zero mean and with zero mean and 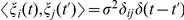
|
 and and 
|
Figure 2. Parameter analysis of the decision switch with external stimulation.

(A) Phase diagram for  in the space (
 ). Thin lines represent borders between different regimes:
  stands for monostability, with
  having a low or a high value, respectively.
  denotes bistability between two states at which
  and
and  have opposite concentrations, (high, low) or (low, high).
  ,
,  and
and  correspond to the initial (
 ), intermediary (
 ), and final (
 ) points of the signaling (see Fig. 1B). (B) Bifurcation diagram for protein concentration
  vs parameterization of path
  , for several values of the maximal asymmetry
  (see Fig. 1C).
  stands for the distance between the origin and a point along the path
  . Parameters are
 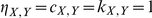 and
and  (see also Table 1 and Eq. (1) to (4) in Methods).
The situation changes qualitatively if we consider that the two external signals grow at different rates, which is a more realistic situation. In this case the cellular decision path is  , along which the steady states follow an asymmetric bifurcation diagram, as shown in Fig. 1B. At the final decision point (
 ,
,  ) one of the branches (depending on which signal is the fastest, here the top branch) is the preferred one. Although the asymmetry generated when the system follows
  is transient (see Fig. 1C), the memory of the bias induced in the vicinity of the critical region is retained even if the circuit's structure, the initial conditions and the end stationary signaling state are completely symmetric.
Cell fate decision depends on the speed of passage through the critical region in the presence of fluctuations
The behavior described above is robust to noise. Figure 3A shows a typical time series of the circuit, when the signals increase linearly as described in Fig. 1B. We used a Heun method [13], [14] for integrating the differential Eqs. (1) to (4). The distribution of  values for 1000 different realizations of the dynamics is shown in Fig. 3B for two time points. Initially the distribution is unimodal and starts to broaden until the saddle-node bifurcation (Fig. 2B) is reached. At that point a bimodal distribution emerges, which is strongly asymmetrical due to the transient signaling asymmetry, with the upper branch being much more populated than the lower one.
Figure 3. Asymmetric decision under fluctuations.

(A) Typical time series of  and
and  for two input signals that grow at different speeds. (B) Initial and final distribution functions of
  values for 1000 cells. (C) Dependence of the fraction
  of cells that end up in the high branch, on the speed of the transition (measured by
  ) for different values of the maximum asymmetry
  (see Fig. 1C). For all curves in (A), (B) and (C) with exception of plot
  (ii), (iii) and (iv), the underlying equations are Eqs. (1) to (4) with
  . Also shown in (C) for
  are the ratios
  for an extended version of the system of Eqs. (1) to (4) with noisy
  dynamics (dashed dark blue line, no symbols (iv)) and without noise (solid light blue line, no symbols (iii)) (see also Eqs. (6) to (9) in Methods). We also tested the effects of fluctuations in phosphorylation reactions, i.e.
  (see (C), dashed light blue line, no symbols
  (ii)) for the extended system of equations (Eqs. (6) to (9)) with noisy
  dynamics. Parameters for (A), (B) and (C)
  (i) are those of Fig. 1 and
  for all curves (see also Table 1 and Methods). Parameters for (C)
  (ii), (iii) and (iv) are
 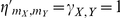 and
and 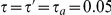 (see also Eqs. (6) to (9)). For all curves
  and where fluctuations are considered
  .
.
We now study the effect of the signaling speed on the decision. To that end, we vary the value of  and
and  according to
 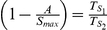 , while keeping the parameters
  and
and  constant (see Fig. 1C and the respective caption and Table 1). In that way, we change the speed of the transition but keep constant the decision path
  in the parameter space
  . The result is plotted in Fig. 3C, in terms of the fraction
  of realizations ending in the upper state (
 , see Fig. 2B). The plot evidences the existence of SdCDM, since for slow signaling speed
  the decision is asymmetric, while the decision becomes unbiased when the signaling speed becomes large enough, with the ratio
  tending to 0.5. It can also be observed that higher values of maximum asymmetry
  between
  and
and  induce a stronger bias in the decision, i.e. higher
  ratios (Fig. 3C).
For comparison purposes we also show in Fig. 3C the ratio  calculated when, in addition to the processes represented in Eqs. (1) to (4),
  dynamics are considered, both in the absence (solid light blue line, no symbols,
  (iii)), and in the presence (dashed dark blue line, no symbols,
  (iv)) of fluctuations (in the latter case, noise is introduced following the same rationale of Eq. (11)). In these simulations, the
  dynamics was assumed to be dependent on transcription initiation (see Eq. (10)) following a function similar to
  in Eq. (5), and the protein dynamics was considered to depend linearly on
  concentration (see Eqs. (6) to (9)). Both species are subject to linear degradation terms [7], [15], and have equal time scales (
 ). We observe that SdCDM persists in the presence of
  dynamics, although a shift towards smaller
  ratios appears when compared with the original case in which only protein dynamics was considered (Fig. 3C, solid dark blue line, diamond symbols
  (i)). Overall, the extra steps degrade, but only slightly, the probability of reaching the upper branch due to a delay emerging from the
  dynamics. We also tested for the extended system (Eqs. (1) and (2) and (6) to (9)) the effects of fluctuations in the phosphorylation reactions (Fig. 3C, dashed light blue line
  (ii)). Again, during the simulations the noise term was calculated through an expression that follows the rationale of Eq. (1). The extrinsic noise source present when fluctuations are included in phosphorylation reactions degrades additionally the ratios
  , but still elicits SdCDM. Further investigations are necessary to clarify the effect of extrinsic noise [16] on SdCDM and to establish the limits of sensitivity of SdCDM to intermediate steps (see for example [17], [18]).
So far we have considered that the time scales of phosphorylation and production of transcription factors were equal. Yet, extracellular signals usually change the activity state of transcription factors in a sub-second scale, while transcription and translation of target genes may take minutes, and accumulation of protein products minutes to hours, with the additional delay being due to macromolecular transport [19]. To understand the effect of different time scale ratios  and noise on the decision bias, we performed extensive numerical simulations of Eqs. (1) to (4) on a
  grid of combinations of maximum asymmetry
  and signaling speed
  , with
  at a constant value (see Methods section and Table 1). For simplicity we focused only on the case where no fluctuations in phosphorylation reactions are present, and the
  dynamics were assumed again to be in a quasi-steady state. The results are shown in Fig. 4, and clearly reveal that as the difference in the phosphorylation and expression/translation time scales increases, and also as the noise intensity
  grows, the ability of the decision circuit to choose consistently a cell fate depending on the signaling speed decays.
Figure 4. Effect of time scale differences and noise on SdCDM.

The decision bias, measured by the fraction  of cells that end up in the high branch, is plotted in color scale versus the transient asymmetry parameter
  and the signaling speed (controlled by
  ), for several noise and time scale ratios. (A)
  and
and  . (B)
. (B)  and
and  . (C)
. (C)  and
and  . (D)
. (D)  and
and  . Blue denotes a symmetric decision, and red an asymmetric decision, which appears for slow enough speeds if the transient asymmetry is non-zero. Parameters are those of Fig. 1, plus
  (see also Table 1 and Methods). The underlying equations are Eqs. (1) to (4) with
  .
.
Discussion
The mechanism of SdCDM can be understood from previous studies in dynamic bifurcations and parameter sweeping experiments in physical systems [8], [9]. As in the case of the generic bistable potential [9], [20], the speed at which the system crosses the critical region strongly influences the sensitivity to the transient asymmetry (see Fig. 4). Although the signaling is symmetric in the steady state, during the signal build-up the circuit is momentarily exposed to asymmetric signals. With high speed the system is able to ignore this transient asymmetry, but slow enough sweeping speeds increase the probability of reaching one of the steady states over the other one, because they induce a smaller bifurcation delay [21]–[23]. Bifurcation delays arise when the system takes a long time to leave the neighborhood of the unstable state. In the case of large bifurcation delays the probability that the system jumps across the potential barrier is increased, and consequently the circuit capacity to discriminate signals  and
and  is reduced. On the other hand, higher maximum asymmetries between
  and
and  reduce the bifurcation delays and also the amplification of fluctuations [9], [22]. Similarly to [9], the probability of biasing the distribution depends on the maximum amplitude of the asymmetry to noise ratio, on the one side, and inversely on the sweeping speed and time scale ratio, on the other. This can be seen when comparing for instance Figs. 4A and 4C; it is clear that the loss of bias in the final distributions caused by an increase in the time scale ratio can be compensated by decreasing also the sweeping speed controlled by
  . Graphically, this means that cross sections of
  versus
  (for constant
  ) in Fig. 4A are similar to those observed in Fig. 4C when shifted to the left by approximately
  .
.
Certain cell differentiation processes are driven by slow build-up of decision-driving signals [24]. A mechanism of temporal control of differentiation has also been proposed [25], and experiments have revealed that temporal competition can determine cell fate choice in multipotent differentiation [26]. Here we have shown that the speed of signaling in genetic switches dramatically changes the result of cellular decision, an effect that we have termed speed-dependent cellular decision making (SdCDM). In contrast to other aspects of nonequilibrium physics [27]–[29], dynamic bifurcations have not been systematically studied in systems biology despite involving fundamental aspects of cell fate decision. It is of special interest in this context because all genetic switches are asymmetric and stochastic and, hence, can be expected to demonstrate SdCDM. Our study extends the well-known delayed bifurcation effect in physics to a wide class of equations used to model gene expression. This will be of importance for understanding the dynamics of genome-wide networks and meets the recent interest and relevance of delayed dynamics in fields such as developmental biology [30]. In contrast to previous studies, in our work asymmetry in signaling/genetic network models is transient and non-additive. It is an open question which additional dynamics can appear due to the interplay between speed of asymmetry emergence and speed of decision making. It would also be interesting to understand, through analytical techniques, the importance of reaching the maximum asymmetry  (see Fig. 1C) before or after the bifurcation point and establish a parallel with the canonical bistable potential [20].
We can conjecture that evolutionary adaptation has provided embryonic development with the optimal speed for cellular differentiation and, consequently, deviation from this speed may lead to pathologies. The conditions leading to such anomalies, and their potential treatment, constitute still an important open question. The mechanism demonstrated here should have further impact in investigations of genetic circuits with high dimension and undergoing more complex types of bifurcation [31]. Also, since both subcritical and supercritical pitchfork bifurcations can explain decision making in cell differentiation (see e.g. lineage-commitment in bipotent blood progenitor cells [1]), it should be interesting to determine how the type of the bifurcation will affect SdCDM. Experimental differentiation studies, with special emphasis on pattern formation, constitute also a viable avenue that is expected to reveal interesting relationships between the speed at which the system grows, and the organized complexity permitted in morphogenesis [3].
Methods
The dynamics of the protein concentrations involved in our circuit (see Fig. 1A) is described by a phenomenological model following [7], [15] and assumed to be dimensionless:
| (1) |
| (2) |
 |
(3) |
 |
(4) |
In this model, Eqs. (1) and (2) represent the phosphorylation-dephosphorylation dynamics, where the latter is assumed to occur with a constant rate (corresponding to a constant phosphatase concentration, a common assumption in pathway modeling [32]). Phosphorylation, on the other hand, is considered to depend on the external signals. Following Fig. 1A this process is represented by:  , with the unit term standing for basal activation. The transcriptional input of
  contains the stimulatory action of its phosphorylated form
  and the inhibitory effect of
  , and is modeled according to a mean-field approach to promoter site occupation [15] (see Eq. (5)).
| (5) |
Respectively for the protein  . Both TFs are assumed to act as homodimers, a usual situation in real systems [33]. The parameters
  represent the ratio between the maximally activated expression rate and basal transcription, while
  denote ratios associated with activation and repression thresholds. The parameters
  are a measure of the promoter strength multiplied by translational efficiency [15]. Finally, the characteristic time scales of phosphorylation and protein expression are given by
  and
and  , respectively (see also Table 1).
Eqs. (1) to (4) were derived by assuming that transcription factor binding and unbinding, on the one hand, and  dynamics, on the other, are fast when compared to protein dynamics [7], [15], [19]. Although there is also a substantial difference between the time scales of translation and phosphorylation events [19], the profile of activation of each transcription factor or of signals
  has been proven to be fundamental to understand cell fate decision [34]–[36]. Therefore, we maintained the activation Eqs. (1) and (2). Moreover, this option allows us to extend in further studies the impact on cell fate decision, here equated with attractor selection, of partial inhibition of phosphorylation processes exerted by specific classes of drugs [37]. Most of the results on SdCDM presented in this work follow the system of Eqs. (1) to (4) with
  . Yet, for comparison purposes we extended part of the results of Fig. 2C (curve
  (i)) to include
  dynamics (curves
  (ii), (iii) and (iv), see Results section), where Eqs. (3) and (4) are substituted by Eqs. (6) to (9), with or without noise in
  and phosphorylation dynamics.
| (6) |
| (7) |
| (8) |
| (9) |
In Eqs. (6) and (7) the functions  follow a similar expression to Eq. (5), with adjusted parameters
  (see Eq. (10) and also Table 1 for comparison with the reduced model), but continue to set the model as dimensionless. Parameters
  (see Eq. (8) and (9)) represent translation.
| (10) |
Correspondingly for  . Both the reduced model (Eqs. (1) to (4)) and the extended one (Eqs. (6) to (9)) assume that the circuit operates in a constant-volume cell. In the case of the reduced model we take into account stochastic fluctuations only in gene expression [38], i.e.
  (see Fig. 3 A, B,
  (i) plot in C and Fig. 4). To that end,
  represents a Gaussian noise with zero mean and correlation
  , and models the contribution of intrinsic random fluctuations inherent to transcription and translation processes [16]. The multiplicative noise term in Eqs. (3) and (4) is interpreted according to Ito, which is the correct stochastic interpretation for a noise term arising from stochastic protein-gene interaction events [39]. Accordingly, the noise intensity functions
  and
and  that appear in Eqs. (3)–(4) take the following form [39] (see Eq. (11)).
| (11) |
Correspondingly for protein  . For the parameters
  in Eq. (1) and Eq. (2) and
  and
and  in Eq. (6) to Eq. (9), wherever it was computed (see Fig. 3C, plots
  (ii), (iii), (iv)), the procedure that led to Eq. (11) was once more applied [39] and
  also represent Gaussian noise with intensity
  .
.
All bifurcation diagrams (see Fig. 1) were created in XPPAUT [12]. Parameter  in Fig. 1B can be determined by
 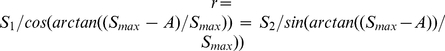 , where
  stands for the maximum asymmetry reached between
  and
and  (see Fig. 1C).
Furthermore, all simulation results were performed by numerically integrating the stochastic differential equations using the Heun method [14] with a scaled time-step of  . Each simulation was started at the steady state available for
  and subsequently the external signals
  were changed linearly until reaching the maximum value allowed (
 , see Fig. 1B). In order to calculate the ratio
  (see Fig. 3), the set of simulations was performed until an instant
  far beyond
  to secure that the system had converged.
With respect to Figs. 4A to D, the results were generated by sampling a  matrix of the
 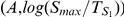 space and fitting a surface, through the
  linear interpolation method (MATLAB R2010b), to the numerical data obtained.
Footnotes
Competing Interests: The authors have declared that no competing interests exist.
Funding: NRN acknowledges financial support from the EPSRC at CoMPLEX, UCL, JGO from the Ministerio de Ciencia e Innovacion (Spain, project FIS2009-13360), the Spanish Multiple Sclerosis Network (REEM-ISCIII), and the ICREA Academia programme. The funders had no role in study design, data collection and analysis, decision to publish, or preparation of the manuscript.
References
- 1.Huang S, Guo Y, May G, Enver T. Bifurcation dynamics in lineage-commitment in bipotent progenitor cells. Dev Biol. 2007;305:695–713. doi: 10.1016/j.ydbio.2007.02.036. [DOI] [PubMed] [Google Scholar]
- 2.Kalmar T, Lim C, Hayward P, Muñoz-Descalzo S, Nichols J, et al. Regulated Fluctuations in Nanog Expression Mediate Cell Fate Decisions in Embryonic Stem Cells. PLoS Biol. 2009;7:e1000149. doi: 10.1371/journal.pbio.1000149. [DOI] [PMC free article] [PubMed] [Google Scholar]
- 3.Cohen M, Georgiou M, Stevenson N, Miodownik M, Baum B. Dynamic Filopodia Transmit Intermittent Delta-Notch Signaling to Drive Pattern Refinement during Lateral Inhibition. Dev Cell. 2010;19:78–89. doi: 10.1016/j.devcel.2010.06.006. [DOI] [PubMed] [Google Scholar]
- 4.Sprinzak D, Lakhanpal A, LeBon L, Santat LA, Fontes M, et al. Cis-interactions between Notch and Delta generate mutually exclusive signalling states. Nature. 2010;465:86–90. doi: 10.1038/nature08959. [DOI] [PMC free article] [PubMed] [Google Scholar]
- 5.Murray-Zmijewski F, Slee EA, Lu X. A complex barcode underlies the heterogeneous response of p53 to stress. Nature Rev Mol Cell Biol. 2008;9:702–712. doi: 10.1038/nrm2451. [DOI] [PubMed] [Google Scholar]
- 6.Widschwendter M, Fiegl H, Egle D, Mueller-Holzner E, Spizzo G, et al. Epigenetic stem cell signature in cancer. Nat Genet. 2007;39:157–158. doi: 10.1038/ng1941. [DOI] [PubMed] [Google Scholar]
- 7.Guantes R, Poyatos J. Multistable decision switches for flexible control of epigenetic differentiation. PLoS Comp Biol. 2008;4:e1000235. doi: 10.1371/journal.pcbi.1000235. [DOI] [PMC free article] [PubMed] [Google Scholar]
- 8.Berglund N, Gentz B. 2006. 276 Noise-Induced Phenomena in Slow-Fast Dynamical Systems: A Sample-Paths Approach: Springer-Verlag, London.
- 9.Kondepudi DK, Moss F, McClintock P. Observation of symmetry breaking, state selection and sensitivity in a noisy electronic system. Physica D. 1986;21:296–306. [Google Scholar]
- 10.Niwa H, Toyooka Y, Shimosato D, Strumpf D, Takahashi K, et al. Interaction between Oct3/4 and Cdx2 Determines Trophectoderm Differentiation. Cell. 2005;123:917–929. doi: 10.1016/j.cell.2005.08.040. [DOI] [PubMed] [Google Scholar]
- 11.Schwarz M, Cecconi F, Bernier G, Andrejewski N, Kammandel B, et al. Spatial specification of mammalian eye territories by reciprocal transcriptional repression of Pax2 and Pax6. Development. 2000;127:4325–4334. doi: 10.1242/dev.127.20.4325. [DOI] [PubMed] [Google Scholar]
- 12.Ermentrout B. 2002. 290 Simulating, Analyzing, and Animating Dynamical Systems: A Guide to Xppaut for Researchers and Students (Software, Environments, Tools): North-Holand, Amsterdam.
- 13.García-Ojalvo J, Sancho JM. 1999. 321 Noise in Spatially Extended Systems: Springer, New York.
- 14.Kloeden PE, Platen E. 1999. 636 Numerical solution of stochastic differential equations: Springer-Verlag, Berlin Heidelberg.
- 15.Andrecut M, Kauffman S. Mean-field model of genetic regulatory networks. New J Phys. 2006;8:148. [Google Scholar]
- 16.Swain P, Elowitz M, Siggia E. Intrinsic and extrinsic contributions to stochasticity in gene expression. Proc Natl Acad Sci USA. 2002;99:12795–12800. doi: 10.1073/pnas.162041399. [DOI] [PMC free article] [PubMed] [Google Scholar]
- 17.Murugan R, Kreiman G. On the Minimization of Fluctuations in the Response Times of Autoregulatory Gene Networks. Biophys J. 2011;101:1297–1306. doi: 10.1016/j.bpj.2011.08.005. [DOI] [PMC free article] [PubMed] [Google Scholar]
- 18.Bennett MR, Volfson D, Tsimring L, Hasty J. Transient dynamics of genetic regulatory networks. Biophys J. 2007;92:3501–3512. doi: 10.1529/biophysj.106.095638. [DOI] [PMC free article] [PubMed] [Google Scholar]
- 19.Alon U. 2007. 320 An Introduction to Systems Biology-design principles of biological circuits: Chapman & Hall/CRC, Taylor & Francis Group, Boca Raton.
- 20.Nene NR, Zaikin A. Decision making in bistable systems under the effect of external transient perturbations. 2012. Unpublished.
- 21.Wieczorek S, Luke CM, Ashwin P, Cox P. Excitability in ramped systems: the compost-bomb instability. Proc Royal Society A. 2011;467:1243. [Google Scholar]
- 22.Grossmann S, Mikhailov A. Sweeping through the critical region. Z Phys B-Condensed Matter. 1990;78:1–10. [Google Scholar]
- 23.Erneux T, Reiss EL, Holden LJ, Georgiou M. Slow Passage Through Bifurcation and Limit Points: Asymptotic Theory and Applications. In: Benoit E, editor. Dynamic bifurcations, Lecture Notes in Mathematics 1493. Springer-Verlag; 1990. pp. 14–28. [Google Scholar]
- 24.Sen S, Garcia-Ojalvo J, Elowitz MB. Dynamical Consequences of Bandpass Feedback Loops in a Bacterial Phosphorelay. PLoS ONE. 2011;6:e25102. doi: 10.1371/journal.pone.0025102. [DOI] [PMC free article] [PubMed] [Google Scholar]
- 25.Koseska A, Zaikin A, Kurths J, Garcia-Ojalvo J. Timing cellular decision making under noise via cell-cell communication. PLoS ONE. 2009;4:e4872. doi: 10.1371/journal.pone.0004872. [DOI] [PMC free article] [PubMed] [Google Scholar]
- 26.Kuchina A, Espinar L, Cagatay T, Balbin AO, Zhang F, et al. Temporal competition between differentiation programs determines cell fate choice. Mol Syst Biol. 2011;7:557. doi: 10.1038/msb.2011.88. [DOI] [PMC free article] [PubMed] [Google Scholar]
- 27.Berg J. Out-of-Equilibrium Dynamics of Gene Expression and the Jarzynski Equality. Phys Rev Lett. 2008;100:188101. doi: 10.1103/PhysRevLett.100.188101. [DOI] [PubMed] [Google Scholar]
- 28.Ge H, Qian H. Thermodynamic Limit of a Nonequilibrium Steady State: Maxwell-Type Construction for a Bistable Biochemical System. Phys Rev Lett. 2009;103:148103. doi: 10.1103/PhysRevLett.103.148103. [DOI] [PubMed] [Google Scholar]
- 29.Kobayashi TJ. Connection between Noise-Induced Symmetry Breaking and an Information-Decoding Function for Intracellular Networks. Phys Rev Lett. 2011;106:228101. doi: 10.1103/PhysRevLett.106.228101. [DOI] [PubMed] [Google Scholar]
- 30.Herrgen L, Ares S, Morelli LG, Schröter C, Jülicher F, et al. Intercellular Coupling Regulates the Period of the Segmentation Clock. Curr Bio. 2010;20:1244–1253. doi: 10.1016/j.cub.2010.06.034. [DOI] [PubMed] [Google Scholar]
- 31.Nene NR, Zaikin A. Interplay between path and speed in decision making by high-dimensional genetic networks. 2012. Unpublished. [DOI] [PMC free article] [PubMed]
- 32.Chen W, Schoeberl B, Jasper P, Niepel M, Nielsen U, et al. Input-output behavior of ErbB signaling pathways as revealed by a mass action model trained against dynamic data. Mol Sys Biol. 2009;5:239. doi: 10.1038/msb.2008.74. [DOI] [PMC free article] [PubMed] [Google Scholar]
- 33.Brivanlou A, Darnell J., Jr Signal Transduction and the Control of Gene Expression. Science. 2000;295:813–818. doi: 10.1126/science.1066355. [DOI] [PubMed] [Google Scholar]
- 34.Werner SL, Barken D, Hoffmann A. Stimulus Specificity of Gene Expression Programs Determined by Temporal Control of IKK Activity. Science. 2005;309:1857–1861. doi: 10.1126/science.1113319. [DOI] [PubMed] [Google Scholar]
- 35.Marshall CJ. Specificity of receptor tyrosine kinase signaling: transient versus sustained extracellular signal-regulated kinase activation. Cell. 1995;80:179–185. doi: 10.1016/0092-8674(95)90401-8. [DOI] [PubMed] [Google Scholar]
- 36.Murphy LO, Smith S, Chen RH, Fingar DC, Blenis J. Molecular interpretation of ERK signal duration by immediate early gene products. Nat Cell Biol. 2002;4:556–564. doi: 10.1038/ncb822. [DOI] [PubMed] [Google Scholar]
- 37.Zhang J, Yang PL, Gray NS. Targeting cancer with small molecule kinase inhibitors. Nat Rev Cancer. 2009;9:28–39. doi: 10.1038/nrc2559. [DOI] [PubMed] [Google Scholar]
- 38.Elowitz M, Levine A, Siggia E, Swain P. Stochastic gene expression in a single cell. Science. 2002;297:1183–1186. doi: 10.1126/science.1070919. [DOI] [PubMed] [Google Scholar]
- 39.Van Kampen N. 1992. 480 Stochastic Processes in Physics and Chemistry: North-Holand, Amsterdam.