


Abstract
Genomic imbalances are a major cause of constitutional and acquired disorders. Therefore, aneuploidy screening has become the cornerstone of preimplantation, prenatal and postnatal genetic diagnosis, as well as a routine aspect of the diagnostic workup of many acquired disorders. Recently, array comparative genomic hybridization (array CGH) has been introduced as a rapid and high-resolution method for the detection of both benign and disease-causing genomic copy-number variations. Until now, array CGH has been performed using a significant quantity of DNA derived from a pool of cells. Here, we present an array CGH method that accurately detects chromosomal imbalances from a single lymphoblast, fibroblast and blastomere within a single day. Trisomy 13, 18, 21 and monosomy X, as well as normal ploidy levels of all other chromosomes, were accurately determined from single fibroblasts. Moreover, we showed that a segmental deletion as small as 34 Mb could be detected. Finally, we demonstrated the possibility to detect aneuploidies in single blastomeres derived from preimplantation embryos. This technique offers new possibilities for genetic analysis of single cells in general and opens the route towards aneuploidy screening and detection of unbalanced translocations in preimplantation embryos in particular.
INTRODUCTION
Single-cell genetic analysis at the chromosomal or at the molecular level is important for basic research as well as for clinical purposes. An example is its use for aneuploidy screening of preimplantation embryos obtained by in vitro fertilization (IVF) (1). Aneuploidy screening of a single cell would allow addressing basic questions about the chromosomal constitution of gametes and the mitotic stability of chromosomes during early embryogenesis. In the clinic, this screening could be used to select a single embryo with the highest chance to implant (1). Several methods, such as fluorescent in situ hybridization (FISH) and PCR-based methods, have been used to analyse chromosomes of a single cell, e.g. a blastomere biopsied from an 8-cell embryo (2). However, these approaches can only analyse a small number of genetic loci in a single cell.
By contrast, genome-wide aneuploidy screening of a single cell can be performed by comparative genomic hybridization (CGH) following whole genome amplification (WGA) by degenerated oligonucleotide primed PCR (DOP-PCR) or linker-adaptor PCR. In this method, two DNA samples, one obtained by DNA amplification from the single cell of interest and one from a reference, are differentially labelled and hybridized to metaphase spreads derived from cells of a chromosomally normal individual. CGH has been applied to detect chromosomal copy-number changes within single blastomeres or polar bodies (3) and within single cancer cells (4). Nonetheless, this method is labour intensive and time consuming, which limits its diagnostic potential and hampers its use in research.
Based on the same principle as metaphase CGH, array CGH differs in that genomic clones from selected regions of the genome are spotted on a slide, replacing normal ‘control’ metaphase cells as the target DNA (5,6). This method has a high-resolution and is amenable to automation. Thus far, array CGH has mainly been performed using DNA from large numbers of cells. Attempts to reduce the amount of DNA needed for array CGH resulted in the accurate detection of copy-number variations from as little as 1 ng of DNA (7). Recently, Hu et al. (8) have used array CGH for the detection of chromosomal copy-number variation from single lymphoblasts and fibroblasts following DOP-PCR amplification. However, no robust results were obtained since incorrect ratios were sometimes observed for chromosomes 2, 4, 9, 11, 17, 22, X and Y.
The major hurdle towards genome-wide single-cell analysis is the difficulty to amplify genomic DNA (gDNA) without sequence bias. Recently, an isothermal DNA amplification method (termed multiple displacement amplification, MDA) has been applied to small DNA samples or single cells, leading to the synthesis of DNA with limited sequence representation bias (9–12). Here, we have extended array CGH technology by making the accurate detection of chromosomal imbalances possible from a single lymphoblast, fibroblast and blastomere following MDA.
MATERIALS AND METHODS
Cell lines
Epstein–Barr virus (EBV)-transformed lymphoblasts and fibroblasts were used to develop the single-cell amplification and the array CGH experiments. Four different fibroblast cell lines were derived from patients affected by, respectively, trisomy 13, 18, 21 and monosomy X. Fibroblasts containing an interstitial 4q deletion (46,XX,del(4)(q13.1q22.3)) and EBV cells containing an unbalanced reciprocal translocation involving chromosomes 14 and X (46,XX,der(X)t(X;14)(q21.3;q23.1)) were used for segmental deletion/duplication detection. Array CGH experiments were performed using gDNA from the two cell lines containing a segmental deletion and/or duplication to define the exact size of each rearrangement. For the fibroblasts containing an interstitial 4q deletion, the size of the deleted region was 34 Mb corresponding to 39 clones spotted on the array (from RP11-340A13 to RP11-44P19). For the EBV cell line, the size of the 14q duplication was 47 Mb corresponding to 63 clones (from RP11-62H20 to CTC-820M16) and the Xq deletion was 58 Mb corresponding to 70 clones (from RP3-380C13 to RP11-218L14). For each of the six cell lines, three single cells were amplified.
Collection and lysis of single cells
Lymphoblasts or fibroblasts were washed three times in 500 µl phosphate-buffered saline. The cells were then washed in droplets of Ca2+- and Mg2+-free medium [14 mM NaCl, 0.2 mM KCl, 0.04 mM NaH2PO4·2H2O, 5.5 mM glucose, 1.2 mM NaHCO3, 0.02 mM EDTA and 0.01% (w/v) phenol red] supplemented with 15 mg/ml BSA (Sigma–Aldrich, St Louis, MO) using fine hand-drawn microcapillaries and were transferred to 200 µl PCR tubes containing 2.5 µl alkaline lysis buffer (ALB; 200 mM KOH and 50 mM DTT). An aliquot from the last washing droplet was taken as a negative control for each collected single cell. The samples were stored at −80°C for at least 30 min and were further incubated for 10 min at 65°C prior to the MDA reaction.
Embryo biopsy and disaggregation
Approval for the present study was obtained from the institutional committee of medical ethics (Vrije Universiteit Brussel) and all donating patients gave informed consent. Embryo 1 used in this study was from a couple who underwent preimplantation genetic diagnosis (PGD) for aneuploidy screening, in which case FISH was performed for chromosomes 13, 18, 21, X and Y (13). Embryo 2 was from a couple who underwent PGD because the mother was a Robertsonian translocation carrier involving chromosomes 13 and 14, in which case FISH was performed for chromosomes 13, 14, 18, 21, X and Y. The embryo biopsy was performed the morning of day 3 after oocyte retrieval. A hole was made in the zona pellucida (ZP) using two or three laser pulses of 5–7 ms of a non-contact 1.48 µm diode laser system (Fertilase, Octax, Herbron, Germany) coupled to a micromanipulator on an inverted microscope. Two blastomeres containing a nucleus were gently aspirated and used for FISH analysis.
The two embryos diagnosed by FISH as being abnormal were selected for array CGH analysis. Embryos were briefly incubated in acidic Tyrode's solution (pH 2.4) (Vitrolife, Goteborg, Sweden) to remove the ZP. They were then transferred to droplets of Ca2+- and Mg2+-free medium supplemented with 4 mg/ml BSA and gently pipetted to disaggregate the individual blastomeres. Blastomeres with a clearly visible nucleus were washed three times in the dissociation medium and transferred using a mouth-piece and a finely drawn Pasteur pipette to a 200 µl PCR tube containing 2.5 µl ALB. An aliquot was taken from the last washing droplet to serve as a negative control and samples and blanks were further treated as described for the single lymphoblasts or fibroblasts.
Whole genome amplification
DOP-PCR amplifications and MDA with Bst DNA polymerase were performed using 1 ng and 100 pg of gDNA as well as single-cell lysates according to the protocols described by Hu et al. (8) or Lage et al. (11), respectively. MDA with ϕ29 DNA polymerase was performed using the GenomiPhi DNA Amplification Kit (GE Healthcare, Piscataway, NJ). The ϕ29 DNA polymerase was assayed on 100 pg gDNA and single-cell lysates. Prior to the MDA reaction, 2.5 µl of neutralization buffer (0.9 M Tris–HCl, pH 8.3, 0.3 M KCl and 0.2 M HCl) was added to the sample to neutralise ALB. GenomiPhi sample buffer (9 µl) containing the random hexamer primers was added to the template followed by GenomiPhi reaction buffer (9 µl) and GenomiPhi Enzyme Mix (1 µl). The isothermal amplification was performed at 30°C for 3 h and the reaction was stopped upon incubation at 65°C for 10 min. The MDA products were purified and resuspended in 50 µl of elution buffer (High Pure PCR Product Purification Kit, Roche, Basel, Switzerland). All amplification products were quantified with a spectrophotometer (Nanodrop ND-1000 spectrophotometer; Nanodrop Technologies, Rockland, DE) and their quality was evaluated by PCR for two loci (IVS27AC28.4 and D17S1841).
Although spectrophotometric analysis showed DNA in the MDA negative controls, no amplification product was detected after locus-specific PCR in any of the negative controls, proving that the amplified DNA was non-specific and did not originate from contamination with human DNA. The non-specific DNA is most probably due to primer-directed DNA synthesis in the absence of DNA template or to contamination of the enzyme with bacterial DNA.
Array CGH
For fibroblasts and blastomeres aneuploidy screening, an array (KUL Human 4K BAC array Aneuploidy screening) containing 4114 clones [3587 BAC and PAC clones at an average resolution of 1 Mb (14), 96 additional clones (RP clones; plate 1, offset A1) for each of the chromosomes 18, 19, 20, 21 and 22 from the Human 32K BAC Re-Array of CHORI BACPAC Resources (http://bacpac.chori.org/genomicRearrays.php) and 47 home-made clones (CME)] was used (15). The products were arrayed in duplicate using a Lucidea spotter (GE Healthcare).
Array CGH was carried out as described previously (15) with minor modifications. Non-amplified gDNAs from male and female controls were used as references. Amplified (test) and reference DNA samples (300 ng each) were labelled for 2 h by random primer labelling (BioPrime Array CGH Genomic Labelling System; Invitrogen, Carlsbad, CA) using Cy5- and Cy3-labelled dCTPs (GE Healthcare), respectively. Since Cy5-labelled DNA gave higher intensity signals than Cy3-labelled DNA, a lower amount of Cy5-labelled DNA was mixed to Cy3-labelled DNA, 2.1 and 4.9 µg, respectively, as calculated from the spectrophotometric values. Labelled probes were combined with 100 µg Cot-1 DNA (human Cot-1 DNA; Invitrogen) followed by ethanol precipitation. Resuspension of the pellet was done in 45 µl hybridization buffer (50% formamide, 10% dextran sulfate, 0.1% Tween-20, 2× SSC and 10 mM Tris–HCl, pH 7.5) containing 400 µg yeast tRNA to hybridize a spotting area of 24 × 60 mm during one night. The slide was blocked with 50 µg Cot-1 DNA and 300 µg salmon testes DNA (DNA from salmon testes, Sigma Aldrich) dissolved in 60 µl hybridization buffer.
Experiments using single cells containing a segmental deletion and/or duplication were performed later. A second array (KUL Human 4K_2 BAC array Aneuploidy screening) containing 4013 clones [3475 BAC and PAC clones at an average resolution of 1 Mb, 96 additional clones (RP clones; plate 1, offset A1) for each of the chromosomes 18, 19, 20, 21 and 22 from the Human 32K BAC Re-Array of CHORI BACPAC Resources and 58 home-made clones (CME)] was developed using a new generation spotter (MicroGrid II spotter; Genomic Solutions, Cambridge, UK) allowing higher density arrays. Since the clones were spotted in duplicate on an area two times reduced, amplified and reference DNAs, labelled DNAs, buffers and Cot-1 DNA quantities were also two times reduced.
Since non-specific DNA was present in the MDA negative controls, we hypothesized that this DNA would increase the background noise of each spot. To test this possibility, the negative control DNA was added to the blocking solution before hybridization. However, no significant higher signal-to-noise ratios were obtained suggesting that the non-specific DNA was not a major cause of array noise and it was omitted in all subsequent experiments.
Following labelling, hybridization and washing of the slides, arrays were scanned at 532 and 635 nm using a GenePix 4000B scanner (Axon Instruments Inc., Foster City, CA). The scan images were processed with GenePix Pro 6.0 software. Data analysis was performed using Excel (Microsoft Corporation, Redmond, WA). In short, spot intensities were corrected for local background and only spots with signal intensities at least 1.2-fold above background were included in the analysis. Since all clones were printed in duplicate, two ratios of Cy5 to Cy3 fluorescent intensity (log2 ratio) were calculated for each. For the abnormal cell lines and embryo 1, the abnormalities were known in advance. So, for each array, normalization of the data was achieved by subtracting the median of the log2 signal intensities over all the autosomal fragments with measurements from abnormal chromosomes masked out. Since for embryo 2, the complex patterns of chromosomal imbalances were not known in advance, all log2 signal intensities were first included in the analysis. Subsequently, mean intensity ratios corresponding with likely monosomies and trisomies were masked out.
A mean of all remaining spots of each chromosome was calculated. The chromosome-specific threshold of individual chromosomes (chromosome-specific threshold), was determined as the averaged log2 ratio (over each chromosome individually) of our 18 or 12 experiments (for abnormal cell lines and blastomeres, respectively) plus or minus three times the standard deviation of the averaged log2 ratio.
Genomic microarray data
The genomic microarray data discussed in this publication have been deposited in NCBIs Gene Expression Omnibus (GEO; http://www.ncbi.nlm.nih.gov/geo/) and are accessible through GEO series accession nos GSE3642 and GSE4244.
RESULTS
Optimization of the array CGH procedure
We compared the efficacy of different WGA methods—DOP-PCR and MDA by Bst or ϕ29 DNA polymerases—to generate sufficient amplified DNA with a quality enabling array CGH. Amplification of 100 pg and single lymphoblast gDNA by ϕ29 DNA polymerase resulted in higher final yields compared with DOP-PCR and Bst amplifications. By assaying the quality of the amplified DNA using PCR amplification of microsatellite markers, ϕ29 DNA polymerase proved to be the most efficient method (16).
As a reference sample, we compared MDA-amplified single-cell DNA and non-amplified gDNA. MDA-amplified reference DNA was tested because we expected that sequence-specific biases during the amplification process could cause the over- and under-representation of specific genomic sequences. The presence of the same over- and under-representation in both reference and test samples might average out and reduce intensity ratio imbalances. For a proof of principle, female DNA was hybridized against male DNA (sex-mismatch). For the X chromosome, averaged ratios were 0.77 ± 0.12 with amplified single-cell DNA (n = 5) and 0.70 ± 0.12 with non-amplified gDNA (n = 5) and for the Y chromosome −1.25 ± 0.27 with amplified single-cell DNA (n = 5) and −1.63 ± 0.14 with non-amplified gDNA (n = 5), whereas averaged ratios for the autosomes equalled 0. Hence, a lower standard deviation of the overall autosomal intensity ratios was observed when using non-amplified gDNA as a reference (n = 5; 0.84 ± 0.049) compared with amplified single-cell reference DNA (n = 5; 1.13 ± 0.045). Therefore, all subsequent array CGH experiments were conducted with non-amplified gDNA as a reference. The overall mean intensity ratios approached 0 for all chromosomes, except for chromosome 19 (n = 10; −0.17 ± 0.1) and chromosome 22 (n = 10; −0.19 ± 0.3), a bias reported previously in metaphase CGH analyses from single cells (17–19). Therefore, the interpretation of chromosomes 19 and 22 aneuploidy may be subject to ambiguity, which need attention in future experiments. To make the single-cell aneuploidy detection amenable for clinical PGD, ϕ29 DNA polymerase amplification was reduced from 16 to 3 h, labelling from one night to 2 h and hybridization from two nights to one night without significant reduction of the array CGH quality. All experiments were conducted using this optimized and fast protocol.
Validation and analysis by aneuploidy screening in fibroblasts
For each aneuploid cell line (trisomies 13, 18, 21, and monosomy X), three single cells were amplified. Following DNA amplification, all cells showed the expected DNA yields (n = 12; 1.87 µg ± 0.39). Two different locus-specific PCRs (IVS27AC28.4 and D17S1841) were performed on all amplified cells. Specific amplification was obtained in all amplified single-cell DNA with the D17S1841 marker and in 10 out of 12 cells with the IVS27AC28.4 marker.
Sex-mismatch array CGH experiments were conducted on amplified DNA samples obtained from each cell. We analysed our array CGH data obtained from the abnormal cell lines (n = 18; 12 experiments performed on aneuploid single cells and 6 on single cells containing a segmental deletion and/or duplication) using a chromosome-specific threshold as described in Materials and Methods. Using the averaged log2 ratio (over each chromosome individually) of our 18 experiments plus or minus three times the standard deviation of the averaged log2 ratio, sex chromosome ploidy levels, as well as all expected autosomal abnormalities were accurately identified (Table 1; Figure 1A–D). Overall, neither false negatives nor false positives were detected (Figure 2).
Table 1.
Averaged log2 intensity ratios of all chromosomes following array CGH on single fibroblasts and EBV cells
| Chromosome | T13_cell1 | T13_cell2 | T13_cell3 | T18_cell1 | T18_cell2 | T18_cell3 | T21_cell1 | T21_cell2 | T21_cell3 | 45,X_cell1 | 45,X_cell2 | 45,X_cell3 | del(4q)_cell1 | del(4q)_cell2 | del(4q)_cell3 | der(X)_cell1 | der(X)_cell2 | der(X)_cell3 |
|---|---|---|---|---|---|---|---|---|---|---|---|---|---|---|---|---|---|---|
| 1 | −0.03 | 0.10 | 0.03 | 0.05 | 0.02 | 0.01 | 0.14 | 0.01 | 0.08 | 0.17 | 0.05 | 0.15 | 0.06 | −0.05 | 0.03 | 0.01 | −0.08 | −0.02 |
| 2 | −0.03 | 0.02 | 0.04 | 0.03 | 0.08 | 0.06 | 0.16 | 0.12 | 0.12 | 0.16 | 0.11 | 0.12 | 0.05 | 0.09 | 0.03 | 0.08 | 0.11 | 0.10 |
| 3 | 0.05 | 0.03 | 0.10 | 0.07 | 0.15 | 0.08 | 0.18 | 0.12 | 0.14 | 0.14 | 0.02 | 0.06 | 0.12 | 0.14 | 0.11 | 0.07 | 0.07 | 0.06 |
| 4 | 0.13 | 0.01 | 0.09 | 0.03 | 0.19 | 0.13 | 0.05 | 0.09 | 0.13 | 0.09 | 0.10 | 0.06 | ND | ND | ND | −0.01 | 0.09 | 0.08 |
| 5 | 0.16 | −0.05 | 0.08 | 0.14 | 0.09 | 0.12 | −0.04 | 0.09 | 0.25 | −0.01 | 0.09 | −0.01 | 0.01 | 0.05 | 0.04 | 0.07 | −0.05 | 0.15 |
| 6 | −0.05 | 0.01 | −0.02 | 0.05 | 0.14 | 0.02 | 0.15 | 0.10 | 0.13 | 0.08 | 0.03 | 0.11 | 0.04 | 0.05 | 0.13 | 0.00 | 0.02 | 0.08 |
| 7 | 0.04 | 0.17 | 0.06 | 0.01 | −0.03 | −0.03 | −0.03 | −0.01 | 0.07 | 0.09 | 0.21 | 0.12 | 0.01 | 0.03 | 0.05 | 0.03 | −0.06 | 0.02 |
| 8 | 0.15 | 0.12 | 0.03 | 0.10 | 0.15 | 0.20 | 0.08 | 0.22 | 0.02 | 0.17 | 0.20 | 0.14 | 0.26 | 0.12 | 0.15 | 0.01 | 0.12 | 0.06 |
| 9 | 0.01 | −0.03 | 0.13 | −0.06 | −0.05 | −0.14 | 0.12 | 0.09 | −0.05 | 0.12 | 0.08 | 0.08 | −0.10 | −0.01 | 0.11 | −0.02 | 0.15 | −0.06 |
| 10 | −0.01 | 0.04 | 0.03 | 0.06 | 0.01 | 0.06 | 0.03 | 0.07 | 0.07 | 0.04 | 0.09 | 0.00 | 0.05 | −0.02 | −0.06 | 0.02 | −0.09 | 0.04 |
| 11 | −0.06 | 0.01 | −0.06 | 0.04 | −0.02 | 0.01 | 0.01 | −0.06 | 0.06 | −0.03 | −0.02 | 0.00 | 0.07 | −0.14 | −0.09 | 0.00 | −0.05 | −0.17 |
| 12 | 0.00 | 0.00 | 0.01 | 0.02 | 0.00 | −0.05 | 0.04 | 0.04 | 0.04 | 0.12 | 0.16 | 0.11 | −0.02 | −0.01 | 0.03 | 0.06 | 0.05 | 0.01 |
| 13 | 0.52 | 0.48 | 0.74 | −0.14 | −0.03 | 0.04 | 0.03 | 0.11 | 0.00 | 0.22 | 0.20 | 0.18 | 0.04 | 0.04 | 0.00 | 0.04 | 0.10 | 0.03 |
| 14 | 0.09 | 0.04 | −0.07 | 0.06 | 0.01 | 0.08 | 0.00 | 0.09 | 0.05 | 0.05 | 0.10 | 0.07 | 0.08 | 0.08 | 0.15 | ND | ND | ND |
| 15 | −0.12 | 0.00 | −0.01 | 0.01 | 0.03 | 0.21 | 0.10 | 0.12 | −0.02 | 0.12 | 0.25 | 0.07 | 0.14 | −0.10 | 0.08 | 0.04 | 0.07 | 0.09 |
| 16 | −0.15 | −0.01 | −0.22 | −0.13 | 0.17 | −0.10 | 0.16 | −0.12 | −0.06 | −0.06 | 0.04 | −0.06 | −0.06 | −0.17 | 0.07 | −0.01 | 0.03 | −0.06 |
| 17 | −0.13 | 0.08 | −0.10 | −0.13 | 0.04 | −0.10 | 0.06 | −0.09 | 0.09 | −0.06 | −0.19 | −0.05 | −0.22 | −0.32 | 0.01 | −0.07 | −0.20 | −0.15 |
| 18 | 0.19 | 0.17 | 0.12 | 0.55 | 0.51 | 0.59 | 0.29 | 0.07 | 0.23 | 0.09 | 0.07 | 0.10 | 0.02 | 0.09 | 0.14 | −0.04 | 0.06 | 0.03 |
| 19 | −0.11 | −0.01 | −0.19 | −0.17 | −0.17 | −0.40 | −0.26 | −0.20 | −0.06 | −0.20 | −0.21 | −0.07 | −0.36 | −0.32 | −0.32 | −0.17 | −0.19 | −0.28 |
| 20 | 0.05 | 0.11 | 0.16 | 0.01 | −0.01 | −0.10 | −0.21 | −0.06 | 0.02 | 0.02 | −0.03 | 0.09 | −0.16 | −0.34 | −0.04 | 0.05 | 0.02 | −0.25 |
| 21 | 0.03 | 0.09 | −0.12 | −0.18 | 0.04 | −0.18 | 0.50 | 0.38 | 0.59 | −0.05 | −0.07 | 0.13 | 0.00 | 0.09 | −0.12 | −0.02 | 0.02 | −0.10 |
| 22 | −0.20 | 0.00 | −0.07 | −0.18 | −0.40 | −0.29 | 0.12 | −0.29 | −0.41 | −0.22 | −0.25 | −0.13 | −0.39 | −0.38 | −0.23 | −0.10 | −0.21 | −0.41 |
| X | 0.86 | 0.67 | 0.72 | −0.68 | −0.49 | −0.83 | −0.64 | −0.51 | −0.62 | −0.75 | −0.57 | −0.51 | 0.87 | 0.86 | 0.91 | ND | ND | ND |
| Y | −1.33 | −1.25 | −1.22 | 1.59 | 2.00 | 2.06 | 1.57 | 2.01 | 1.71 | 0.29 | 0.29 | 0.29 | −2.01 | −2.00 | −1.96 | −1.89 | −2.14 | −1.79 |
| gDNA | XY | XY | XY | XX | XX | XX | XX | XX | XX | XX | XX | XX | XY | XY | XY | XY | XY | XY |
Figure 1.

(A–D) Examples of single-cell array CGH profiles performed on aneuploid cell lines. For each panel, the x-axis represents the 22 autosomes, followed by the X and Y chromosomes. The y-axis marks the log2 mean ratios of all spots of each chromosome. Following ϕ29 DNA polymerase amplification, single cells containing trisomy 13 (A), 18 (B) and 21 (C) were hybridized versus non-amplified gDNA of the opposite sex, and monosomic X single cell (D) versus non-amplified XX gDNA. The checked columns represent the abnormal chromosomes.
Figure 2.

Overview of single-cell experiments performed on aneuploid cell lines and analysis using chromosome-specific threshold. The closed circles represent the mean intensity ratios of chromosomes 13, 18 and 21 of each respective trisomy cell line. The open circles represent the mean intensity ratios of X and Y chromosomes of monosomy X cell line. The x-axis represents the 22 autosomes, the X and Y chromosomes. The y-axis marks the log2 mean ratio of the 18 single-cell experiments for each chromosome. The grey columns represent the mean ratios of the 18 experiments of each chromosome plus or minus three times the standard deviation representing the chromosome-specific threshold.
Segmental deletion/duplication detection on EBV lymphoblasts and fibroblasts
Array CGH experiments were performed on fibroblasts containing an interstitial 4q deletion and lymphoblasts containing a 14q duplication and a Xq deletion. For each cell line, three single cells were amplified. Following DNA amplification, all cells showed the expected DNA yields (n = 6; 2.36 µg ± 0.12). Two different locus-specific PCRs (IVS27AC28.4 and D17S1841) were performed on all amplified cells. Specific amplification was obtained in all amplified single-cell DNA with both the D17S1841 and the IVS27AC28.4 markers.
Sex-mismatch array CGH experiments were conducted on amplified DNA samples obtained from each of the three single cells containing an interstitial 4q deletion. Using the chromosome-specific threshold obtained from our 18 experiments, sex chromosome and autosome ploidy levels were accurately identified with no false negative and no false positive results. Averaging the 39 clones within the chromosome 4q deleted region enabled the accurate detection of the deletions (Table 2 and Figure 3A). For each of the three amplified single-cell DNA of the unbalanced reciprocal translocation involving chromosomes 14 and X, male and female gDNA were used as references. Sex chromosome and autosome ploidy levels were accurately identified (Table 3). Averaging intensity ratios of the 63 clones within the chromosome 14 duplicated region enabled the accurate detection of the duplications in the three replicate experiments (Table 3 and Figure 3B and C). When male or female gDNA were used as a reference, the averaged log2 mean ratio of the Xq deleted region was −0.04 or −0.93, respectively, close to the theoretical expected values of 0 or minus 1 (Figure 3B and C). Interestingly, the log2 mean ratios of chromosomes 1–22 were highly similar when the same single-cell amplified DNA was used for the two experiments using female and male DNA as a reference, respectively. Hence, array CGH intensity ratio profiles were very reproducible (Table 3).
Table 2.
Averaged log2 intensity ratios of the 4q deletion and the normal chromosomes following array CGH on single fibroblasts
| Chromosome | del(4q)_cell1 | del(4q)_cell2 | del(4q)_cell3 |
|---|---|---|---|
| 1 | 0.06 | −0.05 | 0.03 |
| 2 | 0.05 | 0.09 | 0.03 |
| 3 | 0.12 | 0.14 | 0.11 |
| 4a | −0.23 | −0.03 | −0.11 |
| 4b | −0.66 | −0.56 | −0.58 |
| 4c | 0.14 | 0.26 | 0.10 |
| 5 | 0.01 | 0.05 | 0.04 |
| 6 | 0.04 | 0.05 | 0.13 |
| 7 | 0.01 | 0.03 | 0.05 |
| 8 | 0.26 | 0.12 | 0.15 |
| 9 | −0.10 | −0.01 | 0.11 |
| 10 | 0.05 | −0.02 | −0.06 |
| 11 | 0.07 | −0.14 | −0.09 |
| 12 | −0.02 | −0.01 | 0.03 |
| 13 | 0.04 | 0.04 | 0.00 |
| 14 | 0.08 | 0.08 | 0.15 |
| 15 | 0.14 | −0.10 | 0.08 |
| 16 | −0.06 | −0.17 | 0.07 |
| 17 | −0.22 | −0.32 | 0.01 |
| 18 | 0.02 | 0.09 | 0.14 |
| 19 | −0.36 | −0.32 | −0.32 |
| 20 | −0.16 | −0.34 | −0.04 |
| 21 | 0.00 | 0.09 | −0.12 |
| 22 | −0.39 | −0.38 | −0.23 |
| X | 0.87 | 0.86 | 0.91 |
| Y | −2.01 | −2.00 | −1.96 |
| gDNA | XY | XY | XY |
4a represent the region from the subtelomere 4p to the centromeric breakpoint of the deletion (59.8 Mb), 4b correspond to the 4q deletion (34 Mb) and 4c the region from the distal breakpoint of the deletion to the subtelomere 4q (97.6 Mb); gDNA: sex chromosomes of the reference gDNA. Ratios exceeding the thresholds are shown in bold pinpointing potential (segmental) trisomies and monosomies.
Figure 3.
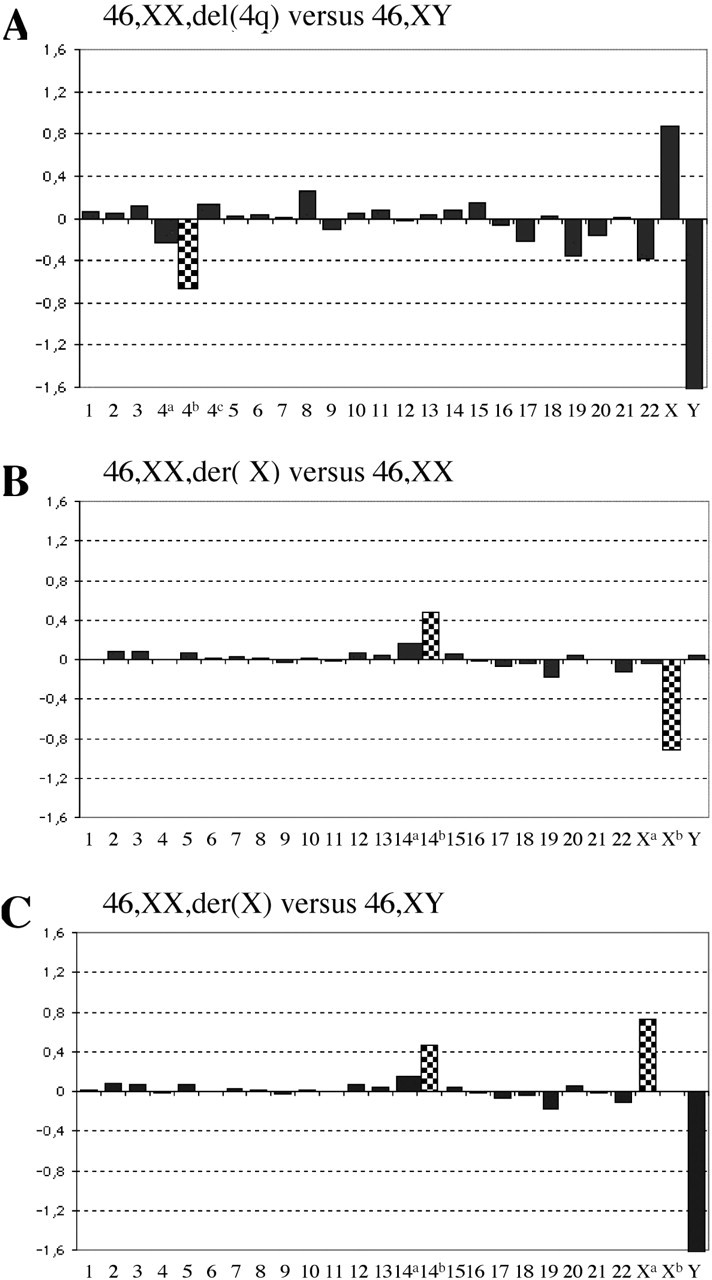
(A–C) Examples of single-cell array CGH profiles performed on cell lines containing a segmental deletion and/or duplication. (A) Following ϕ29 DNA polymerase amplification, single cells containing an interstitial 4q deletion were hybridized versus non-amplified gDNA of the opposite sex. The y-axis marks the log2 mean ratios of all spots of each chromosome. The x-axis represents the 22 autosomes, followed by the X and Y chromosomes. Chromosome 4 was divided in three regions: 4a represented the region from the subtelomere 4p to the centromeric breakpoint of the deletion (59.8 Mb), 4b corresponded to the 4q deletion (34 Mb) and 4c the region from the distal breakpoint of the deletion to the subtelomere 4q (97.6 Mb). The deleted region (4b) showed the expected log2 mean ratio. (B and C) Following ϕ29 DNA polymerase amplification, single cells containing an unbalanced reciprocal translocation involving chromosomes X and 14 were hybridized versus non-amplified 46,XX and 46,XY gDNA. The y-axis marks the log2 mean ratios of all spots of each chromosome. Chromosome 14 was divided in two regions: 14a represented the region from the centromere to the breakpoint of the translocation (59.4 Mb), 14b corresponded to the 14q duplication (47 Mb). Chromosome X was divided in two regions: Xa represented the region from the subtelomere Xp to the breakpoint of the translocation (59.7 Mb) and Xb corresponded to the Xq deletion. When hybridized versus female gDNA (B), a deletion of Xb was expected, whereas hybridised versus male gDNA (C), a log2 mean ratio corresponding to a duplication of Xa was expected. The checked columns represent the 4q- and the Xq-deleted regions and the 14q-duplicated region.
Table 3.
Averaged log2 intensity ratios of the 14q duplication, the Xq deletion and the normal chromosomes following array CGH on single EBV cells
| Chromosome | der(X)_cell1 | der(X)_cell2 | der(X)_cell3 | der(X)_cell1 | der(X)_cell2 | der(X)_cell3 |
|---|---|---|---|---|---|---|
| 1 | 0.01 | −0.08 | −0.02 | −0.01 | −0.08 | −0.05 |
| 2 | 0.08 | 0.11 | 0.10 | 0.08 | 0.11 | 0.11 |
| 3 | 0.07 | 0.07 | 0.06 | 0.08 | 0.05 | 0.06 |
| 4 | −0.01 | 0.09 | 0.08 | −0.01 | 0.08 | 0.06 |
| 5 | 0.07 | −0.05 | 0.15 | 0.07 | −0.03 | 0.16 |
| 6 | 0.00 | 0.02 | 0.08 | 0.01 | 0.02 | 0.10 |
| 7 | 0.03 | −0.06 | 0.02 | 0.02 | −0.05 | 0.02 |
| 8 | 0.01 | 0.12 | 0.06 | 0.01 | 0.10 | 0.03 |
| 9 | −0.02 | 0.15 | −0.06 | −0.03 | 0.16 | −0.08 |
| 10 | 0.02 | −0.09 | 0.04 | 0.01 | −0.09 | 0.07 |
| 11 | 0.00 | −0.05 | −0.17 | −0.01 | −0.05 | −0.17 |
| 12 | 0.06 | 0.05 | 0.01 | 0.07 | 0.04 | 0.01 |
| 13 | 0.04 | 0.10 | 0.03 | 0.04 | 0.12 | 0.04 |
| 14a | 0.15 | −0.01 | 0.23 | 0.16 | 0.00 | 0.23 |
| 14b | 0.47 | 0.38 | 0.63 | 0.48 | 0.37 | 0.67 |
| 15 | 0.04 | 0.07 | 0.09 | 0.05 | 0.07 | 0.11 |
| 16 | −0.01 | 0.03 | −0.06 | −0.02 | 0.05 | −0.06 |
| 17 | −0.07 | −0.20 | −0.15 | −0.07 | −0.17 | −0.14 |
| 18 | −0.04 | 0.06 | 0.03 | −0.04 | 0.06 | 0.02 |
| 19 | −0.17 | −0.19 | −0.28 | −0.18 | −0.16 | −0.32 |
| 20 | 0.05 | 0.02 | −0.25 | 0.05 | 0.03 | −0.28 |
| 21 | −0.02 | 0.02 | −0.10 | 0.00 | 0.02 | −0.10 |
| 22 | −0.10 | −0.21 | −0.41 | −0.12 | −0.21 | −0.45 |
| Xa | 0.73 | 1.00 | 0.93 | −0.03 | 0.20 | 0.22 |
| Xb | 0.00 | −0.03 | −0.09 | −0.91 | −0.80 | −1.07 |
| Y | −1.89 | −2.14 | −1.79 | 0.05 | 0.05 | 0.17 |
| gDNA | XY | XY | XY | XX | XX | XX |
14a represent the region from the centromere to the breakpoint of the translocation (59.4 Mb); 14b correspond to the 14q duplication (47 Mb); Xa represent the region from the subtelomere Xp to the breakpoint of the translocation (59.7 Mb); Xb correspond to the Xq deletion; gDNA, sex chromosomes of the reference gDNA. Ratios exceeding the thresholds are shown in bold pinpointing potential (segmental) trisomies and monosomies.
Aneuploidy screening in human blastomeres
DNA from blastomeres from two 8 cell-stage embryos was amplified with ϕ29 DNA polymerase. All cells yielded the expected amount of DNA (n = 12; 2.53 µg ± 0.27). To verify the quality of this amplified single-cell DNA, two different locus-specific PCRs (D17S1841 and IVS27AC28.4) were performed and specific amplification was obtained for at least one of these two markers. The D17S1841 marker was amplified in 11 out of 12 single-cells and the IVS27AC28.4 marker in all amplified single-cells.
By FISH, embryo 1 was diagnosed as monosomic for chromosome X, while chromosomes 13, 18 and 21 were normal. Array CGH on each of the six amplified blastomeres confirmed monosomy X (n = 6; −0.67 ± 0.1) with no additional abnormalities (Tables 4 and 5 and Figure 4A).
Table 4.
Averaged log2 intensity ratios of all chromosomes following array CGH on single blastomeres
| Chromosome | E1_cell1 | E1_cell2 | E1_cell3 | E1_cell4 | E1_cell5 | E1_cell6 | E2_cell1 | E2_cell2 | E2_cell3 | E2_cell4 | E2_cell5 | E2_cell6 |
|---|---|---|---|---|---|---|---|---|---|---|---|---|
| 1 | 0.09 | 0.03 | −0.06 | −0.12 | −0.09 | −0.05 | −0.67 | −0.67 | −0.63 | 0.51 | 0.40 | −0.87 |
| 2 | 0.12 | −0.06 | 0.03 | 0.07 | 0.16 | 0.15 | −0.10 | 0.06 | −0.03 | −0.21 | −0.04 | 0.06 |
| 3 | 0.04 | 0.15 | 0.16 | 0.13 | 0.14 | 0.12 | −0.70 | −0.52 | −0.67 | 0.27 | 0.34 | −0.80 |
| 4 | −0.04 | 0.12 | 0.11 | 0.14 | 0.07 | 0.08 | −0.59 | −0.62 | −0.68 | 0.05 | 0.20 | −0.72 |
| 5 | −0.08 | 0.23 | 0.16 | 0.12 | 0.03 | 0.07 | 0.09 | 0.10 | −0.03 | −0.09 | −0.02 | −0.27 |
| 6 | 0.04 | 0.10 | 0.03 | 0.03 | 0.03 | 0.03 | 0.04 | −0.18 | 0.02 | −0.14 | −0.12 | −0.06 |
| 7 | −0.02 | 0.06 | 0.05 | 0.05 | 0.05 | 0.05 | −0.08 | 0.02 | 0.04 | −0.11 | −0.21 | 0.05 |
| 8 | 0.05 | −0.07 | 0.16 | 0.20 | 0.15 | 0.14 | 0.01 | −0.11 | −0.05 | −0.05 | −0.04 | 0.10 |
| 9 | 0.04 | 0.05 | 0.22 | 0.07 | 0.00 | 0.05 | −0.23 | −0.01 | −0.01 | −0.05 | −0.16 | −0.20 |
| 10 | 0.03 | 0.10 | 0.19 | 0.21 | −0.05 | −0.07 | 0.15 | −0.24 | 0.06 | −0.07 | 0.01 | 0.05 |
| 11 | −0.06 | 0.11 | 0.06 | 0.02 | 0.01 | −0.02 | 0.14 | 0.12 | 0.10 | 0.09 | −0.12 | 0.06 |
| 12 | −0.02 | 0.03 | 0.17 | 0.18 | 0.00 | −0.03 | 0.25 | 0.01 | 0.00 | −0.04 | −0.09 | 0.17 |
| 13 | −0.12 | 0.04 | 0.03 | −0.11 | −0.26 | −0.20 | −0.18 | −0.09 | −0.82 | −0.20 | −0.27 | −1.08 |
| 14 | 0.10 | −0.04 | 0.14 | 0.17 | 0.01 | −0.02 | 0.08 | 0.02 | −0.65 | −0.16 | −0.05 | 0.11 |
| 15 | 0.25 | 0.04 | −0.03 | −0.05 | −0.04 | −0.05 | 0.19 | 0.13 | 0.16 | −0.15 | 0.01 | −0.08 |
| 16 | 0.04 | −0.22 | −0.08 | −0.11 | −0.06 | −0.02 | 0.17 | −0.03 | 0.02 | −0.09 | 0.00 | −0.05 |
| 17 | −0.18 | 0.06 | 0.08 | −0.01 | −0.07 | −0.10 | 0.18 | 0.29 | −0.04 | 0.12 | 0.18 | 0.16 |
| 18 | 0.16 | 0.06 | −0.03 | −0.01 | 0.06 | 0.07 | −0.16 | 0.18 | −0.04 | 0.01 | 0.06 | 0.05 |
| 19 | −0.16 | −0.03 | −0.08 | −0.17 | −0.34 | −0.29 | 0.06 | 0.24 | 0.35 | 0.08 | 0.17 | 0.19 |
| 20 | −0.12 | −0.08 | −0.02 | 0.03 | −0.15 | −0.14 | 0.00 | 0.28 | 0.20 | 0.15 | 0.11 | 0.12 |
| 21 | −0.02 | −0.16 | −0.10 | −0.20 | −0.14 | −0.15 | −0.80 | −0.67 | −0.57 | 0.30 | 0.03 | −0.93 |
| 22 | −0.07 | 0.08 | −0.21 | −0.20 | −0.24 | −0.24 | −0.03 | 0.24 | −0.02 | 0.04 | 0.10 | 0.24 |
| X | −0.76 | −0.53 | −0.55 | −0.78 | −0.73 | −0.69 | −0.81 | −0.60 | −0.57 | −0.75 | −0.62 | −0.67 |
| Y | −0.05 | −0.09 | −0.05 | 0.05 | −0.07 | −0.14 | 1.31 | 1.48 | 1.58 | 1.57 | 1.03 | 1.25 |
| gDNA | XX | XX | XX | XX | XX | XX | XX | XX | XX | XX | XX | XX |
gDNA. sex chromosomes of the reference gDNA. Ratios exceeding the thresholds are shown in bold pinpointing potential trisomies and monosomies.
Table 5.
Summary of the FISH versus array CGH results on single blastomeres
| Stage | FISH results | Array CGH results | Interpretation | |
|---|---|---|---|---|
| Embryo 1 | 8 cells | −X (2) | 45,X (6) | Monosomy X embryo |
| Embryo 2 | 8 cells | +21,XY (2) | 40,XY,−1,−3,−4, −13,−14,−21 (1); 41,XY,−1,−3,−4, −13,−21 (1); 42,XY,−1,−3,−4, −21 (2); 47,XY,+1 (2) | Chaotic embryo |
The number of cells analysed and identified with the aberration is shown in parentheses.
Figure 4.

(A–D) Examples of single-cell array CGH profiles performed on blastomeres. For each, the x-axis represents the 22 autosomes, followed by the X and Y chromosomes. The y-axis marks the log2 mean ratios of all spots of each chromosome. The checked columns represent the abnormal chromosomes. Following ϕ29 DNA polymerase amplification, (A) one blastomere of embryo 1 was hybridized versus non-amplified female gDNA, (B and D) three blastomeres of embryo 2 versus non-amplified female gDNA. (E) Overview of single-cell experiments performed on embryo 2. The closed circles represent the mean intensity ratios of abnormal chromosomes identified. The x-axis represents the 22 autosomes, the X and Y chromosomes. The y-axis marks the log2 mean ratios of the 12 single-cell experiments of each chromosome. The grey columns represent the mean ratios of the 12 experiments of each chromosome plus or minus three times the standard deviation used for the chromosome-specific threshold.
By FISH, embryo 2 was diagnosed as trisomic for chromosome 21, while the other analysed chromosomes were normal (13, 14, 18, X and Y). In contrast to the FISH results, array CGH analysis of six individual blastomeres showed complex patterns of chromosomal imbalances in the different cells (Tables 4 and 5 and Figure 4B–E). Among these abnormalities, a monosomy 21 was observed in four blastomeres while two others were normal for chromosome 21.
Because of the discrepancy between FISH and array CGH results obtained on blastomeres from embryo 2, locus-specific PCR analyses were performed on amplified blastomere DNA. In case of monosomy, a single allele for all polymorphic markers of this chromosome has to be detected while, in case of disomy, two different alleles have to be detected. The amplified DNAs of 10 blastomeres were analysed using 5 microsatellite markers located across chromosome 21 (Table 6). These five markers were heterozygous in embryo 2. Two alleles for at least four out of the five markers were observed in each of the six amplified blastomeres disomic for chromosome 21 by array CGH. These findings were consistent with disomy 21 in these blastomeres. For the four blastomeres from embryo 2 identified as monosomic for chromosome 21 by array CGH, only a single allele was detected for all five markers. Considering the low allele drop-out rate (i.e. the failure of amplification of one allele) of each marker, this was consistent with the presence of monosomy 21 in these blastomeres and confirmed the array CGH results. Because of the limited availability of amplified DNA, the other chromosomal monosomies could not be further investigated.
Table 6.
Short Tandem Repeat (STR) analysis showing consistent results with the presence of monosomy 21 observed in the four blastomeres of embryo 2
| STR markera | Blastomeres interpreted as monosomic for chromosome 21 by array CGH (n = 4) | Blastomeresb interpreted as disomic for chromosome 21 by array CGH (n = 6) | |||
|---|---|---|---|---|---|
| Heterozygous | Hemizygous | No amplification | Heterozygous | Allele drop-out | |
| D21S1257 | 0 | 4 | 0 | 6 | 0 |
| D21S1259 | 0 | 4 | 0 | 5 | 1 |
| D21S1904 | 0 | 4 | 0 | 5 | 1 |
| D21S1256 | 0 | 4 | 0 | 4 | 2 |
| D21S1260 | 0 | 2 | 2 | 4 | 2 |
aSTR analysis of two blastomeres of embryo 2 (interpreted as disomic for chromosome 21 by array CGH) demonstrated informativity for all five markers for this embryo.
bTwo from embryo 2 and four blastomeres from an additional embryo.
DISCUSSION
We have demonstrated the feasibility of performing single-cell aneuploidy screening by array CGH following MDA. Both sex chromosome and autosomal aneuploidies were accurately detected in different human cell types using a rapid array CGH protocol. In addition to be able to detect whole-chromosome copy-number changes, the method was equally capable of detecting segmental deletions/duplications. The ability to detect a segmental deletion/duplication is related to the standard deviation of the signal intensity ratios, to the size of the duplicated or deleted chromosomal region, and to the statistical significance the experiment needs (Supplementary Data). At a significance level of 95% and an average standard deviation of our single-cell array CGH experiments of 0.8, we can establish that the intensity ratio changes in 60 clones will be detected without a priori knowledge which imbalances might be expected. A number of different methods allowing the detection of segmental deletion/duplication have been described elsewhere (20). However, with a priori knowledge about the expected imbalance, even smaller deleted and duplicated fragments can be reliably detected. Here, we demonstrated the accurate detection of the del(4q) and the unbalanced translocation t(X;14) with deletion sizes of 34 and 58 Mb, respectively and a duplication of 47 Mb. Often, such a priori knowledge is available. For example, PGD can be offered to couples where one of the partners is carrier of a balanced translocation. In these instances, the size of the unbalanced meiotic products are known in advance and will be detected by this method. Array CGH to detect such imbalances would thus provide a universal platform, whereas different FISH probes have to be optimized for each translocation. This can be especially labour intensive for complex translocations (21). Theoretically, chromosome tiling path arrays containing one clone every 100 kb will detect genomic imbalances as small as 6 Mb in size. Improvements in the amplification and array CGH procedure are likely to further increase the resolution of the technology.
For metaphase CGH, as well as for array CGH, several statistical methods have been proposed for the objective interpretation of CGH profiles, but none of them were completely satisfactory (22–24). In the present study, three times the standard deviation of the averaged chromosomal intensity ratio was used as a cut-off and, as a consequence, theoretically 0.3% false positives were expected. Experimentally, we observed no false positives analysing 423 chromosomes (i.e. 24 chromosomes in 18 single-cell experiments after removing 9 chromosomes containing a segmental deletion/duplication) (0/423 = 0%; 95% CI 0–0.7%). From this, it is clear that <0.7% false positive will occur per chromosome. Analysis of more cells may further reduce this maximum value and the theoretical value of 0.3% per analysed chromosome could be approached.
A number of studies showed that normal developing embryos exhibit a high number of numerical aberrations and a high degree of mosaicism at the 8-cell stage (13,25–30). Some of them appear to be karyotypically ‘chaotic’ with almost every cell having a different chromosome abnormality (28). About 20% of the embryos with bad morphology are ‘chaotic’ (31). The patient-related occurrence of chaotically dividing embryos has been observed, i.e. some patients had ‘chaotic’ embryos in repeated cycles, whereas other patients were completely free of this type of anomaly (18,28,30,32). In this study, array CGH analysis of six individual blastomeres of embryo 2 showed complex patterns of chromosomal imbalances in the different cells, leading to the diagnosis of ‘chaotic’ embryo. Five other embryos from this couple were also diagnosed as ‘chaotic’ by FISH. Therefore, the array CGH results of embryo 2 were not surprising.
The ability to detect chromosomal imbalances in a single cell will have several applications. Here, we applied single-cell aneuploidy screening for the detection of chromosomal imbalances in preimplantation embryos. From the analysis of two different embryos, we showed that chromosomal aneuploidies can be detected in single blastomeres. These findings open the route towards PGD for aneuploidy screening (PGS) in a clinical setting. In contrast to metaphase CGH, our approach can detect aneuploidies in blastomeres within a single day and is amenable to automatic processing and data interpretation. The advantage of array CGH over FISH is that the copy number of all chromosomes can be determined. It was hypothesized that PGS would enable selection of chromosomally normal embryos and hence, would improve the implantation rate (1). Current retrospective and prospective studies (13,33) to test this hypothesis have been hampered by the limited number of chromosomes (5–9) that could be analysed by FISH and therefore, current data are only partial. Interestingly, in one of the two embryos, we identified chromosomal imbalances not detected by the standard FISH analysis for PGD, suggesting the need for full genome aneuploidy screening to test whether embryo selection enhances implantation rates. Moreover, we have shown that array CGH can also be used in PGD for chromosomal aberrations, such as reciprocal or Robertsonian translocations, thus obviating the often time consuming optimization of specific FISH probes.
In conclusion, we have optimized array CGH to detect chromosome copy-number changes in single cells and demonstrate its applicability in PGD. The method is likely to open up novel diagnostic opportunities, such as the analysis of cancer or fetal cells circulating in the peripheral blood or the analysis of a small number of microdissected tumor cells. Moreover, single-cell genomic analysis will provide new insights to discern the molecular changes that underlie cancer progression and invasiveness (34).
SUPPLEMENTARY DATA
Supplementary Data are available at NAR Online.
Acknowledgments
We would like to thank the microarray facility, Flanders Interuniversity Institute for Biotechnology (VIB) for their help in the spotting of the arrays and the Mapping Core and Map Finishing groups of the Wellcome Trust Sanger Institute for initial clone supply and verification. We are also grateful to the families who participated in this study. We would like to thank An Michiels for providing us with the surplus IVF embryos and Guy Froyen for critical reading of the manuscript. This work was made possible by grants from the FWO G.0131.02 from the University of Brussels to I.L. and the OT /02/40 from the University of Leuven to J.R.V. C.L.C. was supported by the University Hospital of Nantes, France and the Ministère des Affaires Etrangères from France (Lavoisier grant 2004/05). The work of Y.M. is supported by the EU (NoE Biopattern, Marie Curie EST Bioptrain), Belgian government (IAP V-22), Flemish government (FWO G0388.03), K.U.Leuven (GOA-Ambiorics, CoE SymBioSys). Funding to pay the Open Access publication charges for this article was provided by grant from the FWO G.0131.02
Conflict of interest statement. None declared.
REFERENCES
- 1.Wilton, L. 2002. Preimplantation genetic diagnosis for aneuploidy screening in early human embryos: a review Prenat. Diagn. 22312–318 [DOI] [PubMed] [Google Scholar]
- 2.Sermon, K., Van Steirteghem, A., Liebaers, I. 2004. Preimplantation genetic diagnosis Lancet 3631633–1641 [DOI] [PubMed] [Google Scholar]
- 3.Wilton, L. 2005. Preimplantation genetic diagnosis and chromosome analysis of blastomeres using comparative genomic hybridization Hum. Reprod. Update 1133–41 [DOI] [PubMed] [Google Scholar]
- 4.Klein, C.A., Schmidt-Kittler, O., Schardt, J.A., Pantel, K., Speicher, M.R., Riethmuller, G. 1999. Comparative genomic hybridization, loss of heterozygosity, and DNA sequence analysis of single cells Proc. Natl Acad. Sci. USA 964494–9 [DOI] [PMC free article] [PubMed] [Google Scholar]
- 5.Solinas-Toldo, S., Lampel, S., Stilgenbauer, S., Nickolenko, J., Benner, A., Dohner, H., Cremer, T., Lichter, P. 1997. Matrix-based comparative genomic hybridization: biochips to screen for genomic imbalances Genes Chromosomes Cancer 20399–407 [PubMed] [Google Scholar]
- 6.Pinkel, D., Segraves, R., Sudar, D., Clark, S., Poole, I., Kowbel, D., Collins, C., Kuo, W.L., Chen, C., Zhai, Y., et al. 1998. High resolution analysis of DNA copy number variation using comparative genomic hybridization to microarrays Nature Genet. 20207–211 [DOI] [PubMed] [Google Scholar]
- 7.Guillaud-Bataille, M., Valent, A., Soularue, P., Perot, C., Inda, M.M., Receveur, A., Smaili, S., Crollius, H.R., Benard, J., Bernheim, A., et al. 2004. Detecting single DNA copy number variations in complex genomes using one nanogram of starting DNA and BAC-array CGH Nucleic Acids Res. 32e112. [DOI] [PMC free article] [PubMed] [Google Scholar]
- 8.Hu, D.G., Webb, G., Hussey, N. 2004. Aneuploidy detection in single cells using DNA array-based comparative genomic hybridization Mol. Hum. Reprod. 10283–289 [DOI] [PubMed] [Google Scholar]
- 9.Lizardi, P.M., Huang, X., Zhu, Z., Bray-Ward, P., Thomas, D.C., Ward, D.C. 1998. Mutation detection and single-molecule counting using isothermal rolling-circle amplification Nature Genet. 19225–232 [DOI] [PubMed] [Google Scholar]
- 10.Dean, F.B., Hosono, S., Fang, L., Wu, X., Faruqi, A.F., Bray-Ward, P., Sun, Z., Zong, Q., Du, Y., Du, J., et al. 2002. Comprehensive human genome amplification using multiple displacement amplification Proc. Natl Acad. Sci. USA 995261–5266 [DOI] [PMC free article] [PubMed] [Google Scholar]
- 11.Lage, J.M., Leamon, J.H., Pejovic, T., Hamann, S., Lacey, M., Dillon, D., Segraves, R., Vossbrinck, B., Gonzalez, A., Pinkel, D., et al. 2003. Whole genome analysis of genetic alterations in small DNA samples using hyperbranched strand displacement amplification and array-CGH Genome Res. 13294–307 [DOI] [PMC free article] [PubMed] [Google Scholar]
- 12.Hellani, A., Coskun, S., Benkhalifa, M., Tbakhi, A., Sakati, N., Al-Odaib, A., Ozand, P. 2004. Multiple displacement amplification on single cell and possible PGD applications Mol. Hum. Reprod. 10847–852 [DOI] [PubMed] [Google Scholar]
- 13.Staessen, C., Platteau, P., Van Assche, E., Michiels, A., Tournaye, H., Camus, M., Devroey, P., Liebaers, I., Van Steirteghem, A. 2004. Comparison of blastocyst transfer with or without preimplantation genetic diagnosis for aneuploidy screening in couples with advanced maternal age: a prospective randomized controlled trial Hum. Reprod. 192849–2858 [DOI] [PubMed] [Google Scholar]
- 14.Fiegler, H., Carr, P., Douglas, E.J., Burford, D.C., Hunt, S., Scott, C.E., Smith, J., Vetrie, D., Gorman, P., Tomlinson, I.P., et al. 2003. DNA microarrays for comparative genomic hybridization based on DOP-PCR amplification of BAC and PAC clones Genes Chromosomes Cancer 36361–374 [DOI] [PubMed] [Google Scholar]
- 15.Vermeesch, J.R., Melotte, C., Froyen, G., Van Vooren, S., Dutta, B., Maas, N., Vermeulen, S., Menten, B., Speleman, F., De Moor, B., et al. 2005. Molecular karyotyping: array CGH quality criteria for constitutional genetic diagnosis J. Histochem. Cytochem. 53413–422 [DOI] [PubMed] [Google Scholar]
- 16.Spits, C., Le Caignec, C., De Rycke, M., Van Haute, L., Van Steirteghem, A., Liebaers, I., Sermon, K. 2006. Optimisation and evaluation of single-cell whole genome multiple displacement amplification Human Mutat. 27496–502 [DOI] [PubMed] [Google Scholar]
- 17.Voullaire, L., Slater, H., Williamson, R., Wilton, L. 2000. Chromosome analysis of blastomeres from human embryos by using comparative genomic hybridization Hum. Genet. 106210–217 [DOI] [PubMed] [Google Scholar]
- 18.Voullaire, L., Wilton, L., McBain, J., Callaghan, T., Williamson, R. 2002. Chromosome abnormalities identified by comparative genomic hybridization in embryos from women with repeated implantation failure Mol. Hum. Reprod. 81035–1041 [DOI] [PubMed] [Google Scholar]
- 19.Gutierrez-Mateo, C., Wells, D., Benet, J., Sanchez-Garcia, J.F., Bermudez, M.G., Belil, I., Egozcue, J., Munne, S., Navarro, J. 2004. Reliability of comparative genomic hybridization to detect chromosome abnormalities in first polar bodies and metaphase II oocytes Hum. Reprod. 192118–2125 [DOI] [PubMed] [Google Scholar]
- 20.Lai, W.R., Johnson, M.D., Kucherlapati, R., Park, P.J. 2005. Comparative analysis of algorithms for identifying amplifications and deletions in array CGH data Bioinformatics 213763–3770 [DOI] [PMC free article] [PubMed] [Google Scholar]
- 21.Melotte, C., Debrock, S., D'Hooghe, T., Fryns, J.P., Vermeesch, J.R. 2004. Preimplantation genetic diagnosis for an insertional translocation carrier Hum. Reprod. 192777–2783 [DOI] [PubMed] [Google Scholar]
- 22.du Manoir, S., Schrock, E., Bentz, M., Speicher, M.R., Joos, S., Ried, T., Lichter, P., Cremer, T. 1995. Quantitative analysis of comparative genomic hybridization Cytometry 1927–41 [DOI] [PubMed] [Google Scholar]
- 23.Moore, D.H., 2nd, Pallavicini, M., Cher, M.L., Gray, J.W. 1997. A t-statistic for objective interpretation of comparative genomic hybridization (CGH) profiles Cytometry 28183–190 [DOI] [PubMed] [Google Scholar]
- 24.Kirchhoff, M., Gerdes, T., Rose, H., Maahr, J., Ottesen, A.M., Lundsteen, C. 1998. Detection of chromosomal gains and losses in comparative genomic hybridization analysis based on standard reference intervals Cytometry 31163–173 [PubMed] [Google Scholar]
- 25.Munne, S., Weier, H.U., Grifo, J., Cohen, J. 1994. Chromosome mosaicism in human embryos Biol. Reprod. 51373–379 [DOI] [PubMed] [Google Scholar]
- 26.Munne, S., Alikani, M., Tomkin, G., Grifo, J., Cohen, J. 1995. Embryo morphology, developmental rates, and maternal age are correlated with chromosome abnormalities Fertil. Steril. 64382–391 [PubMed] [Google Scholar]
- 27.Harper, J.C., Coonen, E., Handyside, A.H., Winston, R.M., Hopman, A.H., Delhanty, J.D. 1995. Mosaicism of autosomes and sex chromosomes in morphologically normal, monospermic preimplantation human embryos Prenat. Diagn. 1541–49 [DOI] [PubMed] [Google Scholar]
- 28.Delhanty, J.D., Harper, J.C., Ao, A., Handyside, A.H., Winston, R.M. 1997. Multicolour FISH detects frequent chromosomal mosaicism and chaotic division in normal preimplantation embryos from fertile patients Hum. Genet. 99755–760 [DOI] [PubMed] [Google Scholar]
- 29.Iwarsson, E., Lundqvist, M., Inzunza, J., Ahrlund-Richter, L., Sjoblom, P., Lundkvist, O., Simberg, N., Nordenskjold, M., Blennow, E. 1999. A high degree of aneuploidy in frozen-thawed human preimplantation embryos Hum. Genet. 104376–82 [DOI] [PubMed] [Google Scholar]
- 30.Baart, E.B., Martini, E., van den Berg, I., Macklon, N.S., Galjaard, R.J., Fauser, B.C., Van Opstal, D. 2006. Preimplantation genetic screening reveals a high incidence of aneuploidy and mosaicism in embryos from young women undergoing IVF Hum. Reprod. 21223–233 [DOI] [PubMed] [Google Scholar]
- 31.Munne, S., Sandalinas, M., Escudero, T., Marquez, C., Cohen, J. 2002. Chromosome mosaicism in cleavage-stage human embryos: evidence of a maternal age effect Reprod. Biomed. Online 4223–32 [DOI] [PubMed] [Google Scholar]
- 32.Malmgren, H., Sahlen, S., Inzunza, J., Aho, M., Rosenlund, B., Fridstrom, M., Hovatta, O., Ahrlund-Richter, L., Nordenskjold, M., Blennow, E. 2002. Single cell CGH analysis reveals a high degree of mosaicism in human embryos from patients with balanced structural chromosome aberrations Mol. Hum. Reprod. 8502–510 [DOI] [PubMed] [Google Scholar]
- 33.Gianaroli, L., Magli, M.C., Ferraretti, A.P., Munne, S. 1999. Preimplantation diagnosis for aneuploidies in patients undergoing in vitro fertilization with a poor prognosis: identification of the categories for which it should be proposed Fertil. Steril. 72837–844 [DOI] [PubMed] [Google Scholar]
- 34.Speicher, M.R. and Carter, N.P. 2005. The new cytogenetics: blurring the boundaries with molecular biology Nature Rev. Genet. 6782–792 [DOI] [PubMed] [Google Scholar]
Associated Data
This section collects any data citations, data availability statements, or supplementary materials included in this article.