Abstract
Surface-enhanced Raman scattering using silver nanoparticles was applied to detect various forms of lysophosphatidic acid (LPA) to examine its potential application as an alternative to current detection methods of LPA as biomarkers of ovarian cancer. Enhancement of the Raman modes of the molecule, especially those related to the acyl chain within the 800–1300 cm−1 region, was observed. In particular, the C–C vibration mode of the gauche-bonded chain around 1100 cm−1 was enhanced to allow the discrimination of two similar LPA molecules. Given the molecular selectivity of this technique, the detection of LPA using SERS may eliminate the need for partial purification of samples prior to analysis in cancer screening.
Keywords: Surface-enhanced Raman scattering, Lysophosphatidic acid
Introduction
Lysophosphatidic acid (LPA), originally known for its role as an intermediate in intracellular lipid metabolism, has now been recognized as an important multifunctional biological mediator that can elicit cellular responses such as the release of arachidonic acid, inducing the formation of stress fibers, and inducing monocyte migration [1–4]. The involvement of LPA in inducing cell proliferation, migration and survival implicates it in the initiation and progression of malignant disease, and it has been proposed as a sensitive biomarker for ovarian cancer due to its presence in higher concentrations among ovarian cancer patients [5–8].
Typically, the detection of LPA has been conducted using chromatography and mass spectroscopy assays that require a partial purification of the samples using thin layer chromatography (TLC) prior to analysis [5, 8]. Although this method is effective, an underestimation of LPA levels can result during the recovery process due in part to the varying mobility of the LPA salts (free acid, sodium and calcium salts) when subjected to chromatography by TLC.
A powerful optical detection technique based on surface-enhanced Raman scattering (SERS) offers a unique combination of high sensitivity and molecular specificity. In Raman spectroscopy, the vibrational frequencies of a molecule are probed by measuring the energy shifts in the scattered light relative to an excitation light. This technique provides a fingerprinting method to uniquely identify a particular molecule. However, given the rare occurrence of Raman scattering by a molecule (~1×10⁻⁷), its application in detection methods is inhibited. With SERS, the Raman signal of a molecule is increased by many orders of magnitude as a result of strong enhancement of the excitation light through the resonance of the metal’s surface electrons, called the surface plasmon [9–11]. SERS has been successfully used in the detection and analysis of a large number of chemicals and biological molecules [12–16].
In this communication, we report for the first time (to our knowledge) the application of SERS using silver nanoparticles as a potential alternative technique for detecting LPA with high sensitivity and molecular specificity. Experimental results obtained for 16:0 LPA and 18:0 LPA successfully demonstrate not only that SERS of LPA can be measured but also that the SERS spectra of the two very similar LPA molecules are shifted enough in the 1100 cm−1 region to uniquely identify them. This is important for distinguishing one type of LPA cancer biomarker from another or LPA molecules that are not biomarkers. The results suggest the strong potential for practical LPA detection using SERS-based techniques that may eliminate the need for sample purification prior to analysis.
Experimental
Powder samples of 16:0 LPA (1-palmitoyl-2-hydroxy-sn-glycero-3-phosphate(sodium salt)) and 18:0 LPA (1-stea-royl-2-hydroxy-sn-glycero-3-phosphate(sodium salt)) were purchased from Avanti Polar Lipids, Inc (Alabaster, AL, USA). Silver nitrate and sodium citrate were purchased from Sigma Aldrich (St. Louis, MO, USA). Raman spectra were obtained using a Renishaw (Wotton-under-Edge, Gloucestershire, UK) micro-Raman setup with a 50× objective lens and 780 nm excitation laser at 3 mW with a spot size of approximately 5 μm.
Silver nanoparticles were prepared using a synthesis from Lee and Meisel using silver nitrate as the metal precursor and a sodium citrate reducing agent [17]. Formation of the silver nanoparticles was monitored by UV-vis spectroscopy using a HP 8452A spectrometer with 2 nm resolution. With a particle radius estimated at 50 nm based on TEM measurements, the concentration of the solution used was calculated to be 3×10⁻¹¹ M. One mL of the solution was centrifuged and 900 μL of the supernatant was removed to increase the nanoparticle concentration by a factor of ten prior to application. For the SERS experiment, 2 μL drops of the concentrated silver nanoparticles were placed on a glass slide and allowed to dry forming a spot of approximately 1 cm in diameter. Its Raman signal was obtained with one accumulation of a 30 second scan to serve as a background. After the silver has dried, 4 μL of a 100 μM solution of either the 16:0 LPA or 18:0 LPA (dissolved in Milli-Q water) was added on top of the silver to dry. The 4 μL volume ensured the complete coverage of the silver that had dried on the glass. The Raman signal was then collected using the same scan parameters. For comparison, Raman signals of the crystalline LPA samples were collected with five accumulations of a two minute scan.
Results and discussion
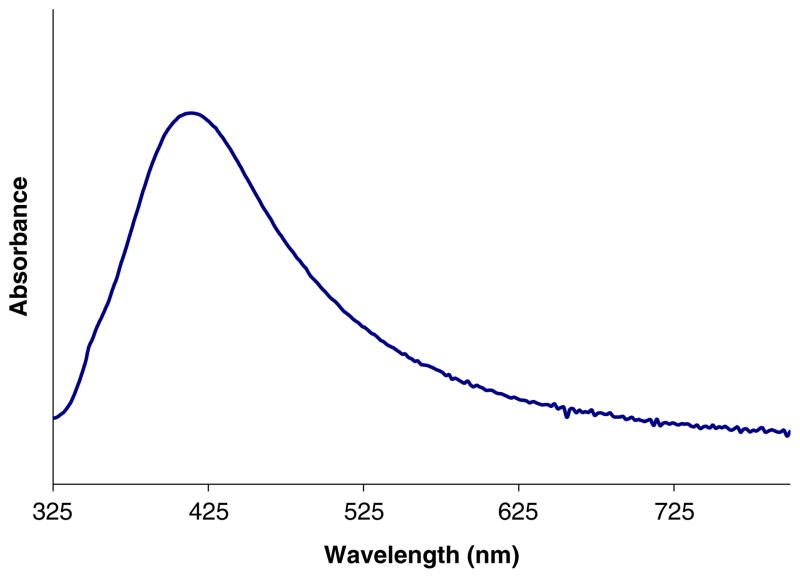
The primary goal of this work was to demonstrate the ability of SERS to be selective, reproducible, and sensitive in detecting 16:0 LPA versus 18:0 LPA and show its potential as a viable alternative to current detection methods. Figure 1 presents the UV-vis absorption spectrum of the silver nanoparticles used in this experiment. The major absorption peak near 420 nm is the well-known surface plasmon band [18]. However, it is the very weak absorption around 780 nm, possibly due to some nanoparticle aggregation, that is essential for SERS to work effectively with incident laser light at 780 nm [16]. Resonance absorption of the metal nanoparticle substrate with the incident wavelength and the generation of the resulting electromagnetic field from the particles are essential for SERS [16]. Although only a weak absorption near 780 nm is observed, SERS is still demonstrated to work effectively. This suggests that either the nanoparticles/aggregates absorbing at 780 nm are strongly SERS active due to their favorable surface chemistry or that the nanoparticles have further aggregated upon concentrating and drying for the SERS experiment, which may have caused a red-shift of the absorption band and increased absorption at 780 nm similar to what has been observed for gold nanoparticles [19]. The spectrum in Fig. 1 is for a nanoparticle solution. It has been challenging to measure the UV-vis spectrum of a dried nanoparticle film.
Fig. 1.
Representative UV-vis absorption spectrum of 3×10⁻¹¹ M silver nanoparticles. The weak absorption towards the 780 nm region is believed to be sufficient for SERS to occur. However, the absorption at 780 nm may be stronger for the dried film due to aggregation of nanoparticles used for the SERS experiment
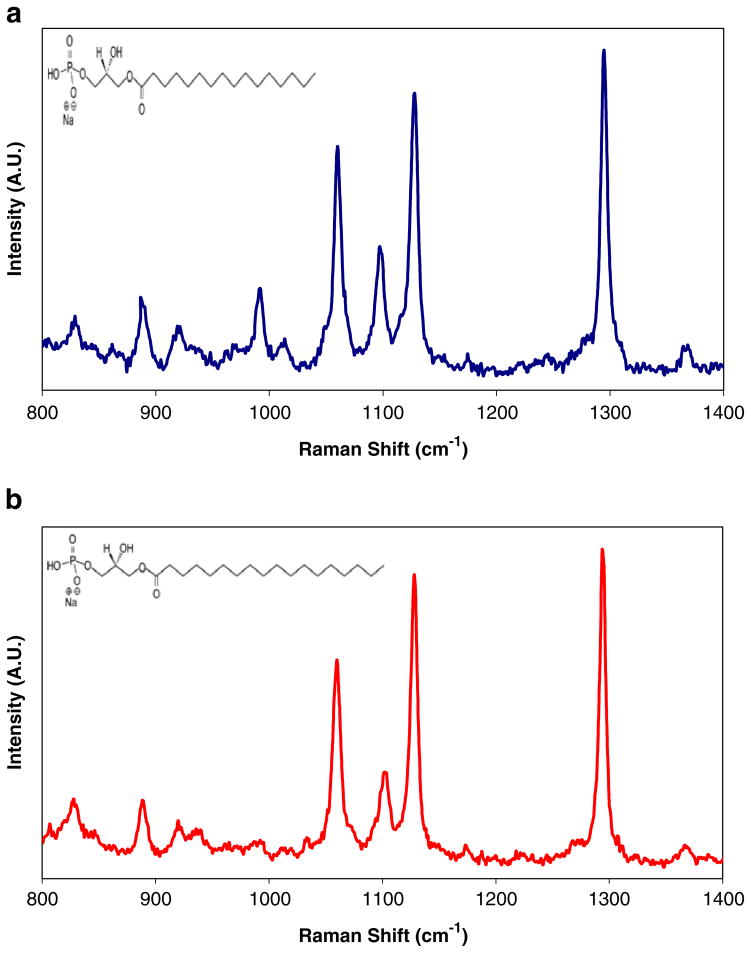
The Raman spectra and molecular structures of the bulk crystal of 16:0 LPA and 18:0 LPA are presented in Fig. 2a and b, respectively. With the only difference between the two LPAs being the lengths of their acyl chains, the ability to apply SERS for detection applications depends on its capacity to detect the acyl peaks. Hence, experimental measurements were performed between 800–1400 cm−1 where many of the acyl peaks occur. The vibrational modes were assigned based on characteristic Raman frequencies [20]. The band at 889 cm−1 is representative of methylene rocking, and the 1294 cm−1 band is typical of methylene twisting. The C–C skeletal stretching vibrations appear between 1060–1130 cm−1. In this region, information about the conformation of the carbon chain can also be obtained. The bands observed around 1060 cm−1 and 1130 cm−1 are characteristic of trans-bonded carbon and the band observed around 1100 cm−1 denotes the vibration of a gauche-bonded chain. The analysis of the spectra obtained for these LPA samples compared well to Raman spectra of various lipids that have been previously analyzed [21–24]. Very strong similarities between the spectra of these two LPA molecules are noted, in particular the 889 cm−1, 1294 cm−1, 1060 cm−1, and 1128 cm−1 bands that they commonly share. Fortunately, the 16:0 LPA is distinguishable from the 18:0 LPA by the shift of the C–C vibration of the gauche-bonded chain from 1097 cm−1 for 16:0 LPA to 1101 cm−1 for 18:0 LPA.
Fig. 2.
Raman spectrum of bulk lysophosphatidic acid crystals (780 nm excitation, 3 mW power, 5 μm spot size): a 16:0 LPA; b 18:0 LPA
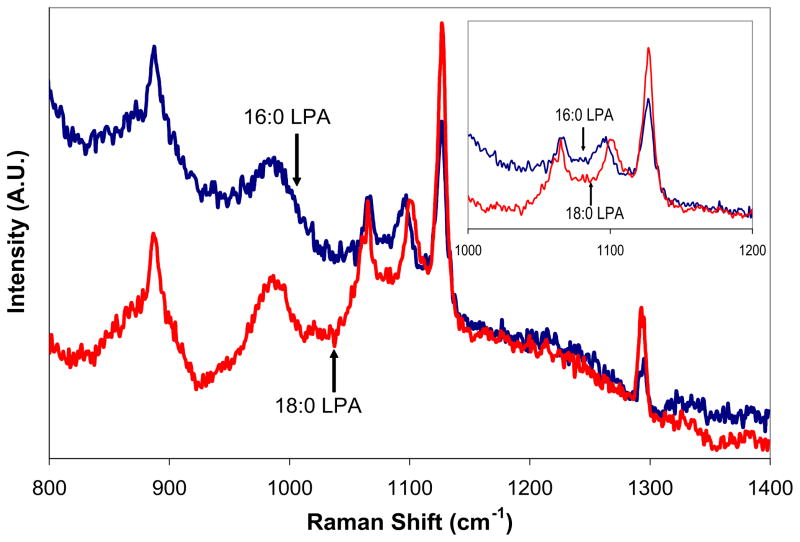
Figure 3 presents the SERS spectra of the two LPA samples that were dried on the silver nanoparticles after subtracting the background signal of the dried nanoparticle solution. Attempts to obtain the Raman spectra of dried samples of LPA solutions without any silver present resulted in no observable signal, indicating that the presence of the silver enhanced the LPA Raman signal and made the detection of low molecular quantities possible. Based on the assumption that the distribution of both the silver nanoparticles and LPA are uniform upon drying the samples, it is estimated that the SERS observed was for approximately 4×10⁻¹⁰ moles of LPA on the 5 μm laser spot. As expected, the bands of the acyl chain are enhanced using this technique with little or no shift from their bulk Raman positions. The SER signal of the 16:0 LPA maintained its peaks at 889 cm−1, 1097 cm−1, 1128 cm−1, and 1294 cm−1, while 18:0 LPA maintained its peaks at 889 cm−1, 1101 cm−1, 1128 cm−1, and 1294 cm−1. From the inset showing the region between 1000–1200 cm−1, the ability of this procedure to detect the gauche peak that allows the acyl chains of the LPA samples to be distinguished from each other is clearly observed.
Fig. 3.
SERS spectra of dried samples from solutions of 100 μM 16:0 LPA and 18:0 LPA on silver nanoparticles (780 nm excitation, 3 mW power, 5 μm spot size). Inset shows the SERS region between 1000–1200 cm−1 for the same samples, showing the distinguishable mode at 1097 cm−1 and 1101 cm−1
In SERS, the enhancement of a given mode implies the preferred orientation of the adsorbate to the surface of the metal. Typically, enhancement of a given mode is best when it is close and normal to the surface. Comparing the band intensities of the SER spectrum of either LPA sample to its respective bulk spectrum shows that the two are quite similar (see Table 1). For example, the intensity distribution of the SER modes of 16:0 LPA exhibits a similar pattern for its bulk spectrum. The same pattern is observed for the 18:0 samples. This leads to the conclusion that no strong interaction is occurring between the nanoparticle surface and functional groups on the molecule to promote a specific orientation of the adsorbate. Had there been a strong interaction between the nanoparticle substrate and the molecular adsorbate, one molecular orientation would dominate and this would result in some vibrational modes being enhanced more than others. Also, with any strong surface interaction between the adsorbate and metal present, one may find a shift in some bands of the SERS spectrum compared to the bulk Raman spectrum due to vibrational hindrance and altered selection rules that would result from the adsorbate-metal surface interaction [25]. This phenomenon was not observed in the LPA SERS spectra. The conclusion that no strong interaction is present between the metal surface and the adsorbate can also be derived from the fact that no immediate SERS is observed for mixed solutions of silver and LPA. The interaction between LPA and the nanoparticle surface is only strong enough for SERS to be observed when the molecule is dried on top of the silver.
Table 1.
Comparison of the intensities of the assigned vibrational modes of the Raman spectra of the bulk samples of LPA with its SER signals (W=weak, M=medium, S=strong, VS=very strong)
| Mode (cm−1) | Assignment | 16:0 LPA | 16:0 SERS | 18:0 LPA | 18:0 SERS |
|---|---|---|---|---|---|
| 889 | CH2 rock | M | M | M | M |
| 1060 | C–C vib (trans) | S | - | S | - |
| 1097 or 1101 | C–C vib (gauche) | M | M | M | M |
| 1128 | C–C vib (trans) | S | S | VS | VS |
| 1294 | CH2 (twist) | S | W | VS | M |
Currently, work is being conducted to improve the sensitivity of this technique in terms of its ability to detect lower quantities of various LPA in mixed samples along with actual samples of plasma/blood where other lysophospholipids besides LPA are present. Some preliminary experiments using a prepared sample of mixed 16:0 and 18:0 LPA solutions has shown that this technique is able to distinguish the two different LPA molecules from each other by drying millimolar concentration solutions. However, in order to apply SERS to practical LPA detection, this technique must be able to detect LPA starting with solutions of micromolar quantities. As the surface interactions between the molecule and the nanoparticles play an important role in the effective enhancement of this technique, experiments are currently being conducted with other metal nanoparticles capped with various surface agents that may induce stronger interactions between the acyl chain of the adsorbate and the metal. We also plan to apply SERS detection of LPA using differently shaped metal nanoparticles, as rough nonspherical particles may show stronger SERS activities than spherical particles [26].
Conclusion
This work successfully demonstrates that surface-enhanced Raman scattering based on silver nanoparticles can be used to detect LPA molecules present at levels as low as 4×10⁻¹⁰ moles. The detection of the scattered light that results from vibrational modes of the different acyl chains on the molecules shows the potential of SERS to selectively detect one form of this cancer biomarker from another. However, without the observation of a more dramatic enhancement for particular vibrational modes, one must conclude that a weak metal-adsorbate interaction is present, resulting in a random orientation of the molecule to the nanoparticle surface and yielding a SER spectrum that looks very similar to the normal Raman spectrum of the bulk sample. Based on these encouraging preliminary studies, additional work is underway to further explore the use of SERS for biomedical applications. Current work is focused on improving the surface interaction between the adsorbate and metal to enhance the sensitivity and the selectivity of this technique.
Acknowledgments
This work was supported by the National Science Foundation, the Petroleum Research Fund administered by the American Chemical Society, and the UCSC Special Faculty Research Fund. This work was also supported by American Cancer Society Clinical Research Training Grant CRTG-00-196-01-CCE (RS).
Contributor Information
Leo Seballos, Department of Chemistry and Biochemistry, University of California, Santa Cruz, CA 95064, USA.
Jin Z. Zhang, Email: zhang@chemistry.ucsc.edu, Department of Chemistry and Biochemistry, University of California, Santa Cruz, CA 95064, USA, Tel.: +1-831-4593776, Fax: +1-831-4592935
Rebecca Sutphen, Department of Interdisciplinary Oncology, College of Medicine and H. Lee Moffitt Cancer Center and Research Institute, University of South Florida, Tampa, FL 33612, USA.
References
- 1.Tigyi G, Dyer DL, Miledi R. P Natl Acad Sci (USA) 1994;91:1908–1912. doi: 10.1073/pnas.91.5.1908. [DOI] [PMC free article] [PubMed] [Google Scholar]
- 2.van Corven EJ, Groenink A, Jalink K, Eichholtz T, Moolenaar WH. Cell. 1989;59:45–54. doi: 10.1016/0092-8674(89)90868-4. [DOI] [PubMed] [Google Scholar]
- 3.Ridley AJ, Hall A. Cell. 1992;70:389–399. doi: 10.1016/0092-8674(92)90163-7. [DOI] [PubMed] [Google Scholar]
- 4.Zhou D, Luini W, Bernasconi S, Diomede L, Salmona M, Mantovani A, Sozzani S. J Biol Chem. 1995;270:25549–25556. doi: 10.1074/jbc.270.43.25549. [DOI] [PubMed] [Google Scholar]
- 5.Xu Y, Shen Z, Wiper DW, Wu M, Morton RE, Elson P, Kennedy AW, Belinson J, Markman M, Casey G. JAMA. 1998;280:719–723. doi: 10.1001/jama.280.8.719. [DOI] [PubMed] [Google Scholar]
- 6.Mills GB, Moolenaar WH. Nat Rev Cancer. 2003;3:582–591. doi: 10.1038/nrc1143. [DOI] [PubMed] [Google Scholar]
- 7.Fang X, Yu S, Bast RC, Liu S, Xu H, Hu S, LaPushin R, Claret FX, Aggarwal BB, Lu Y, Mills GB. J Biol Chem. 2004;279:9653–9661. doi: 10.1074/jbc.M306662200. [DOI] [PubMed] [Google Scholar]
- 8.Sutphen R, Xu Y, Wilbanks GD, Fiorica J, Grendys EC, Jr, LaPolla JP, Arango H, Hoffman MS, Martino M, Wakeley K, Griffin D, Blanco RW, Cantor AB, Xiao Y, Krischer JP. Cancer Epidemiol Biomark Prev. 2004;13:1185–1191. [PubMed] [Google Scholar]
- 9.Moskovitz M. Rev Mod Phys. 1985;57:783–828. [Google Scholar]
- 10.Otto A, Mrozek I, Grabhorn H, Akemann W. J Phys Condens Matter. 1992;4:1143–1212. [Google Scholar]
- 11.Campion A, Kambhampati P. Chem Soc Rev. 1998;27:241–250. [Google Scholar]
- 12.Albrecht MG, Creighton JA. J Am Chem Soc. 1977;99:5215–5217. [Google Scholar]
- 13.Nie S, Emory SR. Science. 1997;275:1102–1106. doi: 10.1126/science.275.5303.1102. [DOI] [PubMed] [Google Scholar]
- 14.Keating CD, Kovaleski KK, Natan MJ. J Phys Chem B. 1998;102:9414–9425. [Google Scholar]
- 15.Kneipp K, Kneipp H, Kartha VB, Manoharan R, Deinum G, Itzkan I, Dasari RR, Feld MS. Phys Rev E. 1998;57:R6281–R6284. [Google Scholar]
- 16.Schwartzberg AM, Grant CD, Wolcott A, Talley CE, Huser TR, Bogomolni R, Zhang JZ. J Phys Chem B. 2004;108:19191–19197. [Google Scholar]
- 17.Lee PC, Meisel D. J Phys Chem. 1982;86:3391–3395. [Google Scholar]
- 18.Kreibig U, Vollmer M. Optical properties of metal clusters. Springer; Berlin Heidelberg New York: 1995. [Google Scholar]
- 19.Norman TJ, Grant CD, Magana D, Zhang JZ, Liu J, Cao D, Bridges F, Van Buuren A. J Phys Chem B. 2002;106:7005–7012. [Google Scholar]
- 20.Lin-Vien D, Colthup NB, Fately WG, Grasselli JG. Infrared and raman characteristic frequencies of organic molecules. Academic; San Diego, CA: 1991. [Google Scholar]
- 21.Dai S, Zhang X, Du Z, Huang Y, Dang H. Colloid Surface B. 2005;42:21–28. doi: 10.1016/j.colsurfb.2004.12.021. [DOI] [PubMed] [Google Scholar]
- 22.Krafft C, Neudert L, Simat T, Salzer R. Spectrochim Acta A. 2005;(61):1529–1535. doi: 10.1016/j.saa.2004.11.017. [DOI] [PubMed] [Google Scholar]
- 23.Saint-Pierre Chazelet M, Masson M, Bousquet C, Bolbach G, Ridente Y, Bolard J. Thin Solid Films. 1994;244:852–856. [Google Scholar]
- 24.Suh JS. Chem Phys Lett. 1992;193:327–330. [Google Scholar]
- 25.Hallmark VM, Campion A. J Chem Phys. 1986;84:2933–2941. [Google Scholar]
- 26.Gersten J, Nitzan A. J Chem Phys. 1980;73:3023–3037. [Google Scholar]


