Abstract
Patients on long term lithium therapy for affective disorders may develop renal toxicity. It may manifest as nephrogenic diabetes insipidus with renal biopsy showing interstitial fibrosis, sclerotic glomeruli and cyst formation. Magnetic resonance imaging demonstrates the presence of microcysts in patients on long-term lithium therapy, suggesting a possible cause for their nephrotoxicity. We describe the typical magnetic resonance imaging appearance of renal microcysts in a 53 year old woman on chronic lithium therapy.
Keywords: MRI, Lithium Nephropathy, Renal Microcysts
CASE REPORT
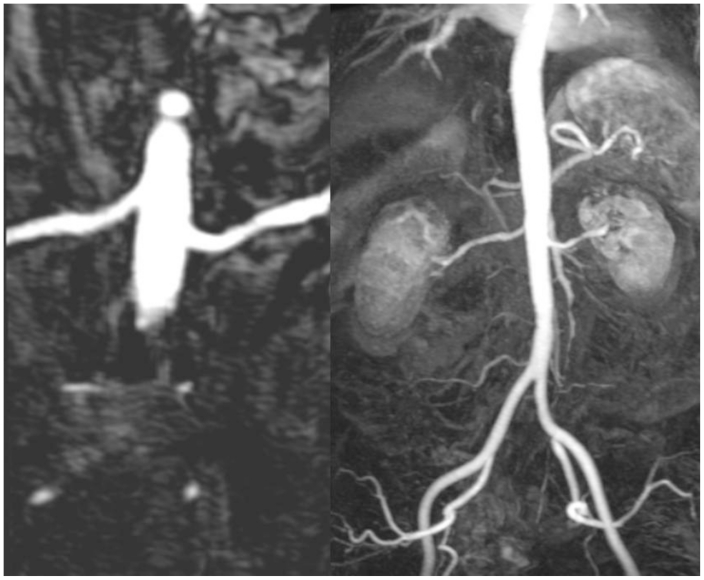
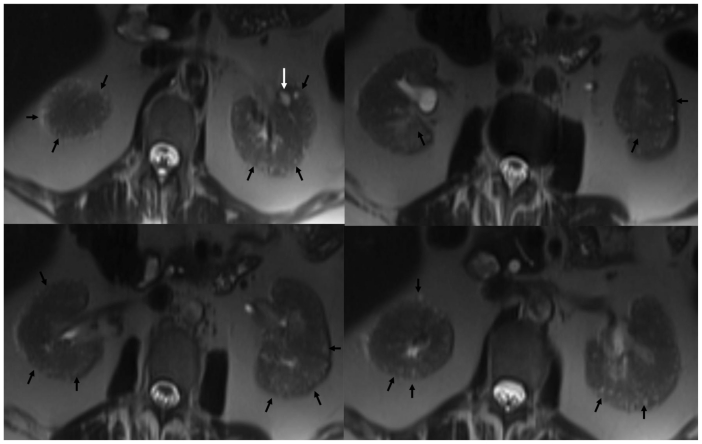
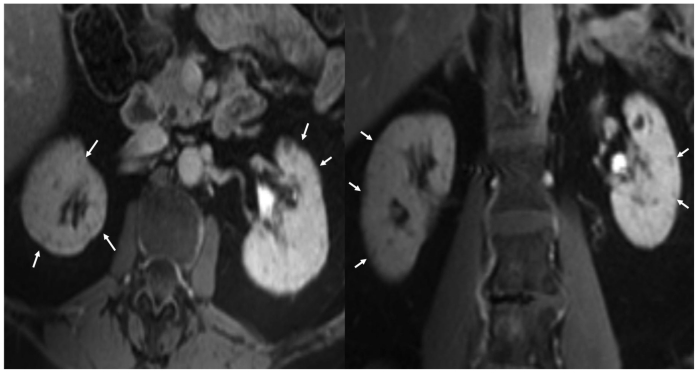
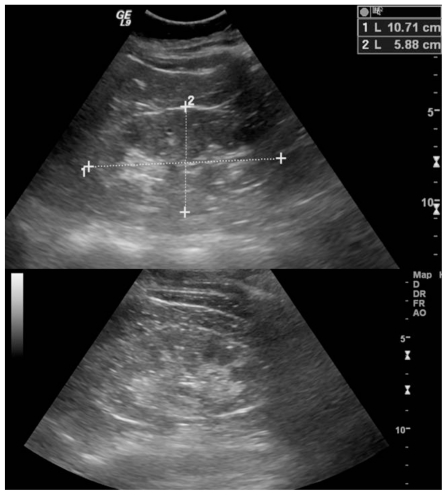
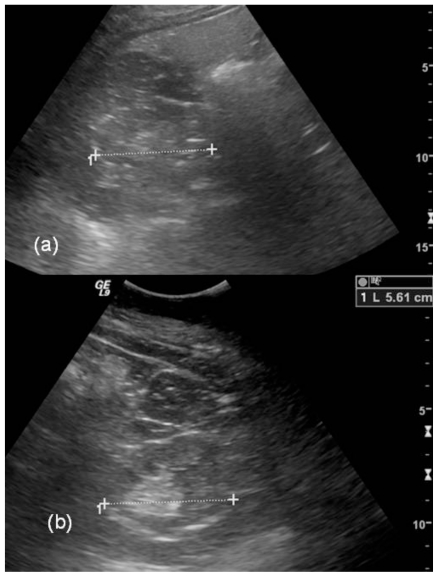
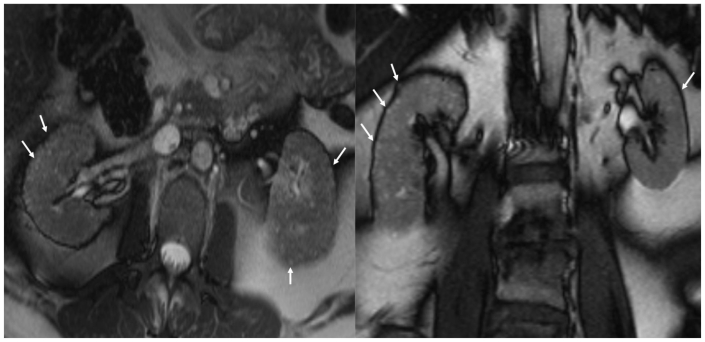
A 53 year old female with a past medical history significant for bipolar disorder, paranoid schizophrenia, hypertension, and diabetes mellitus was referred for a magnetic resonance imaging (MRI) and magnetic resonance angiography (MRA) study for evaluation of renal artery stenosis as a cause of her hypertension. Her MRA study was unremarkable for renal artery stenosis (Figure 1); however, her MRI study demonstrated normal sized kidneys with multiple T2 hyperintense tiny cysts scattered throughout the cortex and medulla of both kidneys (Figures 2 - 4). A long list of differential diagnoses of renal cystic disease was considered, which included simple renal cysts, autosomal dominant polycystic kidney disease (ADPKD), glomerulocystic kidney disease, medullary cystic kidney disease, and acquired cystic kidney disease. On chart review, it was seen that she had been on chronic lithium therapy for her psychiatric illness. She had developed polyuria and polydipsia consistent with diabetes insipidus, and had suffered from an episode of lithium toxicity two years ago when her lithium level was 2.9 mMol/L (therapeutic range 0.6–1.2 mMol/L). She had also undergone an ultrasound (US) exam earlier which showed normal sized kidneys with increased echogenicity, suggesting medical renal disease. The cysts seen on the MRI, however, were not visualized on ultrasound (Figures 5 and 6). The patient did not have a renal biopsy, but based on the typical appearance of the cysts, lithium nephropathy was diagnosed.
Figure 1.
53 year old female with chronic Lithium toxicity. Renal MR angiogram does not show any evidence of renal artery stenosis on the curved multiplanar reformatted (MPR) (left) and maximum intensity projection (MIP) (right) images. (Parameters- TR: 2.5ms, TE: 1.03ms, NEX: 1, Slice thickness: 1.1 mm, Field strength: 3T)
Figure 2.
53 year old female with chronic Lithium toxicity. Axial non contrast HASTE images through the kidneys demonstrate multiple tiny corticomedullary cysts in both kidneys (black arrows). Notice the predominant peripheral distribution and small, near uniform size of the cysts. The left kidney also demonstrates a larger cortical cyst (white arrow). (Parameters- TR: 1200ms, TE: 75ms, FA: 120, NEX: 1, Slice thickness: 5mm, Field strength: 3T)
Figure 4.
53 year old female with chronic Lithium toxicity. Post contrast T1W fat suppressed axial (left) and coronal (right) images through the kidneys show bilateral tiny non enhancing corticomedullary cysts. (Parameters- TR: 218ms, TE: 1.8ms, FA: 57, NEX: 1, Slice thickness: 5mm, Field strength: 3T, contrast: 0.1 mmol/kg IV Gadolinium, Omniscan, GE healthcare.)
Figure 5.
53 year old female with chronic Lithium toxicity. Longitudinal images from the Ultrasound study in the same patient demonstrate normal sized right (top) and left (bottom) kidneys. The kidneys demonstrate increased echogenicity. The tiny cysts seen on the MRI scan are not apparent on the ultrasound images. (Parameters: GE Logic 9, 4MHz probe).
Figure 6.
53 year old female with chronic Lithium toxicity. Transverse images from the Ultrasound study in the same patient. Again, the kidneys are normal in size, and the tiny cysts seen on the MRI scan are not apparent in the right kidney (a) or left kidney (b) on the ultrasound images. (Parameters: GE Logic 9, 4MHz probe)
DISCUSSION
Lithium is a well established treatment for affective disorders. It has a narrow therapeutic window, ranging from 0.6 – 1.2 mMol/L. Lithium nephrotoxicity can be classified into nephrogenic diabetes insipidus, acute toxicity, and chronic renal disease. Nephrogenic diabetes insipidus is characterized by polyuria and polydipsia. Mild toxicity can be seen at serum lithium levels of 1.5 – 2.5 mMol/L, with moderate toxicity at levels of 2.5 – 3.5 mMol/L [1]. Lithium toxicity affects multiple organ systems, and may cause coarse tremors, neuromuscular excitability, muscle weakness, sluggishness, nausea, vomiting, diarrhea, and seizures [1]. Rhabdomyolysis can also occur [2]. Decreasing renal function, evidenced by increasing serum creatinine and decreased creatinine clearance, is seen in chronic lithium nephropathy. The only established risk factor is lithium therapy, and an increased duration of therapy increases the risk of progression to end-stage renal disease (ESRD) [3, 4]. Discontinuation of lithium therapy does not ensure against progression to ESRD [3–5].
Chronic lithium nephropathy is a progressive condition, and pathology demonstrates tubular atrophy, glomerulosclerosis, interstitial fibrosis, and distal tubular dilatation with microcyst formation [5]. A recent study found that tubular microcysts were present in 62.5% of renal biopsies performed in patients treated with lithium, involved both the renal cortex and medulla, and measured 1–2 mm in diameter [5]. A serum creatinine level of 2.5 mg/dL at the time of biopsy was found to be the only significant predictor of progression to ESRD [5].
Renal cystic disease is commonly evaluated with US, computed tomography (CT), and MRI. The number and nature of cystic lesions is best characterized by MRI, and T2-weighted imaging most accurately assesses the fluid content of lesions. MRI is a useful tool to evaluate the renal parenchyma, and when combined with MRA, can effectively study the renal arteries. T2-weighted images demonstrate the microcysts of chronic lithium nephropathy as small hyperintense 1–2 mm round lesions. MRI supports the pathologic findings and demonstrates normal sized kidneys with symmetrical involvement [6]. In a patient with a history of lithium therapy, MR imaging of abundant microcysts within the kidneys bilaterally strongly supports the diagnosis of chronic lithium nephropathy, and may obviate the need for renal biopsy [6].
This case serves as an example of the importance of patient history in the evaluation of the imaging findings in multiple renal cysts in an adult. The differential diagnostic considerations for such findings include simple renal cysts, ADPKD, glomerulocystic kidney disease, medullary cystic kidney disease, and acquired cystic kidney disease. With a history of lithium exposure, lithium nephropathy should also be included in the differential diagnosis. These diseases can be differentiated by the age of the patient, as well as the size and distribution of the cysts. Simple renal cysts are present within the healthy population, and increase in size and number with age [6]. US demonstrates well-circumscribed, anechoic cystic structures with posterior acoustic enhancement, and CT shows hypodense cystic structures measuring between −10 and +20 Houndsfield units (HU) [7, 8]. The cysts are seen as T2 hyperintense cystic structures on MRI. Simple renal cysts can be differentiated from lithium nephropathy by the fact that they may vary in size and are few in number. ADPKD is the most common hereditary renal disease and requires the presence of more than four cysts in both kidneys in a patient older than sixty years of age for diagnosis [6, 9]. The kidneys progressively increase in size and cause pain [9]. Associated findings include hepatic and pancreatic cysts, as well as intracranial saccular aneurysms. US and CT demonstrate enlarged kidneys with multiple cysts of varying sizes [7, 8]. Cysts are T2 hyperintense on MRI. Renal enlargement and variability of cyst size, in combination with extrarenal findings, differentiate this entity from lithium nephropathy. Glomerulocystic kidney disease is a congenital condition that results in bilateral renal enlargement with multiple small cortical cysts and loss of the normal corticomedullary junction on US [6, 10]. CT shows multiple small cysts involving the corticomedullary junction, and MRI demonstrates low signal intensity of the cortex on T1-weighted images and increased cortical signal intensity on T2-weighted images [10]. Medullary cystic kidney disease is a hereditary disorder that results in small kidneys with cortical thinning and many small cysts limited to the medulla and corticomedullary junction, in comparison to the diffuse involvement seen in lithium nephropathy [6, 9]. US demonstrates increased echogenicity with medullary cysts [9]. CT shows medullary and corticomedullary hypodensities, with increased T2 signal seen on MRI [9]. Acquired cystic kidney disease frequently occurs in patients on dialysis. The kidneys are small in size, and demonstrate three to five cysts in each kidney [9]. This is in comparison to the numerous microcysts seen in normal sized kidneys in lithium nephropathy.
Our patient is a typical example of chronic lithium nephropathy with a long history of lithium therapy for bipolar disorder, who developed the typical microcysts seen on MRI in both kidneys described with lithium nephropathy and moderate lithium toxicity. It also supports the conclusion by Farres et al that MRI can be used to demonstrate renal microcysts secondary to chronic lithium nephropathy and therefore avoid renal biopsy [6].
TEACHING POINT
In patients with renal failure and uniformly distributed renal microcysts in normal sized kidneys, a history of chronic lithium therapy should be sought as a cause of nephropathy.
Figure 3.
53 year old female with chronic Lithium toxicity. Axial (left) and coronal (right) non-contrast Tru-FISP images through the kidneys show multiple hyperintense tiny corticomedullary cysts (arrows). The kidneys are symmetrically involved. (Parameters- TR: 3.9ms, TE: 1.9ms, FA: 60, NEX: 1, Slice thickness: 5mm, Field strength: 3T)
Table 1.
Summary table of chronic Lithium nephropathy
| Etiology | Impaired renal function resulting from tubular atrophy, interstitial fibrosis, sclerotic glomeruli, and tubular microcysts due to lithium therapy [5] |
| Incidence | 33–62% of renal biopsies in patients on lithium therapy demonstrate microcysts [5] |
| Gender ratio | None |
| Age predilection | None |
| Risk factors | Lithium therapy duration |
| Treatment | Cessation of lithium therapy |
| Prognosis | Risk of progression to end-stage renal disease increases with increased duration of lithium therapy [3, 4] Serum creatinine >2.5 mg/dL at biopsy is the only significant predictor of progression to end-stage renal disease [5] |
| Findings on Imaging | Normal sized kidneys with numerous 1–2 mm T2 hyperintense cysts evenly distributed between cortex and medulla, evenly affecting both kidneys [6] MRI : Microcysts are hypointense on T1, and not differentiated from the renal parenchyma [6] Renal parenchyma enhances with contrast, while microcysts appear as nonenhanced hypointense areas [6] US: normal sized kidneys with increased echogenicity CT : normal sized kidneys with numerous small hypodense cysts |
Table 2.
Differential diagnosis table of renal cystic disease
| Renal cystic disease | Imaging modality | Imaging findings |
|---|---|---|
| Lithium nephropathy | X-ray/IVP | None |
| Ultrasound | Normal sized kidneys with increased echogenicity | |
| CT | Normal sized kidneys with numerous small hypodense cysts | |
| MRI-T1 | Hypointense small cysts not differentiated from renal parenchyma [6] | |
| MRI-T2 | Numerous 1–2 mm hyperintense cysts [6] | |
| Contrast enhancement | Renal parenchyma enhances while cysts are hypointense and do not enhance [6] | |
| Simple renal cysts | X-ray/IVP | None |
| Ultrasound | Thin-walled anechoic cysts with well-defined posterior walls and posterior acoustic enhancement [7] | |
| CT | Multiple and bilateral sharply marginated variable sized cysts measuring −10 to +20 Hounsfield units [8] | |
| MRI-T1 | Variable sized hypointense cysts | |
| MRI-T2 | Variable sized hyperintense cysts | |
| Contrast enhancement | None | |
| Autosomal dominant polycystic kidney disease (ADPKD) | X-ray/IVP | Enlarged renal shadow with filling defects bilaterally. |
| Ultrasound | Bilateral progressive nephromegaly with multiple, variable sized, well-defined anechoic cysts within cortex and medulla [7] | |
| CT | Progressive nephromegaly with parenchymal replacement by numerous variable sized hypodense cysts [8] Hemorrhage may cause calcification and increased attenuation | |
| MRI-T1 | Nephromegaly with cysts of variable size and signal intensity [6] | |
| MRI-T2 | Nephromegaly with cysts of variable size and signal intensity [6] | |
| Contrast enhancement | Parenchymal enhancement without cyst enhancement | |
| Glomerulocystic kidney disease | ||
| X-ray/IVP | None | |
| Ultrasound | Bilateral renal enlargement with cortical and medullary echogenicity with multiple small cortical cysts and loss of corticomedullary differentiation [10] | |
| CT | Multiple small hypodense cysts at the corticomedullary junction [10] | |
| MRI-T1 | Hypointense cortex with loss of the corticomedullary junction [10] | |
| MRI-T2 | Small hyperintense cortical cysts and normal medulla [6] | |
| Contrast enhancement | None | |
| Medullary cystic kidney disease | ||
| X-ray/IVP | None | |
| Ultrasound | Cortical thinning with well-defined, anechoic cysts involving medulla and corticomedullary region [9] | |
| CT | Thinned cortex with hypodense cysts involving medulla and corticomedullary region [9] | |
| MRI-T1 | Thinned cortex with hypointense to intermediate medullary and corticomedullary cysts [9] | |
| MRI-T2 | Thinned cortex with hyperintense medullary and corticomedullary cysts [9] | |
| Contrast enhancement | None | |
| Acquired cystic kidney disease | ||
| X-ray/IVP | None | |
| Ultrasound | Small echogenic kidneys with variable sized, well-defined anechoic cysts [9] | |
| CT | Small kidneys with replacement of parenchyma with numerous hypodense cysts variable in size [6] | |
| MRI-T1 | Small kidneys with cortical and medullary cysts of variable size and signal intensity | |
| MRI-T2 | Small kidneys with cortical and medullary cysts of variable size and signal intensity | |
| Contrast enhancement | None |
ABBREVIATIONS
- MRI
Magnetic Resonance Imaging
- MRA
Magnetic Resonance Angiography
- US
Ultrasound
- ADPCKD
Autosomal Dominant Polycystic Kidney Disease
- ESRD
End Stage Renal Disease
- CT
Computed Tomography
- MPR
Multiplanar Reformat
- MIP
Maximum Intensity Projection
REFERENCES
- 1.Alexander M, Farag Y, Mittal B, Rennke H, Singh A. Lithium toxicity: A double-edged sword. Kidney International. 2008;73:233–237. doi: 10.1038/sj.ki.5002578. [DOI] [PubMed] [Google Scholar]
- 2.Coco T, Klasner A. Drug-induced rhabdomyolysis. Curr Opin Pediatr. 2004;16:206–210. doi: 10.1097/00008480-200404000-00017. [DOI] [PubMed] [Google Scholar]
- 3.Bendz H, Schon S, Attman P, Aurell M. Renal failure occurs in chronic lithium therapy but is uncommon. Kidney International. 2010;77:219–224. doi: 10.1038/ki.2009.433. [DOI] [PubMed] [Google Scholar]
- 4.Presne C, Fakhouri F, Noel L, et al. Lithium-induced nephropathy: rate of progression and prognostic factors. Kidney International. 2003;64:585–592. doi: 10.1046/j.1523-1755.2003.00096.x. [DOI] [PubMed] [Google Scholar]
- 5.Markowitz G, Radhakrishnan J, Kambham N, Valeri A, Hines W, D'Agati V. Lithium nephrotoxicity: a progressive combined glomerular and tubulointerstitial nephropathy. J Am Soc Nephrol. 2000;11:1439–1448. doi: 10.1681/ASN.V1181439. [DOI] [PubMed] [Google Scholar]
- 6.Farres M, Ronco P, Saadoun D, et al. Chronic lithium nephropathy: MR imaging for diagnosis. Radiology. 2003;229(2):570–574. doi: 10.1148/radiol.2292020758. [DOI] [PubMed] [Google Scholar]
- 7.Middleton W, Kurtz A, Hertzberg B. Ultrasound: The Requisites. 2nd ed. St Louis: Mosby; 2004. Kidney; pp. 103–151. [Google Scholar]
- 8.Brant W. Kidney. In: Webb W, Brant W, Major N, editors. Fundamentals of Body CT. 3rd ed. Philadelphia: Elsevier; 2006. pp. 273–302. [Google Scholar]
- 9.Thomsen H, Levine E, Meilstrup J, et al. Renal cystic diseases. Eur Radiol. 1997;7:1267–1275. doi: 10.1007/s003300050288. [DOI] [PubMed] [Google Scholar]
- 10.Egashira K, Nakata H, Hashimoto O, Kaizu K. MR imaging of adult glomerulocystic kidney disease: A case report. Acta Radiologica. 1991;32( 3):251–253. [PubMed] [Google Scholar]


