Abstract
Context:
Oral lesions related to the use of commercially available tobacco (gutkha) is going to pose a major challenge for health care providers in India. Therefore, techniques that are useful for mass screening of the public for early identification of pre-cancerous lesions and conditions are necessary to overcome this challenge.
Aims:
To identify the differences in autofluorescence spectra of normal oral mucosa, mucosa of betel quid chewers, and mucosa of oral sub mucous fibrosis.
Materials and Methods:
Group I consist of 15 individuals with clinical diagnosis of oral submucous fibrosis, Group II consists of 18 individuals without oral submucous fibrosis, having the habit of betel quid (gutkha) chewing and Group III consists of 18 normal individuals without the habit of betel quid chewing. Both males and females were included in the study with their age ranging from 18 to 53 years. In vivo fluorescence spectra were obtained using an optical fibre probe attached to Fluoromax-2 spectrofluorometer in the Department of Medical Physics, Anna University, Chennai, India.
Statistical Analysis Used:
Fisher's Chi square test was used for statistical analysis. Probability value (P value) was also obtained to discriminate the statistical differences between the three groups.
Results:
The averaged emission and excitation spectra of oral submucous fibrosis was significantly less compared to normal mucosa and betel quid chewers. The statistical findings showed significant differences (P<0.001) between oral submucous fibrosis and the other two groups.
Conclusions:
Fluorescence spectroscopy can be used effectively for diagnosing the individuals affected by OSMF. However, this technique was unable to discriminate the betel chewers mucosa from normal individuals.
Keywords: Arecanut, autofluorescence spectra, collagen distortion, gutkha, oral submucous fibrosis
INTRODUCTION
Oral sub mucous fibrosis (OSMF) was first described by Schwartz in the year 1952. He described the condition as “atrophica idiopathica mucosa oris” in tobacco chewing women of Indian origin in Kenya.[1] Since then several researchers had investigated the condition thoroughly and proposed several factors that play a role in its etiopathogenesis.[2–5] Current evidence suggests that arecoline in areca nut is the key factor in initiating the disease process.[6,7] OSMF predominantly involves the buccal mucosa, retromolar area, lips, and soft palate.[8,9] In addition, this condition may also involve the pharynx and esophagus who chew and swallow the products of betel quid.[10,11] Recent reports suggest that the incidence of malignancy is increasing among the people who use commercially available gutkha products.[12–14]
The habit of betel quid chewing is widespread throughout India and South East Asia. This condition is also reported among the Asian immigrants living in other parts of the world.[15] Since the habit of betel quid chewing and other commercially available products is widespread in India, techniques for mass screening of public are necessary to identify this condition at an earlier stage.[16] Autofluorescence (AF) is one such technique that has been used with considerable success for identifying the neoplastic lesions in various tissues of the body, including oral squamous cell carcinoma.[17]
AF spectroscopy is an easily applicable tool for detecting the alterations in the structural and chemical compositions of cells, indicating the presence of altered or diseased tissue.[18,19] AF of the tissues is due to the presence of several endogenous fluorophores which include tissue matrix molecules and intracellular molecules such as tryptophan, collagen, and NADH.[20] When excited by a particular wave length these fluorophores emit fluorescence at a particular wavelength, for example, tryptophan gives maximum emission at 340 nm, collagen at 390 and NADH at 440 nm. This property of fluorescence emission at a particular wavelength is due to the biological nature of these molecules for AF spectroscopy.[20–22]
Early detection of premalignant lesions and conditions can reduce the morbidity and mortality rates of the patients and therefore it is of great clinical importance. In the present study, the technique of autofluorescence was used to detect the mucosal changes in normal controls, betel quid chewers, and OSMF patients.
MATERIALS AND METHODS
The study was conducted in the department of Medical Physics, Anna University, Chennai, India. Fifteen Patients diagnosed with OSMF had been selected for the study from Saveetha dental college and hospital (Group-I). Eighteen patients having the habit of betel quid chewing without any signs and symptoms of OSMF were also selected with their consent (Group-II). Eighteen normal individuals without the habit of betel quid chewing were selected as controls who volunteered for the study (Group-III).
The age of the subjects in all the three groups ranged from 18 to 53 years which included both males and females. All the individuals underwent routine haematological examination prior to the study. Individuals with systemic conditions like diabetes, hypertension, pregnancy, and lactating mothers were excluded from the study.
Autofluorescence spectroscopy
The procedure of autofluorescence spectroscopy was explained to the individuals and written consent was obtained from all the three groups. In vivo fluorescence spectra were recorded from the mucosa of OSMF patients in the area where the mucosa was most affected. Fluorescence spectra in betel quid chewers were recorded from the mucosa where the quid was habitually placed. Fluorescence spectra in case of normal individuals were obtained from the posterior part of buccal mucosa. The fluorescence emission spectra from all the three groups were obtained using a hand held fibre optic probe attached to Fluoromax-2 spectrofluorometer (ISA Jobin Yvon–Spex, Edison, New Jersey , USA). The excitation light was provided by a monochromator with 150-W ozone free Xenon lamp. Specific wavelengths required for the study were obtained by the computer guided programme. The excitation light was guided to the desired site over the mucosa of each subject by one arm of Y-type quartz fibre bundle of fibre optic probe [Figure 1]. The resulting emission fluorescence was collected by another arm of the fibre bundle and sent to the photomultiplier detector. The signal is then amplified and displayed in the computer monitor.
Figure 1.
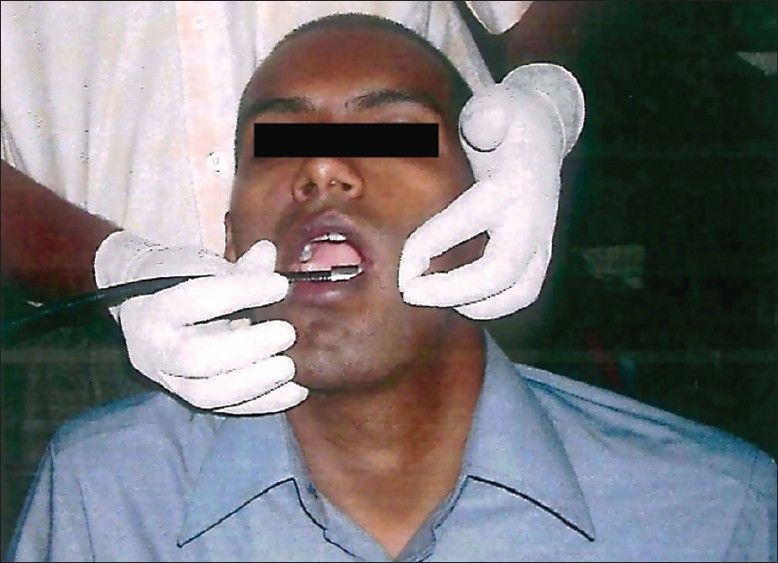
In vivo spectral recording with the fiber optic probe placed over the desired area
Excitation-emission spectra
Thoroughly disinfected fibre optic probe was held over the desired mucosal site for recording the excitation and emission spectra. Ultraviolet light at 280 and 330 nm wavelengths were used for recording the excitation spectra. Ultraviolet light at 340 and 390 nm wavelengths were used for recording the emission spectra. The resulting emission and excitation spectra were recorded from 350 to 600 nm in 1 nm increments. The same procedure was carried out for each subject group.
RESULTS
Averaged emission spectrum
Fluorescence emission spectra of oral mucosa at 280 nm excitation
The averaged emission spectra of normal mucosa, mucosa of betel quid chewers and mucosa of OSMF at 280 nm excitation corresponding to the amino acid residue, tryptophan molecules are shown in Figure 2, with wavelength in the X-axis and fluorescence intensity in Y-axis. Normal oral mucosa and betel quid chewers mucosa showed a prominent peak at 338 nm and a small peak at 460 nm. It is interesting to note that OSMF did not show any intensity peaks at 338 and 460 nm wavelengths.
Figure 2.
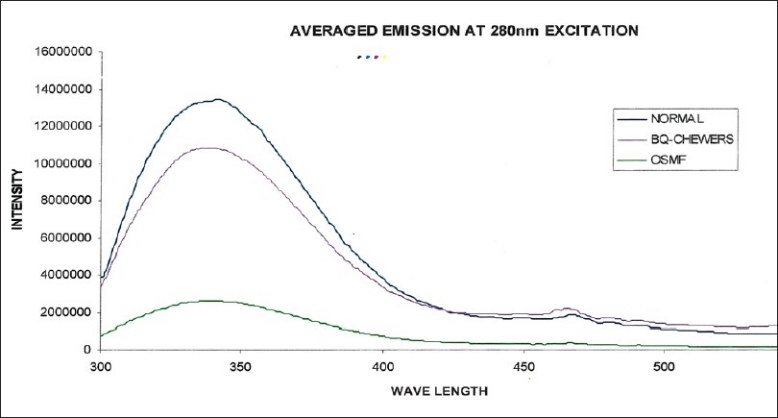
Averaged fluorescence emission spectra of normal, betel quid chewers, and OSMF at 280 nm excitation
Fluorescence emission spectra of oral mucosa at 320 nm excitation (absorption spectrum for collagen)
The averaged emission spectra of normal mucosa, mucosa of betel quid chewers and mucosa of OSMF at 320 nm excitation corresponding to the presence of collagen/elastin in the tissues is shown in Figure 3. Normal oral mucosa and betel quid chewer's mucosa showed two prominent peaks at 390 and 460 nm, respectively. The first peak at 390 nm corresponds to the collagen (around 390 nm) and the second peak corresponds to the NADH (around 460 nm) that are almost equal.
Figure 3.
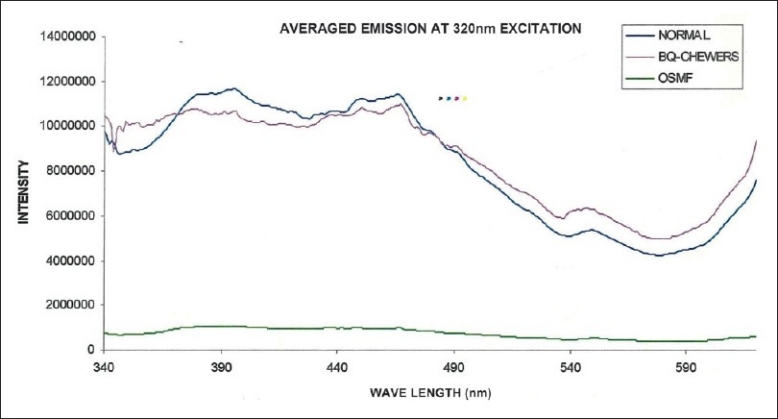
Averaged fluorescence emission spectra of normal, betel quid chewers, and OSMF at 320 nm excitation
Surprisingly, the mucosa of OSMF did not show any increase in intensity at 390 nm that corresponds to the amount of collagen. It is interesting to note that the fluorescence intensity was least in severe cases of OSMF who had thick palpable fibrous bands. The second peak at 460 nm that corresponds to NADH in the tissues was also not seen in OSMF.
Averaged excitation spectrum
Fluorescence excitation (absorption) spectra of oral mucosa at 340 nm emission
The averaged excitation spectra of normal mucosa, mucosa of betel quid chewers and mucosa of OSMF at 340 nm emission corresponding to tryptophan are shown in Figure 4. The excitation spectra corresponding to normal mucosa showed prominent intensity at 295 nm, where as the betel quid chewers mucosa showed a prominent peak at 296 nm. OSMF showed a small peak with maximum intensity at 292 nm wavelength. This picture shows that maximum intensity is shown by normal mucosa followed by betel quid chewers and the mucosa of OSMF.
Figure 4.
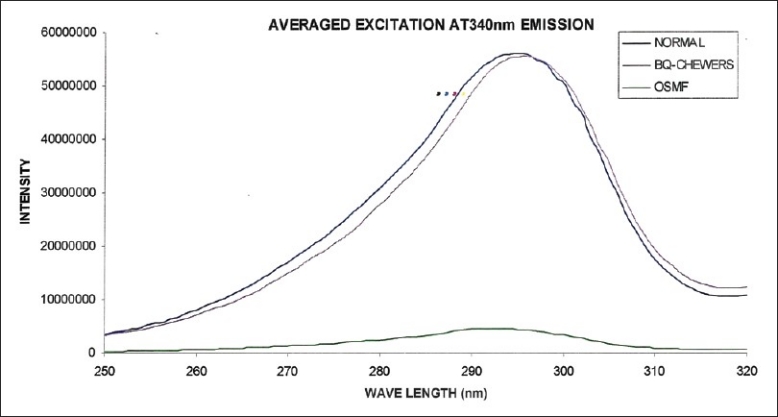
Averaged fluorescence excitation spectra of normal, betel quid chewers, and OSMF at 340 nm emission
Fluorescence excitation (absorption) spectra of oral mucosa at 390 nm emission
The averaged excitation spectra of normal mucosa, mucosa of betel quid chewers and mucosa of OSMF at 390 nm emission corresponding to the collagen are shown in Figure 5. The excitation spectra corresponding to normal mucosa and betel quid chewers mucosa showed intensity peaks at 295 nm, where as OSMF showed a small peak at this wavelength. However, it is worth to note that the excitation intensity of betel quid chewers is much less compared to normal mucosa at this emission spectrum.
Figure 5.
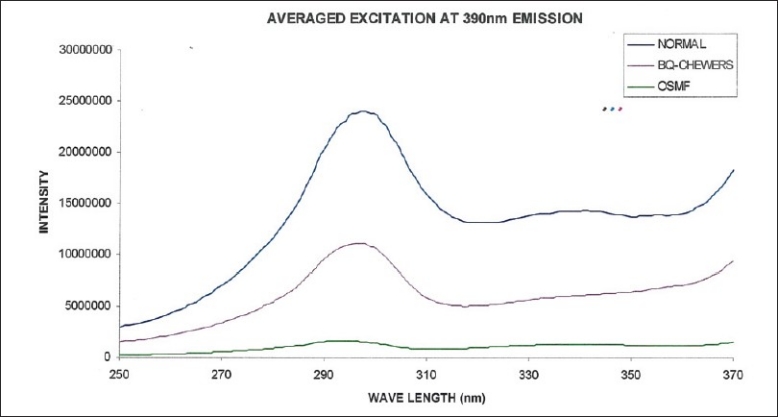
Averaged fluorescence excitation spectra of normal, betel quid chewers, and OSMF at 390 nm emission
Discrimination of OSMF from betel quid chewers and normal individuals
As there is considerable difference in the autofluorescence spectra between normal individuals and OSMF, an attempt is made to verify the diagnostic potential of this technique. We also attempted to discriminate the betel quid chewers from normal individuals and OSMF patients. In this context, intensity values at 380 nm emission for 320 nm excitation were introduced for subsequent analysis [Figures 6–8]. This value was considered for further study because the emission at 380 nm for 320 nm excitation corresponds to the collagen spectrum. So the amount of fluorescence at this intensity is directly proportional to the amount of collagen present in the tissues.
Figure 6.
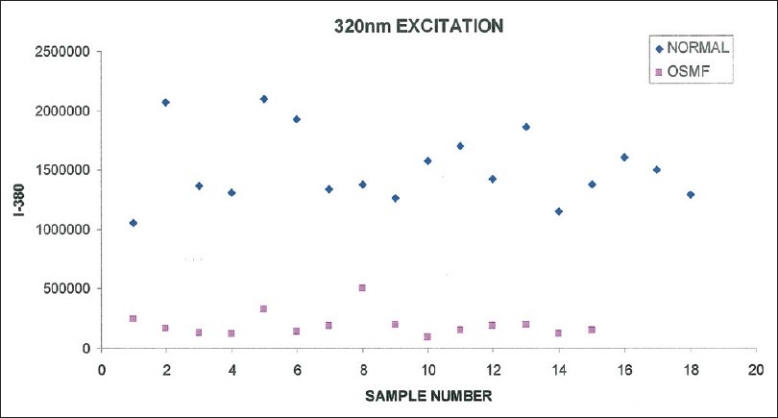
Scatter plot of intensity value at 380 nm vs sample number for normal and OSMF from fluorescence emission at 320 nm
Figure 8.
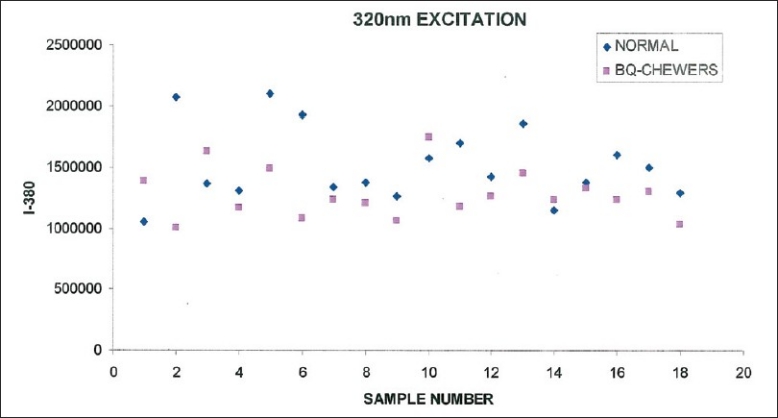
Scatter plot of intensity value at 380 nm vs sample number for normal and betel quid chewers from fluorescence emission at 320 nm
Discrimination using peak intensity values
Figure 6 shows the fluorescence intensity at 380 nm for betel quid chewers and OSMF patients at 320 nm excitation. From the figure it is observed that there is considerable difference in the fluorescence intensity at I-380 between betel quid chewers and OSMF patients. Fisher's Chi-square test for the intensity value 700,000 discriminated normal from betel chewers with a sensitivity of 100% and specificity of 100%.
Figure 7 shows the fluorescence intensity at 380 nm for normal and OSMF patients at 320 nm excitation. A clear difference in the fluorescence intensity at I-380 between normal and OSMF patients was observed. Fisher's Chi-square test for the intensity value 700,000 discriminated normal from betel chewers with a sensitivity of 100% and specificity of 100%.
Figure 7.
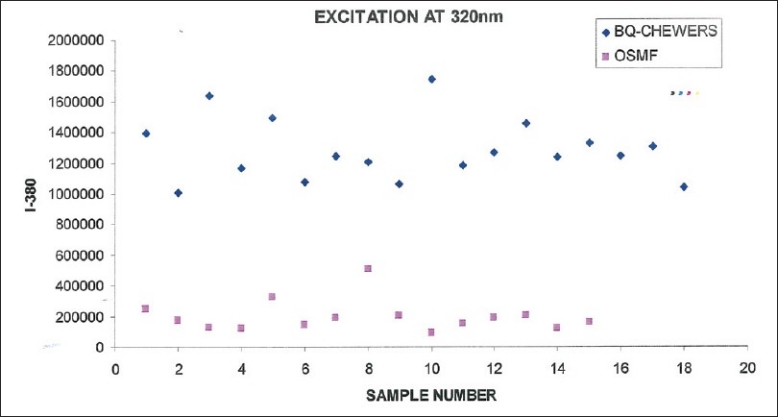
Scatter plot of intensity value at 380 nm vs sample number for betel quid chewers and OSMF from fluorescence emission at 320 nm
Figure 8 shows the fluorescence intensity at 380 nm for normal, betel quid chewers at 320 nm excitation. From the figure it is observed that there is considerable overlap in the fluorescence intensity at I-380 between normal and betel quid chewers. Fisher's Chi-square test for the intensity value of 1159,216 discriminates normal from betel chewers with a sensitivity of 78% and specificity of 12%.
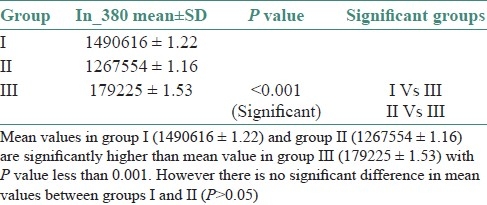
Mean standard deviation with test of significance between the three groups for 380 nm intensity at 320 nm excitation was performed. The statistical findings showed significant differences (P<0.001) between OSMF and the other two groups [Table 1].
Table 1.
Mean standard deviation and significant groups in the study
DISCUSSION
Commercially available tobacco products (Gutkha) contain a dangerous combination of tobacco and areca nut apart from other harmful ingredients. It was found from many studies that commercially available gutkha is the major cause of oral cancer in India. Recent reports state that its usage is gradually increasing among young adults and even in children.[23]
The present pilot study comprised patients with their age ranging from 18 to 53 years. In this context age changes in normal oral mucosa needs to be addressed. Morphological changes as a part of aging include, decreasing cellularity and increased coarseness of collagen fibers.[24] However, these changes may not affect the discrimination sensitivity of AF spectra because the collagen that is formed in the pathogenesis of OSMF is highly stable due to cross linkage and fibers formed in thick bundles. In this study, OSMF patients having thick palpable fibrous bands showed maximum amount of fluorescence distortion. Normal individuals with old age did not show much change in the AF spectra, as a part of their normal aging process. This finding is supported by the findings of Tsai et al., who reported that the presence of OSMF made hyperkeratosis and dysplasia indistinguishable from healthy mucosa.[25]
The fluorescence emission spectra of the normal mucosa, mucosa of betel quid chewers showed a prominent peak at 338 nm and a small secondary peak at 440 nm for 280 nm excitation [Figure 2]. The emission peak at 338 nm is attributed to the presence of tryptophan in the tissues.[20] OSMF showed a small peak at 338 nm without a secondary peak at 440 nm when compared to normal oral mucosa and betel quid chewers mucosa. The reduced intensity in OSMF patients can be attributed to the generalized distortion of fluorescence emission by the presence of collagen. Collagen causes distortion of fluorescence emitted by other fluorophores such as tryptophan, NADH, FAD, and hemoglobin.[25]
The fluorescence emission spectra of the normal mucosa, mucosa of betel quid chewers and mucosa of OSMF at 320 nm excitation corresponding to collagen is shown in Figure 3. The peak at 390 nm corresponds to the presence of collagen and elastin present in the tissues.[25] It is surprising to observe that the mucosa of OSMF having increased collagen displayed decreased fluorescence intensity compared to that of normal and betel quid chewers. This observation is contradictory to that of Chen et al.[26] who found increased fluorescence in OSMF compared to that of normal individuals. However, our results are similar to the findings of Tsai et al.[25] who found decreased fluorescence intensity in OSMF patients compared to normal individuals. Tsai attributed that the reason for decreased fluorescence intensity is due to the scattering of fluorescence emission by dense collagen deposited in OSMF.
The second peak at 440 nm corresponds to the presence of NADH present in the epithelial cells.[21] The NADH intensity of betel quid chewers is slightly less compared to that of normal individuals. This might be due to minimal scattering caused by the collagen that is beginning to accumulate in the submucosa of these individuals. In case of OSMF no peak is observed at 440 nm wavelength. This can be explained by the fact that the thick collagen fiber bundles in the submucosa might have caused the distortion of fluorescence as previously explained.
The dip or valley at 420 nm corresponds to the hemoglobin absorption.[22] This dip indicates the amount of vascularity in the tissues. This dip is more in vascular tissues due to the absorption of fluorescence by hemoglobin and less in avascular tissues. Normal and betel quid chewers showed a prominent dip around 420 nm, but OSMF patients did not show any dip around 420 nm emission. This finding correlates with the histopathological finding of reduced vascularity in OSMF.
The second part of the study consists of fluorescence excitation spectroscopy. This is a complementary technique that is sensitive to any confrontational changes that takes place during the tissue transformation process. In this context, excitation spectra of normal mucosa, mucosa of betel quid chewers and mucosa of OSMF at 340 and 390 nm emissions were taken.
From the Figure 4 it is found that both normal and betel quid chewers tissues have similar absorption bands at around 300 nm. However, OSMF had very minimal absorption (30 times less). This may be due to scattering or reflection of light from the white mucosal surface (general laws of light) due to decreased blood supply or it might be due to distortion of fluorescence caused by collagen as attributed by Tsai et al.[25]
In order to improve the diagnostic interpretation, different parameters were introduced at the emission peaks of 320 nm excitation spectra. We selected the emission at 380 nm wavelength for 320 nm excitation because of the presence of collagen, hemoglobin, and NADH fluorophores that are altered in OSMF. These parameters showed significant statistical difference between normal and OSMF [Figure 6] and also between betel quid chewers and OSMF [Figure 7] with P value less than 0.001 [Table 1]. However, the difference between normal and betel quid chewers was less significant with P value more than 0.05 [Figure 8].
CONCLUSION
The present in vivo autofluorescence spectroscopy clearly differentiated OSMF from normal individuals and betel quid chewers with significant statistical difference. However, our attempt to differentiate the mucosa of betel quid chewers from normal individuals was not successful. The present study showed that the mucosa of OSMF showed loss of fluorescence that was directly proportional to the degree of collagen deposition. Further studies with more sample size are required to identify the exact cause of decreased fluorescence intensity in OSMF.
ACKNOWLEDGEMENT
We sincerely thank Dr. S. Ganesan, Professor, Department of Medical Physics, Anna University, Chennai, India for extending his kind support during the study.
Footnotes
Source of Support: Nil.
Conflict of Interest: None declared.
REFERENCES
- 1.Gupta D, Sharma SC. Oral submucous fibrosis–a new treatment regimen. J Oral Maxillofac Surg. 1988;46:830–3. doi: 10.1016/0278-2391(88)90043-2. [DOI] [PubMed] [Google Scholar]
- 2.Rajalalitha P, Vali S. Molecular pathogenesis of oral submucous fibrosis–a collagen metabolic disorder. J Oral Pathol Med. 2005;34:321–8. doi: 10.1111/j.1600-0714.2005.00325.x. [DOI] [PubMed] [Google Scholar]
- 3.Paul RR, Chatterjee J, Das AK, Cervera ML, de la Guardia M, Chaudhuri K. Altered elemental profile as indicator of homeostatic imbalance in pathogenesis of oral submucous fibrosis. Biol Trace Elem Res. 2002;87:45–56. doi: 10.1385/BTER:87:1-3:045. [DOI] [PubMed] [Google Scholar]
- 4.Paul RR, Chatterjee J, Das AK, Dutta SK, Roy D. Zinc and iron as bioindicators of precancerous nature of oral submucous fibrosis. Biol Trace Elem Res. 1996;54:213–30. doi: 10.1007/BF02784433. [DOI] [PubMed] [Google Scholar]
- 5.Shah N, Kumar R, Shah MK. Immunological studies in oral submucous fibrosis. Indian J Dent Res. 1994;5:81–7. [PubMed] [Google Scholar]
- 6.Shieh DH, Chiang LC, Shieh TY. Augmented mRNA expression of tissue inhibitor of metalloproteinase-1 in buccal mucosal fibroblasts by arecoline and safrole as a possible pathogenesis for oral submucous fibrosis. Oral Oncol. 2003;39:728–35. doi: 10.1016/s1368-8375(03)00101-5. [DOI] [PubMed] [Google Scholar]
- 7.Xia L, Tian-You L, Yi-Jun G, Dong-Sheng T, Wen-Hui L. Arecoline and oral keratinocytes may affect the collagen metabolism of fibroblasts. J Oral Pathol Med. 2009;38:422–6. doi: 10.1111/j.1600-0714.2009.00758.x. [DOI] [PubMed] [Google Scholar]
- 8.Shieh DH, Chiang LC, Lee CH, Yang YH, Shieh TY. Effects of arecoline, safrole, and nicotine on collagen phagocytosis by human buccal mucosal fibroblasts as a possible mechanism for oral submucous fibrosis in Taiwan. J Oral Pathol Med. 2004;33:581–7. doi: 10.1111/j.1600-0714.2004.00229.x. [DOI] [PubMed] [Google Scholar]
- 9.Angadi PV, Rao SS. Areca nut in pathogenesis of oral submucous fibrosis: Revisited. Oral Maxillofac Surg. 2011;15:1–9. doi: 10.1007/s10006-010-0219-8. [DOI] [PubMed] [Google Scholar]
- 10.Wahi PN, Kapur VL, Luthra UK, Srivastava MC. Submucous fibrosis of the oral cavity. 1. Clinical features. Bull World Health Organ. 1966;35:789–92. [PMC free article] [PubMed] [Google Scholar]
- 11.Tilakaratne WM, Klinikowski MF, Saku T, Peters TJ, Warnakulasuriya S. Oral submucous fibrosis: Review on aetiology and pathogenesis. Oral Oncol. 2006;42:561–8. doi: 10.1016/j.oraloncology.2005.08.005. [DOI] [PubMed] [Google Scholar]
- 12.Bathi RJ, Parveen S, Burde K. The role of gutka chewing in oral submucous fibrosis: A case-control study. Quintessence Int. 2009;40:19–25. [PubMed] [Google Scholar]
- 13.Angadi PV, Rekha KP. Oral submucous fibrosis: A clinicopathologic review of 205 cases in Indians. Oral Maxillofac Surg. 2011;15:15–9. doi: 10.1007/s10006-010-0225-x. [DOI] [PubMed] [Google Scholar]
- 14.Auluck A, Rosin MP, Zhang L, Sumanth KN. Oral submucous fibrosis, a clinically benign but potentially malignant disease: Report of 3 cases and review of the literature. J Can Dent Assoc. 2008;74:735–40. [PubMed] [Google Scholar]
- 15.Changrani J, Gany F. Paan and Gutka in the United States: An emerging threat. J Immigr Health. 2005;7:103–8. doi: 10.1007/s10903-005-2643-7. [DOI] [PubMed] [Google Scholar]
- 16.Fricain JC. [Autofluorescence for the detection of potentially malignant and malignant lesions of the oral cavity lining] Rev Stomatol Chir Maxillofac. 2011;112:16–21. doi: 10.1016/j.stomax.2010.12.001. [DOI] [PubMed] [Google Scholar]
- 17.Rahman MS, Ingole N, Roblyer D, Stepanek V, Richards-Kortum R, Gillenwater A, et al. Evaluation of a low-cost, portable imaging system for early detection of oral cancer. Head Neck Oncol. 2010;2:10. doi: 10.1186/1758-3284-2-10. [DOI] [PMC free article] [PubMed] [Google Scholar]
- 18.Mallia RJ, Thomas SS, Mathews A, Kumar R, Sebastian P, Madhavan J, et al. Laser-induced autofluorescence spectral ratio reference standard for early discrimination of oral cancer. Cancer. 2008;112:1503–12. doi: 10.1002/cncr.23324. [DOI] [PubMed] [Google Scholar]
- 19.Moro A, Di Nardo F, Boniello R, Marianetti TM, Cervelli D, Gasparini G, et al. Autofluorescence and early detection of mucosal lesions in patients at risk for oral cancer. J Craniofac Surg. 2010;21:1899–903. doi: 10.1097/SCS.0b013e3181f4afb4. [DOI] [PubMed] [Google Scholar]
- 20.Schwarz RA, Gao W, Redden Weber C, Kurachi C, Lee JJ, El-Naggar AK, et al. Noninvasive evaluation of oral lesions using depth-sensitive optical spectroscopy. Cancer. 2009;115:1669–79. doi: 10.1002/cncr.24177. [DOI] [PMC free article] [PubMed] [Google Scholar]
- 21.Wang CY, Chiang HK, Chen CT, Chiang CP, Kuo YS, Chow SN. Diagnosis of oral cancer by light-induced autofluorescence spectroscopy using double excitation wavelengths. Oral Oncol. 1999;35:144–50. doi: 10.1016/s1368-8375(98)00107-9. [DOI] [PubMed] [Google Scholar]
- 22.Pavlova I, Williams M, El-Naggar A, Richards-Kortum R, Gillenwater A. Understanding the biological basis of autofluorescence imaging for oral cancer detection: High-resolution fluorescence microscopy in viable tissue. Clin Cancer Res. 2008;14:2396–404. doi: 10.1158/1078-0432.CCR-07-1609. [DOI] [PMC free article] [PubMed] [Google Scholar]
- 23.Javed F, Chotai M, Mehmood A, Almas K. Oral mucosal disorders associated with habitual gutka usage: A review. Oral Surg Oral Med Oral Pathol Oral Radiol Endod. 2010;109:857–64. doi: 10.1016/j.tripleo.2009.12.038. [DOI] [PubMed] [Google Scholar]
- 24.Tian WD, Gillies R, Brancaleon L, Kollias N. Aging and effects of ultraviolet A exposure may be quantified by fluorescence excitation spectroscopy in vivo. J Invest Dermatol. 2001;16:840–5. doi: 10.1046/j.1523-1747.2001.01361.x. [DOI] [PubMed] [Google Scholar]
- 25.Tsai T, Chen HM, Wang CY, Tsai JC, Chen CT, Chiang CP. In vivo autofluorescence spectroscopy of oral premalignant and malignant lesions: Distortion of fluorescence intensity by submucous fibrosis. Lasers Surg Med. 2003;33:40–7. doi: 10.1002/lsm.10180. [DOI] [PubMed] [Google Scholar]
- 26.Chen HM, Wang CY, Chen CT, Yang H, Kuo YS, Lan WH, et al. Auto-fluorescence spectra of oral submucous fibrosis. J Oral Pathol Med. 2003;32:337–43. doi: 10.1034/j.1600-0714.2003.00112.x. [DOI] [PubMed] [Google Scholar]


