Abstract
Autism spectrum disorders (ASDs) are a group of diseases exhibiting impairment in social drive, communication/language skills and stereotyped behaviors. Though an increased number of candidate genes and molecular interactions have been identified by various approaches, the pathogenesis remains elusive. Based on clinical observations, data from accessible GWAS and expression datasets we identified ASDs gene candidates. Integrative gene network and a novel CNV-centric Node Network (CNN) analysis method highlighted ASDs-associated key elements and biological processes. Functional analysis identified neurological functions including synaptic cholinergic receptor (CHRNA) families, dopamine receptor (DRD2), and correlations between social behavior and oxytocin related pathways. CNN analysis of genome-wide genetic and expression data identified inheritance-related clusters related to PTEN/TSC1/FMR1 and mTor/PI3K regulation. Integrative analysis identified potential regulators of networks, specifically TNF and beta-estradiol, suggesting a potential central role in ASDs. Our data provides information on potential disease mechanisms, and key regulators that may generate novel postulations, and diagnostic molecular biomarkers.
Keywords: Autism, genetics, genomics, CNV, systems biology
1. Introduction
The impairment seen in children with ASDs in social, emotional, and communication skills are clinically evident prior to three years of age (Bailey et al., 1996; Charman & Baird, 2002); they have difficulty interacting with others and their environment. Recent epidemiological data established a marked increase in prevalence. According to the Center for Disease Control and Prevention (CDC), an average of 1 in 90-100 children in the U.S has ASDs. This increased prevalence is ascribed to many factors such as improved diagnosis, changes in diagnostic criteria, environmental insults, and other factors. Though ASDs was described more than 67 years ago (Kanner, 1943), the diagnosis is still based on behavioral factors, such as ADI-R and ADOS (Lord et al., 2001) assessments. Dependent on clinical criteria, and geographic location, the prevalence of ASDs may vary from 0.05 to 0.6% (Bryson et al., 2003; Fombonne, 2003). Males are four times more susceptible than females. Studies on monozygotic and dizygotic twins suggest ASDs may be regulated by multiple genetic factors (Crespi & Badcock, 2008; Geschwind, 2009), and follow a multifactorial inheritance pattern (Veenstra-Vanderweele et al., 2004). Existing interventions include behavioral therapy targeted at enhancing communication and social interaction skills (Vismara & Rogers, 2010), and medications for anxiety, depression and anti-psychotic conditions (Malone et al., 2005). However, the response to these treatments is limited (Malone et al., 2005; Posey et al., 2008).
Advances in genome technology provided new ways to examine the complexity of ASDs. Large population genome-wide association studies (GWAS), and copy number variation (CNV) technologies have led to identification of multiple genetic hotspots for ASDs (Glessner et al., 2009; Ma et al., 2009; Merikangas et al., 2009; Pinto et al., 2010; Wang et al., 2009; Weiss et al., 2009). Expression microarray analysis revealed ASDs candidate genes that could result from the interaction of genetic background and environmental factors (Enstrom et al., 2009; V. W. Hu et al., 2009; Walker et al., 2006). However, the evidence for ASDs pathogenesis is still inconclusive, largely because of heterogeneity of patient populations and diverse model systems employed among different studies. The fragmented data presented in these studies may therefore only represent a subset of pathways or genes affected in certain ASDs groups, which hinders a comprehensive understanding of ASDs. To better understand the underlying mechanisms of ASDs, we attempted to identify regulatory relationships, genetic contributions and susceptible targets through integrative gene network analysis. We not only considered clinical evidence characteristic of ASDs, but also assembled evidence from genome-wide genetics and expression studies. Finally we applied CNV-centric Node Network (CNN) analysis to analyze potential genetic contributors to ASDs based on DNA copy number variation (CNV) and expression data from high-throughput genomic assays, which explore novel molecular interactions in ASDs patients.
2. Methods
2.1 Clinical evidence–based gene search
Based on our clinical observations (over 150 patients evaluated over an 8 year span) and recent expert reviews on ASDs (Crespi & Badcock, 2008; Geschwind, 2009), seven phenotypic features are suggested. These include 1. Impaired social interaction; 2. Repetitive behavior; 3. Obsessive behavior; 4. Impaired communication; 5. Intellectual disability, 6. Sensory abnormalities and 7. Restricted interests. Psychotic-spectrum conditions were excluded. Genes related to these features were primarily retrieved from the curated biological knowledge database from Ingenuity (Ingenuity Systems, Mountain View, CA) and GeneGo (GeneGo, St Joseph, MI) and context-based database by HuGE navigator (Yu et al., 2008). Gene search by gene ontology term-based database were also applied using AmiGO (Carbon et al., 2009). Functional genomic evidence-based gene retrieval was obtained through recent genetic studies from GWAS (Ma et al., 2009; Ronald et al., 2010; Wang et al., 2009; Weiss et al., 2009), CNV (Pinto et al., 2010) and transcriptome studies using lymphoblastic cells (Valerie W. Hu et al., 2009; V. W. Hu et al., 2009). For microarray expression data, raw data were applied and re-normalized with the RMA method. Differentially expressed gene sets for ASDs were determined by one-way ANOVA with pair-wise contrast of ASDs to control group using Partek genomic suite (Partek, St. Louis, MO). Lists of genes with significant differences based on the above contrasts were created using a false discovery rate (FDR, step-up method) of 0.01 to determine the adjusted p-value. A p-value of less than 0.01 was taken as significant.
2.2 Gene network construction
Ingenuity pathway analysis (IPA)
Integrated gene network analysis of the gene set exhibiting significant expression changes were generated by Ingenuity Pathways Analysis (Version 6, Ingenuity® Systems, www.ingenuity.com). Each gene identifier was mapped to its corresponding gene object in the Ingenuity Pathways Knowledge Base. The differential gene list was overlaid onto a global molecular network developed from information contained in the Ingenuity Pathways Knowledge Base. Networks of these focus genes were then algorithmically generated based on their connectivity. The functional analysis identified the biological functions and/or diseases that were most significant to the data set. Fischer’s exact test was used to calculate a p-value determining the probability that each biological function and/or disease assigned to that data set is due to chance alone. A p-value of less than 0.01 was considered significant.
2.3 CNV-centric Node Network (CNN) analysis
CNVs feature small deletions and duplications of chromosomes. Such genetic alterations could be transmitted through inherited (parental or maternal) or non-inherited (de novo) mechanisms. Recent studies have suggested that CNVs could affect gene functions implicated in the pathophysiology of ASDs. To visualize the gene network from this genetic evidence, gene sets from a recent ASD CNV study were (Pinto et al., 2010) used (Supplementary table 2). Gene networks were first constructed by the pathway common evidence in Cytoscape software. To represent sex distribution and corresponding number associated with the CNV in the network, we applied an enrichment map approach to show the relative sex composition, followed by annotation with microarray expression data showing the relationship of genetic and expression data. The calculation is based on the Jaccard coefficient and overlap coefficient method previously published (Merico et al., 2010). In contrast to the original algorithm design, the up or down state of expression data combined with genetic outcomes in CNV analysis. CNN first considers the gene set collection defined by genetic contributions through classification of inherited (parental or maternal) or non-inherited (de novo) mechanisms, followed by significance calculation. Significant CNVs were then clustered based on biological evidence derived from gene ontology terms or the curated biological pathway database to generate hierarchically-organized gene-set collections. The clusters were then annotated with gene expression data associated with the given CNV to see if any concordant pattern could be identified. This is based on the profile of a weight matrix that compares the frequency association of the expression to a particular conserved CNV feature. The networks were generated using enrichment map Cytoscape plugin (Merico et al., 2010). A weight matrix with p-values less than 0.005 was used. Intergenic and non-coding regions were ignored in the calculation. The modified Cytoscape plugin source code for CNN is freely available upon request.
3. Results and Discussion
3.1 Gene networks from clinical observations of ASDs patients
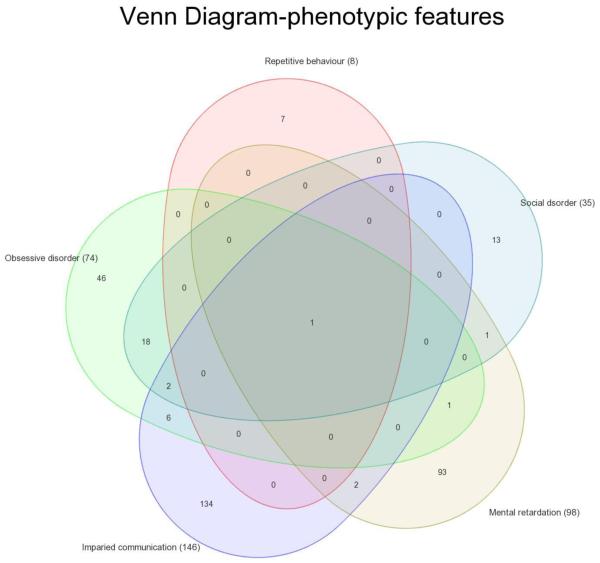
We postulate that ASDs are a symptom complex characterized, in part, by lack of social drive. Based on published literature (Crespi & Badcock, 2008; Geschwind, 2009) and our clinical observations (Table 1), ASDs features include: 1. Impaired social interaction; 2. Repetitive behavior; 3. Obsessive behavior; 4. Impaired communication; 5. Intellectual disability, 6. Sensory abnormalities and 7. Restricted interests. We utilized fundamental neurobehavioral symptoms related to social drive and communication/vocalization for our analysis, and excluded seizures, and severe intellectual disability as central components. This approach agrees with clinical observations by other groups (Crespi & Badcock, 2008; Geschwind, 2009). Our criteria were utilized to contrast with “Autism sib” components analyzed in a recent gene network study (Wall et al., 2009), which may have potentially included overlapping features with other neurological disorders. Genes associated with observed clinical features were then retrieved from the curated biological knowledge database from Ingenuity (Ingenuity Systems, Mountain View, CA) and GeneGo (GeneGo, St Joseph, MI), and the context-based database HuGE navigator (Yu et al., 2008) (Supplementary Table. 1). Impaired social interaction, repetitive behavior and impaired communication were the common components of all studies. By overlaying symptom-related genes using a Venn diagram approach, we examined whether any genes were functional for all the symptoms in our criteria (Fig. 1). Only SLC6A4/HTT, a serotonin transporter, fulfilled this criterion, suggesting a potential central role in ASDs pathogenesis. Serotonin (5-hydroxytryptamine; 5-HT) is a neurotransmitter in the central and peripheral nervous system. Serotonin transporter plays a crucial role in synaptic neurotransmission by retrieving released serotonin and regulation of neuronal activity through facilitating the homeostatic balance of neurotransmitters in the synaptic cleft. Neurological disorders such as obsessive-compulsive disorder and anxiety associate with coding and promoter sequence polymorphism, while altered expression has been correlated with amyotrophic lateral sclerosis, a neurodegenerative disease caused by degeneration of motor neurons, andassociated with immune activation of proinflammatory cytokines like TNF and IL-6, astroglial cells, macrophages and monocytes. Interestingly, abnormal levels of these cytokines have been reported in cerebrospinal fluid (Pardo et al., 2005) and brain tissue (Li et al., 2009) from an autism patient with motor skill deficits. Recent studies suggested SLC6A4/HTT might be a candidate gene for autism based on the association of hyperserotonemia with autism (Coutinho et al., 2004). Autism patients have been treated with selective serotonin re-uptake inhibitors which appears to reduce repetitive and aggressive behavior (Posey et al., 2008). These observations add plausibility to the potential applicability of our symptom-based approach.
Table 1. PhenotvDic observations of A5D patients.
| Crespi et al. | Geschwind et al. | Rennert et al. | |
|---|---|---|---|
| Impaired social interaction | * | * | * |
| Repetitive behavior | * | * | * |
|
|
|||
| Obsessive behavior | * | * | |
|
|
|||
| Impaired communication | * | * | * |
|
|
|||
| Intel ectua disability | * | ||
|
|
|||
| Sensory abnormalities | * | ||
| Restricted interests | * | ||
N.D= Wot determined.
Figure 1.
Venn diagram on genes derived from ASDs phenotype features through clinical observations. Genes related to corresponding phenotypic features were retrieved from HuGO, GeneGO and Ingenuity databases (See methods, Supplementary Table 1). To look for genes commonly represented in these features, gene symbols associated with each ASDs features were compared using Venn diagram approach to examine the overall gene distribution pattern in ASDs.
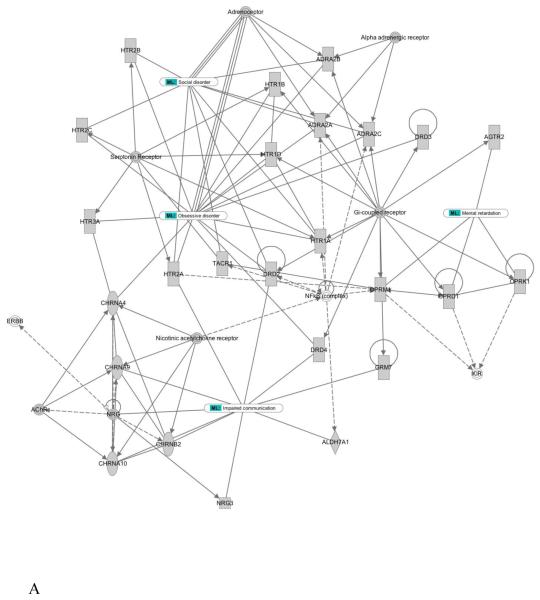
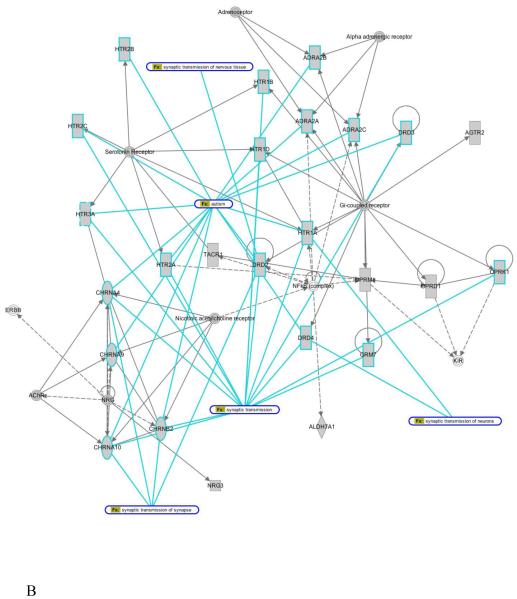
In addition to gene mining, we examined molecular interactions based on clinical features. Gene network analysis of phenotype-derived gene sets yielded seventeen gene networks (Supplementary Fig. S1). To reveal potential functional implications in a gene network, input genes or other biological elements, known as nodes, were parsed to the phenotypic feature and functional biological processes. This resulted in identification of gene network connections not previously related to the phenotype/symptom and permitted postulation of molecular mechanisms/signature pathways that may be operative in ASDs. For example, network 1 (Fig. 2A) consisted of nodes from four phenotypic features, which were tightly linked to each other through central key nodes. These key nodes may be viewed as key regulatory elements; changes in them might lead to widespread effects in down-stream genes and interacting key nodes. These included serotonin receptor, neuregulin (NRG), G-protein coupled receptors and NF-kappaB (NF-κB) complex (Fig. 2A). Functional association analysis of the network nodes by ingenuity pathway analysis (IPA) identified extensive association with synaptic transmission and the synapse (Fig. 2B). The functional associations were correlated with multiple phenotypic features previously observed in ASDs. For example, synaptic transmission contained elements for cholinergic receptors (CHRNA) that have been reported in families with impaired communication, and the dopamine receptor (DRD2) was identified in families with obsessive and social disorders. These findings are consistent with the central role of synaptic formation and connectivity for cognitive development (Wang et al., 2009). Altered synaptic growth, as evidenced by the impact of mutations in NLGN/SHANK/NRXN and mTOR/PI3K pathways may also contribute to this phenomenon.
Figure 2. Phenotype-derived gene network example.
(A and B) Trace on symptoms and cellular function from network 1 of the seventeen networks is presented. The network contained four the clinical criteria defined in Supplementary Table 1, and shows the corresponding contribution in the network. Importantly, cellular functions showed multiple network node involvements (blue line traces). This allows better understanding of underlying signaling contribution and associated symptoms in a given cellular function or disease.
Next, we attempted to determine if common gene regulators (central node) are involved in controlling these pathways. Key central regulators involving different neurological functions were identified (Supplementary Fig. S1). These included brain derived neurotrophic factor (BDNF) and methyl CpG binding protein 2 (MECP2) in network 2, transforming growth factor (TGF), collagen gene family related pathways in network 3, epidermal growth factor (EGF) in network 6. The identified networks were involved in a wide variety of neurological functions, including synaptic related functions (network 2, 4, 5, 6, 10, 14); growth of neurons or brain cells (network 2, 3, 5, 9, 11, 13); neurotransmission (network 4, 9 and 16); activation and adhesion of brain cells (network 14); and neuritis (network 10 and 15) (Supplementary Fig. S1). For example, network 3 suggested TGF-β (a key central regulator) not only regulated Monoamine oxidase A (MAOA) directly, but also via linked partners (Dwyer & Winckler, 2010). MAOA is involved in axon guidance and related functions. Aberrant MAOA function has been identified in several psychiatric disorders and exhibits a significant prevalence in male patients similar to the male prevalence observed in patients with autism and attention deficit/hyperactive disorder (ADHD). TGF-β was also suggested in auditory perception function through the COLA1, USH1C/G, CDH23, MYO7A, PCDH15 gene cluster; this potential relationship might be related to the speech and language pathologies seen in ASDs patients (Schonweiler et al., 1998). We also found a significant association with autism (Network 1, 2, 4, 6 and 16), suggesting these network elements and biological processes are highly related to clinical features associated with ASDs. In addition to de novo gene network analysis, the input gene set was analyzed with associated canonical pathways in the IPA database. Canonical pathways are those well characterized metabolic and cell signaling pathways generated based on the reported literature. The ratio and p-value of input genes contained in each pathway were calculated. The top five pathways included glutamate receptor signaling, circadian rhythm signaling, serotonin receptor signaling, amyotrophic lateral sclerosis signaling and G-protein coupled receptor signaling (Supplementary Fig. S2). These pathways have previously been associated with ASDs. For example, CNV of the glutamate receptor family is linked to ASDs in various studies (Cusco et al., 2009; Serajee et al., 2003). Recent microarray studies suggest circadian rhythm dysfunction may be seen in severe autism (V. W. Hu et al., 2009). Glutamate is important in circadian rhythm signaling (canonical pathway with the second highest ratio of input genes), through N-methyl-D-aspartic acid (NMDA) receptor activation.
3.2 Generation of genomic data-based gene networks
Next, we attempted to re-engineer the gene networks through functional genomic evidence-based gene retrieval. All were derived from recent whole-genome genetic and genomic studies, namely, GWAS (Ma et al., 2009; Ronald et al., 2010; Wang et al., 2009; Weiss et al., 2009) CNV (Pinto et al., 2010) and transcriptome studies using lymphoblastic cells (Valerie W. Hu et al., 2009). Four genes including cadherin (CDH9), cadherin 10 (CDH10), semaphorin 5A (SEMA5A), taste receptor, type 2, member 1 (TAS2R1) were significantly associated with ASDs in GWAS studies. These genes were all located in close proximity on chromosome 5p14 (CDH9/10 at 5p14.1; SEMA5A/TAS2R1 at 5p14.2). Similar functional relationships were identified in our phenotypic feature-based networks. These included axonal regulation by SEMA5 (network 3 and 15, Supplementary Fig. S1) and cell adhesion function by CDH9/10 (network 14, Supplementary Fig. S1). Due to the limited number of genes identified in GWAS studies, we were not able to construct gene networks. However, by utilizing implicated gene functions we identified functions in our gene network “phenotypic observation” dataset. For example, SEMA5A is involved in axonal guidance and connections; this pathway may affect the formation of functional synapses29. As mentioned previously, our results indicated synaptic dysfunction could be an etiologic mechanism in ASDs; this was supported by identification of altered synaptic cell-adhesion function in NLGN3 and NLGN4 mutations (Kumar & Christian, 2009). Altered adhesion function was also associated with other GWAS genes CDH9/10. Therefore, dysregulated synaptic connection and/or adhesion may be a key feature in ASDs.
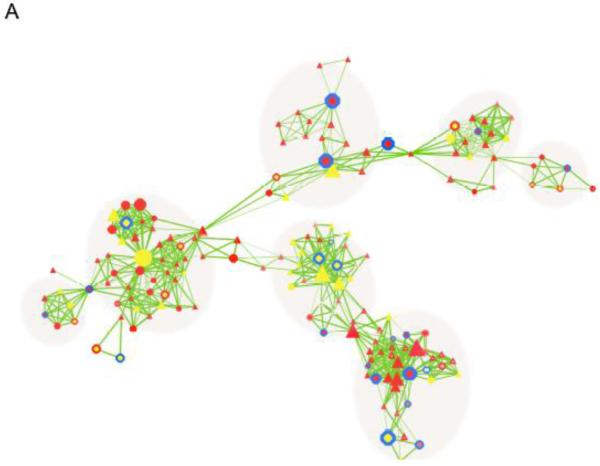
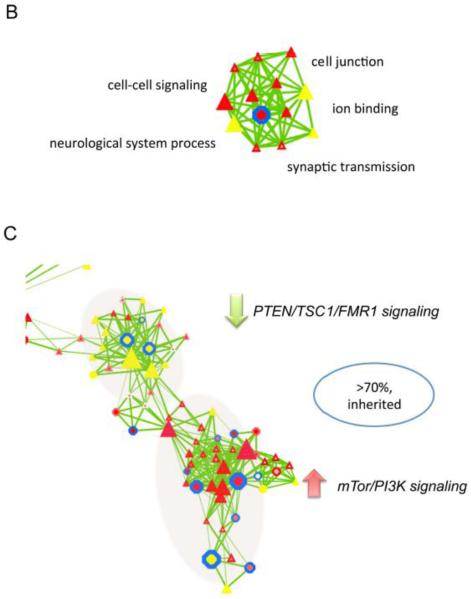
To analyze the qualitative nature of CNV dataset, we developed the CNV-centric Node Network (CNN) method to depict gene network clusters based on significant genetic association with biological functions and functional genomic data (Supplementary Fig. S3). This allowed a dynamic representation of CNV data as compared to the conventional static data presentation format. CNV genes that were significant in functional clusters were compared to published expression data in an effort to relate it to their amplification or deletion status. A total of 270 known genes showed unique CNVs with significant combined p-values in ASDs patients (Fig. 3A, supplementary table. 2). CNN revealed seven functional clusters. Some were noted in our level 1 analysis. For example, synaptic transmission and neural system function represented by neurexin 1 (NRXN1), dystrophin, discs, large (Drosophila) homolog-associated protein 2 (DLGAP2) and interleukin 1 receptor accessory protein-like 1 (L1RAPL1) appeared in a CNN sub-cluster, further supporting its functional importance in ASDs (Fig. 3B). Importantly, this cluster was predominantly associated with male populations (Triangular nodes).
Figure 3. CNV-centric Node Network (CNN) analysis on ASDs genetic data.
CNV-centric Node Network (CNN) analysis on ASDs genetic data. (A) Overview of CNN network. Significant association between CNV and expression data were constructed through incorporating molecular interaction network and pathway information. CNVs with affected males only were shown in the nodes as triangles, while female was circles. The size of node corresponds to the number of cases observed in the CNV data. Mixed sexes were shown as hexagons. Red nodes suggested expression is up while, yellow is down. Legends are provided in the supplementary figure. (B) Significant function contained in the CNN gene network cluster shows gene functions and (C) individual signaling clusters with consistent up (mTor/PI3K) or down-regulation (PTEN/TSC1/FMR1) of gene expression. Gene nodes legend for CNN can be found in Supplementary Fig. 3.
We examined whether there was any association between data from genetic and transcriptional analysis. To reduce the bias from different data sources, re-normalized microarray expression data from ASDs studies were applied to the CNN clusters for correlation calculation (See methods). Although we did not observe significant relationships in the majority of CNN clusters, concordant CNV characteristics and expression patterns were found in some CNN sub-clusters within mapped pathways. Genes showing duplication and increased expression patterns were found in the PTEN/TSC1/FMR1 signaling cluster, whereas genes with deletions and reduced expression were related to the mTor/PI3K signaling pathways. Both clusters contained CNVs that were primarily related to inherited mechanisms (>70%, Fig. 3C), whereas de novo CNV associated clusters were also found in TNF-related pathways (>70%).
3.3 Comparison of phenotype and genomic data-based gene networks
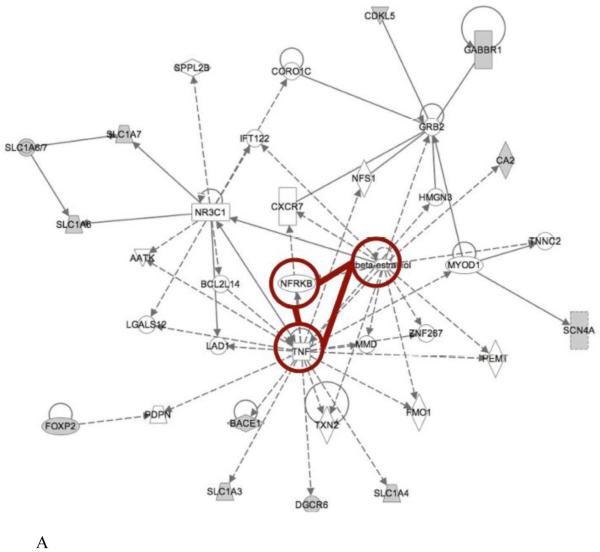
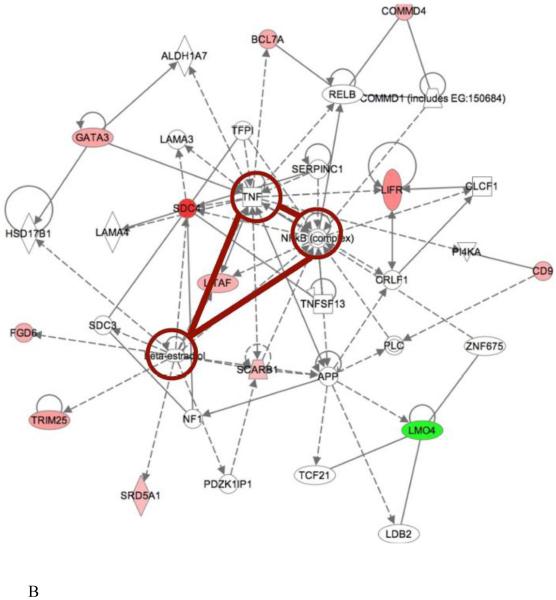
Other than genetic-expression analysis by CNN, we also compared ASDs expression-gene networks to the gene networks derived from phenotypic features as determined by IPA. We identified common regulatory pathways or nodes that were shared by both. TNF, NF-κB complex and beta-estradiol related pathways were commonly present in one of the networks from both levels (Fig. 4). TNF decreases serotonin transporter function; since serotonin related pathways had been correlated with the phenotype and gene-derived networks, this would be an expected outcome. We were not surprised to see NF-κB as a potentially relevant molecule because it is a universal transcription factor involved in numerous cellular processes. But we were intrigued to see beta-estradiol related effects. It is a molecule that was suggested by IPA after assembling the input gene data relationships. Beta-estradiol is involved in neuroprotective and neurotropic functions of central nervous system (CNS) that are mediated by estrogen receptor signaling cascades. It activates key signaling pathway candidates identified in this study, such as PI3K and MAPK pathways that are important in neuronal survival. It may be formed from prenatal testosterone and has been reported to promote male-typical behavior (Collaer & Hines, 1995). Whether it relates to the higher male prevalence in ASDs is not clear.
Figure 4. Comparison of phenotype and expression data derived network.
Comparison of phenotype and expression data derived network. Gene networks generated from phenotype data and transcriptome data were compared to identify regulators commonly involved in both approaches. TNF, beta-estradiol and NF-kappaB related signaling pathways were present in both analyses. (A) Network 1 and (B) network 2 demonstrated distinctive gene neighbors potentially regulated by these three regulators.
4. Conclusions
Our gene network approach provides an innovative method to dissect the molecular mechanisms of ASDs. Curated gene network and CNN analysis of different published approaches permits formulation of a comprehensive overview of cellular regulation, and provides a framework, beyond the traditional approach, based on a disease-derived method using OMIM and GeneCards to understand the complexity of ASD26. Our results in this analysis of ASDs identify vast interactions far more complex than previously reported. The large number of non-overlapping gene networks revealed in this study may reflect the heterogeneity of ASDs (Table. 2). This approach may be useful to dissect the molecular mechanisms operative in autism. Development of a more comprehensive molecular atlas of ASDs requires integration of other lines of molecular evidence, such as protein-DNA/RNA interactions, protein-protein interactions, RNA-RNA interactions, and others. Epigenetic modifications of DNA/histone through methylation or acetylation may be important players in the pathogenesis of autism since they can act trans-generationally, and interact with metabolites and various environmental factors. This study is a beginning effort to prioritize molecular interactions and requires follow-up experimentation for validation. The real challenge is to find the meaningful and important connections derived from the networks by careful design of in-vitro and in-vivo experiments.
Table 2. Overview of over-represented neurological related functions in all networks.
| Over-represented biological functions |
P-value (Lowest/Highest) |
Phenotype- based Network |
CNN network cluster |
Genes | Regulations | Potential effects in ASD patients |
|---|---|---|---|---|---|---|
| Synaptic functions | 6.7E-12/8.32E-3 | |||||
| 1 | 4 | Serotonin receptors (HTRx), |
In hippocampal cells, mouse Serotonin receptor protein(s) activates MAPK pathways, G-Protein Coupled Receptor Signaling. |
G(i)-coupled receptors. Serotonin is found in excess in the blood of ASD children as a relatively reliable element in them although in around 60%. Binding of brain serotonin and dopamine transporters is lower in ASD. Reduced aggression in ASD with agonist drug. |
||
| 1 | Opioid receptor, kappa 1(OPT) |
cAMP-mediated Signaling, G-Protein Coupled Receptor Signaling. |
Shows sex-difference in NMDA-mediated dopamine release. |
|||
| 1,5,6 | Glutamate receptor | cAMP-mediated Signaling; CREB Signaling in Neurons; Glutamate Receptor Signaling; G-Protein Coupled Receptor Signaling. |
Known to involve synaptic transmission in human and mouse. Increased expression increases synaptic transmission of synapse. |
|||
| 1,10 | 4 | Dopamine receptor (DRD) |
Activationn decreases synaptic transmission of interneurons in rat prefrontal cortex. |
|||
| 1 | 6 | Cholinergic receptor (CHRNA) |
Up-regulated by Neuregulin (NRG) | |||
| 1,2 | Brain-derived neurotrophic factor (BDNF) |
Induced by cortical neurons. | Borna disease virus infection resulted in severely impaired BDNF-dependent synaptogenesis. Mutant mouse BDNF in mouse increases synaptic fatigue of synapse in neuron. Important in differentiation of neuronal progenitor cells, neurons. Mutant human BDNF protein increases abnormal cognitive activation of hippocampus and associate with various neurological disorders. Increased expression in serum in ASD patients. |
|||
| 2 | Methyl CpG binding protein (MECP2) |
MECP2 is X-linked and subject to X inactivation. Activatiation by cyclin- dependent kinase-like 5 (CDKL5). |
Involved in mouse synaptogenesis. Mutations and deletions of MECP2 reported in Rett syndrome, X-linked mental retardation. Mutation of CDKL5 reported to show profound intellectual and speech impairment. |
|||
| 4 | Oxytocin (OXT) and its receptor (OXTR) |
Regulated by estrogen, prazosin, retinoic acid. |
Oxytocin is posterior pituitary hormone. Involves in cognition, tolerance, adaptation and complex sexual and maternal behavior. Rat Oxt increases synaptic transmission of synapse. |
|||
| 4 | Sodium channel, voltage-gated, type I and II (SCN1/2B) |
Dopamine signaling pathways. |
Voltage-gated sodium channels are heteromeric proteins that function in the generation and propagation of action potentials in muscle and neuronal cells. Mutations lead to disrupted synaptic transmission. |
|||
| 5 | Neurotrophic tyrosine kinase, receptor (NTRK) |
Induced by neurotrophin and BDNF pathways. |
Important in neural cell differentiation and may play a role in specifying sensory neuron subtypes. |
|||
| Huntingtin (HTT) |
Huntingtin is a disease gene linked to Huntington’s disease, a neurodegenerative disorder characterized by loss of striatal neurons. It also involves in synaptic transmission in neurons. |
|||||
| 6 | 4 | Solute carrier family 1 (neuronal/epithelial/ glial high affinity glutamate transporter), member 1 (SLC1A1/3) |
Glutamate signaling pathways. |
SLC1A1/3 involves in synaptic transmission in human and mouse models. |
||
| 6 | Myosin VI (MYO6) | TP53 and Clathrin signaling. | Mouse Myo6 is involved in synaptogenesis. Mutation links to recessive hearing loss. |
|||
| 10 | Kinesin family member 1B (KF1B) |
Retinoic acid signaling and L-triiodothyronine. |
Encodes a motor protein that transports mitochondria and synaptic vesicle precursors. |
|||
| 10 | Potassium large conductance calcium-activated channel, subfamily M, alpha member 1 (KCNMA1) |
Beta-estradiol signaling pathways. |
Mouse Kcnma1 is involved in synaptic transmission. It also controls neuronal excitability. |
|||
| 10 | Myelin protein zero (MPZ) |
TGFB signaling pathways. | Human MPZ is involved in synaptic transmission. It also encodes a major structural protein of peripheral myelin. |
|||
| Neurotransmission | 8.1E-9/6.782E-4 | |||||
| 4 | Sodium channel, voltage-gated, type IA (SCN1A) |
Dopamine signaling pathways. |
Mouse SCN1A is involved in action potential of cells. | |||
| 9 | Potassium voltage- gated channel (KCNx) |
MicroRNA133 family. | Depolarization and action potential in neuron. Increased expression decreases synaptic transmission. |
|||
| 9 | 4 | Neuregulin 1 (NRG1) |
BDNF signaling pathways. | Involves in transmission of neurons. Mutations and deletions linked to ASD. Deletions and variations found in ASD. |
||
| 16 | 6 | Solute carrier family 6 (neurotransmitter transporter, noradrenalin), member 2/4 (SLC6A2/4) |
Serotonin signaling pathways. |
Belongs to serotonin transporter gene family. Mouse SLC6A2/4 is involved in transport of neurotransmitter. CNV and GWAS alterations in ASD. |
||
| Axonal regulation | 4.3E-6/7.8E-4 | |||||
| 3 | Monoamine oxidase A (MAOA) |
TGFB signaling pathways. | Encodes monoamine oxidase A, an enzyme that degrades amine neurotransmitters, such as dopamine, norepinephrine, and serotonin |
|||
| 15 | POU class 4 homeobox 2/3 (POU4F2/3) |
MicroRNA144, 23A, 290. | Affect development of axons in ganglion cells. | |||
| 15 | Protein tyrosine phosphatase, non- receptor type 11 (PTPN11) |
IL-6 and EGF signaling pathways. |
Mouse PTPN11 is involved in axon development. |
Supplementary Material
Highlights.
-
>
We analyzed clinical features and recent genomic data on Autism Spectrum Disorders.
-
>
We attempted to identify novel gene regulations in ASDs by meta-analysis approach.
-
>
Gene and CNV-centric Node network analyses identified novel targets and regulations.
-
>
The data provides novel postulations, and hints on diagnostic molecular biomarkers.
Acknowledgements
This work was supported by the Intramural Research Program of Eunice Kennedy Shriver National Institute of Child Health and Human Development, National Institutes of Health.
Abbreviations
- CNV
copy number variation
- GWAS
genome wide association study
- SNP
single nucleotide polymorphism
- CNN
CNV-centric node network
Footnotes
Publisher's Disclaimer: This is a PDF file of an unedited manuscript that has been accepted for publication. As a service to our customers we are providing this early version of the manuscript. The manuscript will undergo copyediting, typesetting, and review of the resulting proof before it is published in its final citable form. Please note that during the production process errors may be discovered which could affect the content, and all legal disclaimers that apply to the journal pertain.
References
- Bailey A, Phillips W, Rutter M. Autism: towards an integration of clinical, genetic, neuropsychological, and neurobiological perspectives. Journal of child psychology and psychiatry, and allied disciplines. 1996;37:89–126. doi: 10.1111/j.1469-7610.1996.tb01381.x. [DOI] [PubMed] [Google Scholar]
- Bryson SE, Rogers SJ, Fombonne E. Autism spectrum disorders: early detection, intervention, education, and psychopharmacological management. Can J Psychiatry. 2003;48:506–516. doi: 10.1177/070674370304800802. [DOI] [PubMed] [Google Scholar]
- Carbon S, Ireland A, Mungall CJ, Shu S, Marshall B, Lewis S. AmiGO: online access to ontology and annotation data. Bioinformatics. 2009;25:288–289. doi: 10.1093/bioinformatics/btn615. [DOI] [PMC free article] [PubMed] [Google Scholar]
- Charman T, Baird G. Practitioner review: Diagnosis of autism spectrum disorder in 2- and 3-year-old children. Journal of child psychology and psychiatry, and allied disciplines. 2002;43:289–305. doi: 10.1111/1469-7610.00022. [DOI] [PubMed] [Google Scholar]
- Collaer ML, Hines M. Human behavioral sex differences: a role for gonadal hormones during early development? Psychol Bull. 1995;118:55–107. doi: 10.1037/0033-2909.118.1.55. [DOI] [PubMed] [Google Scholar]
- Coutinho AM, Oliveira G, Morgadinho T, Fesel C, Macedo TR, Bento C, et al. Variants of the serotonin transporter gene (SLC6A4) significantly contribute to hyperserotonemia in autism. Molecular psychiatry. 2004;9:264–271. doi: 10.1038/sj.mp.4001409. [DOI] [PubMed] [Google Scholar]
- Crespi B, Badcock C. Psychosis and autism as diametrical disorders of the social brain. Behavioral and Brain Sciences. 2008;31 doi: 10.1017/S0140525X08004214. [DOI] [PubMed] [Google Scholar]
- Cusco I, Medrano A, Gener B, Vilardell M, Gallastegui F, Villa O, et al. Autism-specific copy number variants further implicate the phosphatidylinositol signaling pathway and the glutamatergic synapse in the etiology of the disorder. Human Molecular Genetics. 2009;18:1795–1804. doi: 10.1093/hmg/ddp092. [DOI] [PMC free article] [PubMed] [Google Scholar]
- Dwyer ND, Winckler B. TGF-β Receptors PAR-ticipate in Axon Formation. Cell. 2010;142:21–23. doi: 10.1016/j.cell.2010.06.024. [DOI] [PubMed] [Google Scholar]
- Enstrom A, Lit L, Onore C, Gregg J, Hansen R, Pessah I, et al. Altered gene expression and function of peripheral blood natural killer cells in children with autism. Brain, Behavior, and Immunity. 2009;23:124–133. doi: 10.1016/j.bbi.2008.08.001. [DOI] [PMC free article] [PubMed] [Google Scholar]
- Fombonne E. The prevalence of autism. JAMA. 2003;289:87–89. doi: 10.1001/jama.289.1.87. [DOI] [PubMed] [Google Scholar]
- Geschwind DH. Advances in autism. Annu Rev Med. 2009;60:367–380. doi: 10.1146/annurev.med.60.053107.121225. [DOI] [PMC free article] [PubMed] [Google Scholar]
- Glessner JT, Wang K, Cai G, Korvatska O, Kim CE, Wood S, et al. Autism genome-wide copy number variation reveals ubiquitin and neuronal genes. Nature. 2009;459:569–573. doi: 10.1038/nature07953. [DOI] [PMC free article] [PubMed] [Google Scholar]
- Hu VW, Nguyen A, Kim KS, Steinberg ME, Sarachana T, Scully MA, et al. Gene Expression Profiling of Lymphoblasts from Autistic and Nonaffected Sib Pairs: Altered Pathways in Neuronal Development and Steroid Biosynthesis. PLoS ONE. 2009;4:e5775. doi: 10.1371/journal.pone.0005775. [DOI] [PMC free article] [PubMed] [Google Scholar]
- Hu VW, Sarachana T, Kim KS, Nguyen A, Kulkarni S, Steinberg ME, et al. Gene expression profiling differentiates autism case-controls and phenotypic variants of autism spectrum disorders: evidence for circadian rhythm dysfunction in severe autism. Autism Res. 2009;2:78–97. doi: 10.1002/aur.73. [DOI] [PMC free article] [PubMed] [Google Scholar]
- Kanner L. Autistic disturbances of affective contact. Nerv Child. 1943;2:217–250. [PubMed] [Google Scholar]
- Kumar RA, Christian SL. Genetics of autism spectrum disorders. Current neurology and neuroscience reports. 2009;9:188–197. doi: 10.1007/s11910-009-0029-2. [DOI] [PubMed] [Google Scholar]
- Li X, Chauhan A, Sheikh AM, Patil S, Chauhan V, Li XM, et al. Elevated immune response in the brain of autistic patients. J Neuroimmunol. 2009;207:111–116. doi: 10.1016/j.jneuroim.2008.12.002. [DOI] [PMC free article] [PubMed] [Google Scholar]
- Lord C, Leventhal BL, Cook EH., Jr. Quantifying the phenotype in autism spectrum disorders. Am J Med Genet. 2001;105:36–38. [PubMed] [Google Scholar]
- Ma D, Salyakina D, Jaworski JM, Konidari I, Whitehead PL, Andersen AN, et al. A genome-wide association study of autism reveals a common novel risk locus at 5p14.1. Ann Hum Genet. 2009;73:263–273. doi: 10.1111/j.1469-1809.2009.00523.x. [DOI] [PMC free article] [PubMed] [Google Scholar]
- Malone RP, Gratz SS, Delaney MA, Hyman SB. Advances in drug treatments for children and adolescents with autism and other pervasive developmental disorders. CNS Drugs. 2005;19:923–934. doi: 10.2165/00023210-200519110-00003. [DOI] [PubMed] [Google Scholar]
- Merico D, Isserlin R, Stueker O, Emili A, Bader GD. Enrichment map: a network-based method for gene-set enrichment visualization and interpretation. PLoS ONE. 2010;5:e13984. doi: 10.1371/journal.pone.0013984. [DOI] [PMC free article] [PubMed] [Google Scholar]
- Merikangas AK, Corvin AP, Gallagher L. Copy-number variants in neurodevelopmental disorders: promises and challenges. Trends in Genetics. 2009;25:536–544. doi: 10.1016/j.tig.2009.10.006. [DOI] [PubMed] [Google Scholar]
- Pardo CA, Vargas DL, Zimmerman AW. Immunity, neuroglia and neuroinflammation in autism. Int Rev Psychiatry. 2005;17:485–495. doi: 10.1080/02646830500381930. [DOI] [PubMed] [Google Scholar]
- Pinto D, Pagnamenta AT, Klei L, Anney R, Merico D, Regan R, et al. Functional impact of global rare copy number variation in autism spectrum disorders. Nature. 2010;466:368–372. doi: 10.1038/nature09146. [DOI] [PMC free article] [PubMed] [Google Scholar]
- Posey DJ, Erickson CA, McDougle CJ. Developing drugs for core social and communication impairment in autism. Child Adolesc Psychiatr Clin N Am. 2008;17:787–801. viii–ix. doi: 10.1016/j.chc.2008.06.010. [DOI] [PMC free article] [PubMed] [Google Scholar]
- Ronald A, Butcher LM, Docherty S, Davis OS, Schalkwyk LC, Craig IW, et al. A genome-wide association study of social and non-social autistic-like traits in the general population using pooled DNA, 500 K SNP microarrays and both community and diagnosed autism replication samples. Behav Genet. 2010;40:31–45. doi: 10.1007/s10519-009-9308-6. [DOI] [PMC free article] [PubMed] [Google Scholar]
- Schonweiler R, Ptok M, Radu HJ. A cross-sectional study of speech- and language-abilities of children with normal hearing, mild fluctuating conductive hearing loss, or moderate to profound sensoneurinal hearing loss. Int J Pediatr Otorhinolaryngol. 1998;44:251–258. doi: 10.1016/s0165-5876(98)00075-5. [DOI] [PubMed] [Google Scholar]
- Serajee FJ, Zhong H, Nabi R, Huq AH. The metabotropic glutamate receptor 8 gene at 7q31: partial duplication and possible association with autism. J Med Genet. 2003;40:e42. doi: 10.1136/jmg.40.4.e42. [DOI] [PMC free article] [PubMed] [Google Scholar]
- Veenstra-Vanderweele J, Christian SL, Cook EH., Jr. Autism as a paradigmatic complex genetic disorder. Annu Rev Genomics Hum Genet. 2004;5:379–405. doi: 10.1146/annurev.genom.5.061903.180050. [DOI] [PubMed] [Google Scholar]
- Vismara LA, Rogers SJ. Behavioral treatments in autism spectrum disorder: what do we know? Annu Rev Clin Psychol. 2010;6:447–468. doi: 10.1146/annurev.clinpsy.121208.131151. [DOI] [PubMed] [Google Scholar]
- Walker SJ, Segal J, Aschner M. Cultured lymphocytes from autistic children and non-autistic siblings up-regulate heat shock protein RNA in response to thimerosal challenge. NeuroToxicology. 2006;27:685–692. doi: 10.1016/j.neuro.2006.06.003. [DOI] [PubMed] [Google Scholar]
- Wall DP, Esteban FJ, Deluca TF, Huyck M, Monaghan T, Velez de Mendizabal N, et al. Comparative analysis of neurological disorders focuses genome-wide search for autism genes. Genomics. 2009;93:120–129. doi: 10.1016/j.ygeno.2008.09.015. [DOI] [PubMed] [Google Scholar]
- Wang K, Zhang H, Ma D, Bucan M, Glessner JT, Abrahams BS, et al. Common genetic variants on 5p14.1 associate with autism spectrum disorders. Nature. 2009;459:528–533. doi: 10.1038/nature07999. [DOI] [PMC free article] [PubMed] [Google Scholar]
- Weiss LA, Arking DE, Daly MJ, Chakravarti A. A genome-wide linkage and association scan reveals novel loci for autism. Nature. 2009;461:802–808. doi: 10.1038/nature08490. [DOI] [PMC free article] [PubMed] [Google Scholar]
- Yu W, Wulf A, Yesupriya A, Clyne M, Khoury MJ, Gwinn M. HuGE Watch: tracking trends and patterns of published studies of genetic association and human genome epidemiology in near-real time. European journal of human genetics: EJHG. 2008;16:1155–1158. doi: 10.1038/ejhg.2008.95. [DOI] [PubMed] [Google Scholar]
Associated Data
This section collects any data citations, data availability statements, or supplementary materials included in this article.


