Abstract
The inter-relationships between our diets and the structure and operations of our gut microbial communities are poorly understood. A model community of ten sequenced human gut bacteria was introduced into gnotobiotic mice, and changes in species abundance and microbial gene expression were measured in response to randomized perturbations of four defined ingredients in the host diet. From the responses, we developed a statistical model that predicted over 60% of the variation in species abundance evoked by diet perturbations, and were able to identify which factors in the diet best-explained changes seen for each community member. The approach is generally applicable as shown by a follow-up study involving diets containing various mixtures of pureed human baby foods.
Owing to its many roles in human health (1–3), there is great interest in deciphering the principles that govern the operations of an individual’s gut microbiota. Current estimates indicate that each of us harbors several hundred bacterial species in our intestine (4, 5) and different diets lead to large and rapid changes in the composition of the microbiota (6, 7). Given the dynamic interrelationship between diet, the configuration of the microbiota, and the partitioning of nutrients in food to the host, inferring the rules that govern the microbiota’s responses to dietary ingredients represents a challenge (8).
Gnotobiotic mice colonized with simple, defined collections of sequenced representatives of the various phylotypes present in the human gut microbiota provide a simplified in vivo model system where metabolic niches, host-microbe, and microbe-microbe interactions can be examined using a variety of techniques (9–12). These studies have focused on small communities exposed to a few perturbations. We used gnotobiotic mice harboring a 10-member community of sequenced human gut bacteria to model the response of a microbiota to changes in host diet. We aimed to predict the absolute abundance of each species in this microbiota based on knowledge of the composition of the host diet. Furthermore, we wanted to gain insights into the niche preferences of members of the microbiota, and to discover how much of the response of the community was a reflection of their phenotypic plasticity.
The ten bacterial species were introduced into germ-free mice to create a model community with representatives of the four most prominent bacterial phyla in the healthy human gut microbiota (13; Fig. S1A). Their genomes encode major metabolic functions that have been identified in anaerobic food webs, including the ability to break down complex dietary polysaccharides not accessible to the host (Bacteroides thetaiotaomicron, Bacteroides ovatus and Bacteroides caccae), consume oligosaccharides and simple sugars (Eubacterium rectale, Marvinbryantia formatexigens, Collinsella aerofaciens, Escherichia coli), and ferment amino acids (Clostridium symbiosum, E. coli). We also included two species capable of removing the end products of fermentation: a H2-consuming, sulfate-reducing bacterium (Desulfovibrio piger) and a H2-consuming acetogen (Blautia hydrogenotrophica).
To perturb this community, we used a series of refined diets where each ingredient represented the sole source of a given macronutrient (casein=protein, corn oil=fat, cornstarch=polysaccharide, and sucrose =simple sugar) and where the concentrations of these four ingredients were systematically varied (Fig. S1B,C and Table S1). Each individually caged male C57Bl/6J mouse was fed a randomly selected diet with diet switches occurring every two-weeks (n=13 animals; Fig. S1D shows the variation of diet presentation between animals). Shotgun sequencing of total fecal DNA allowed us to determine the absolute abundance of each community member, based on assignment of reads to the various species’ genomes, in samples obtained from each mouse on days 1, 2, 4, 7, and 14 of a given diet period (13).
To predict the abundance of each species in the model human gut microbiome given only knowledge of the concentration of each of the four perturbed diet ingredients, we used a linear model,
where yi is the absolute abundance of species i, Xcasein, Xstarch, Xsucrose, and Xoil are the amounts (in g/kg of mouse diet) of casein, corn starch, sucrose, and corn oil respectively in a given host diet, β0 is the estimated parameter for the intercept, and βcasein, βstarch, βsucrose, and βoil are the estimated parameters for each of the perturbed diet components. Since each mouse underwent a sequence of three diet permutations presented in different order, and each of the diet periods covered all of the 11 possible diets (Fig. S1D), we were able to use two of these three diet intervals to fit the model for the equation (13 mice × 2 diets per mouse = 26 samples per bacterial species) and then measured our ability to predict the abundance of each bacterial species for the 13 samples in the remaining (third) diet (13). Averaging this cross-validation from all three subsets, the model explained over 61% of the variance in the abundance of the community members (abundance weighted mean R2 = 0.61; see Table S2 for species-specific R2).
Although the cross-validation provided evidence that the response of this microbiota was predictable from knowledge of these diet ingredients, a more conclusive validation of the model would be its ability to make predictions for new diets. Therefore, we designed six additional diets with new combinations of the four refined ingredients. Using a design similar to the first experiment, eight different 10-week-old gnotobiotic male C57Bl/6J mice harboring the 10-member community were each given a randomized sequence of diets selected from the six new diets (shaded diets L-Q in Fig. S1B), or one of the previous diets (Fig. S1E). Fitting the model parameters with the data from the first experiment, we were able to explain 61% of the variance in the abundance of the community members on the new diets, showing virtually equivalent results to the cross validation procedure (see Table S2).
These results indicate that the linear model explains the majority of the variation in abundance of each organism using only a knowledge of the species in the community and the concentrations of casein, cornstarch, sucrose, and corn oil in the diet, without having to explicitly consider the effects of microbe-microbe or microbe-host interactions, or diet-order. As described in SOM, we also tested several other models including adding interactions between the variables, quadratic terms, and interactions with quadratic terms. After correcting for the number of parameters in the model using Akaike information criterion, the linear model was still the best performing.
To further dissect the community response to these diet perturbations, we need to infer which set of diet ingredients is associated with the abundance of each community member. Feature selection algorithms assume that the response variable (in this case, the abundance of each organism) is potentially affected by only a fraction of the variables in the model, and use statistical methods to choose the subset of variables that most informatively predict the abundance of each species. Using stepwise regression as a feature selection procedure with the equation above, all species in our 10-member community had the diet variable Xcasein significantly associated with their abundance (Table S3).
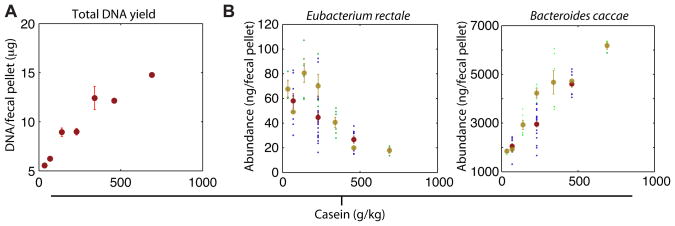
E. coli and C. symbiosum were the only bacteria with more than one variable significantly associated with their abundance (casein and sucrose for E. coli and casein and starch for C. symbiosum). Further exploring this finding, we found casein highly correlated with the yield of total DNA per fecal pellet across all diets (Fig. 1A and Fig. 2). A component of casein, presumably amino acids and/or nitrogen, limits the biomass of the community: this resource limitation was observed even for combinations of three additional refined protein and two additional fat sources (soy, lactalbumin, egg-white solids, olive oil and lard; n=9 different diets given to another group of 9 C57Bl/6J male mice; Fig. S2; Table S4). However, the observed changes in species abundance are not a simple consequence of a constant relative abundance of each community member that is scaled upwards as casein is increased: three community members, E. rectale, D. piger, and M. formatexigens, decreased in absolute abundance by 1.4–2.4 -fold from the low casein to high casein diets even though total community biomass tripled (Fig. 1B,S3; Table S5). Similar changes in species abundance and total community DNA levels were observed when casein concentrations were altered in gnotobiotic mice harboring a 9-member or an 8-member subset of the original community (minus B. hydrogenotrophica or minus D. piger and B. hydrogenotrophica) (Table S6).
Fig. 1.
Total community abundance (biomass) and the abundance of each community member can best be explained by changes in casein. (A) The total DNA yield per fecal pellet increased as the amount of casein in the host diet increased (shown are mean± S.E.M. for each tested concentration of casein). (B) Changes in species abundance as a function of changes in the concentration of casein in the host diet were also apparent for all 10 species; 7 species were positively correlated with casein concentration (e.g., B. caccae) while the remaining three species were negatively correlated with casein concentration (e.g. E. rectale). Data points from the first and second set of mice given the refined diets (see Fig. S1D,E for explanation) are shown in purple and green, respectively, while the mean and standard error for all diets at a given concentration of casein are shown in red and tan, respectively.
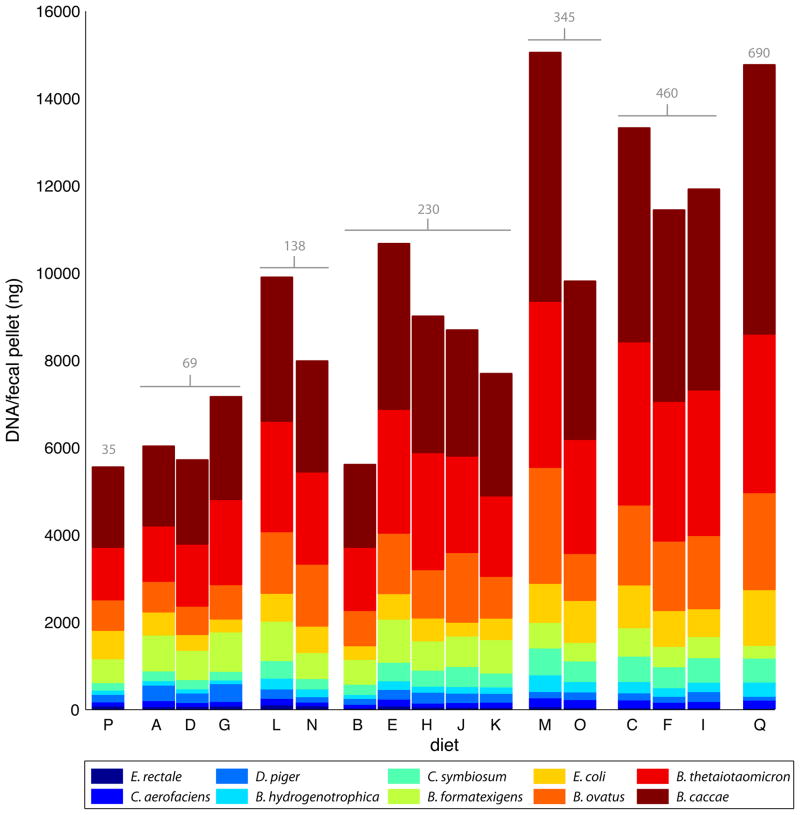
Fig. 2.
Mean community member abundance for each diet. The height of each bar indicates the total DNA yield/biomass for a given diet. Casein concentrations (g/kg) for each diet are displayed in gray above each bar. See Fig. S1 and Table S1 for a description of diets A–Q.
Microbial RNA-Seq was used on fecal RNA samples, prepared from mice on each diet (mean=2.1±0.7 replicates per diet; Table S7) (13), to determine if perturbations in diet ingredients correlated with underlying changes in mRNA expression by community members. Each of the 36 RNA-Seq datasets was composed of 36 nt-long reads (3.20±1.35 × 10⁶ mRNA reads/sample). Transcript abundances were normalized for each of the 10 species to reads per million per kilobase (RPKM) (14). After correcting for multiple-hypotheses, we found no statistically significant changes in gene expression within a given bacterial species as a function of any of the diet perturbations (13). While community members do not appear to significantly alter their gene expression, they do respond by increasing or decreasing their absolute abundances (Fig 2), thereby adjusting the total available transcript pool in the microbiota for processing dietary components. For example, as casein levels are increased across the diets, B. caccae increases its contribution to the gene pool/community transcriptome; so the number of transcripts per unit of casein remains roughly constant.
Since RNA-Seq provides accurate estimates of absolute transcript levels (15), we used transcript abundance information as a proxy to predict the major metabolic niches occupied by each community member. For species positively correlated with casein, we found high expression of mRNAs predicted to be involved in pathways using amino acids as substrates for nitrogen, as energy and/or as carbon sources. By contrast, the three species that negatively correlated with dietary casein concentration showed no clear evidence of high levels of expression of genes involved in catabolism of amino acids (13). The changes in abundance of the negatively correlated species (e.g., E. rectale) can be explained by competition with another member of the community that increases with casein(see Fig. S4; 13,16).
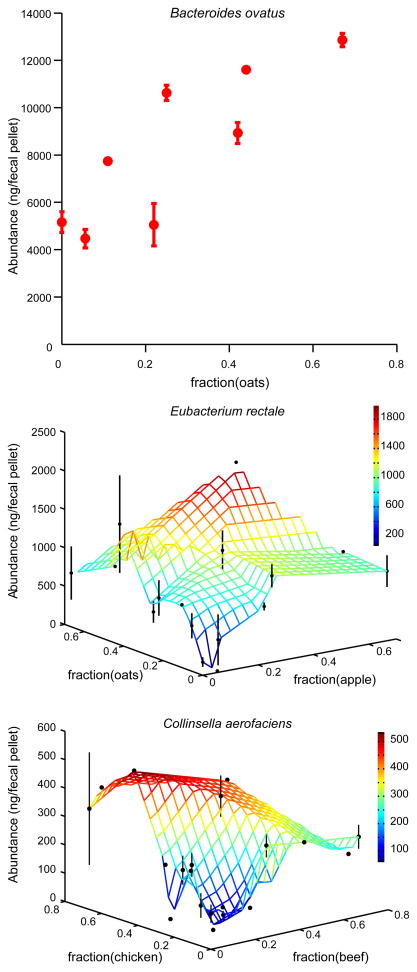
The power of the refined diets we used lies in the capacity to precisely control individual diet variables and to aid data interpretation from more complex diets. To test if the modeling framework we used generalizes to diets containing food more typically consumed in human diets, we created 48 meals consisting of random combinations and concentrations of four ingredients selected from a set of eight pureed human baby foods (apples, peaches, peas, sweet potatoes, beef, chicken, oats, and rice; Table S8). The meals were administered for periods of 7d to the same eight gnotobiotic mice that we used for the follow-up refined diet experiments described above and in Fig. S1E (13). Each mouse received a sequence of 6 baby food diets. The order of presentation of the baby food diets was varied between animals (see Table S8 and 13). We measured the absolute abundance of each bacterial community member on days 1, 5, 6, and 7 for each diet. Using the linear modeling approach described above (13), we were able to explain over half of the variation in species abundance using only knowledge of the concentrations of the pureed foods present in each meal (R2=0.62). We used stepwise regression to identify the type of pureed food(s) present in a given mixed meal that was most significantly associated with changes in each bacterial species (Table S9; Fig. 3).
Fig. 3.
Example of community member responses to complex human foods. Changes in species abundance as a function of diet ingredients were apparent for all 10 species (Table S9). B. ovatus increased in absolute abundance with increased concentration of oats in the diet (upper panel), while most of the ten bacterial species (including E. rectale and C. aerofaciens; middle and lower panels) responded to multiple ingredients. The mean and standard error for all diets are plotted (no error bars are shown when replicate points are not available). The colored z-axis mesh grid on the 3D plots is a triangle-based linear interpolation of the data with color changes corresponding to the values in the color bar on the right.
Defining the interrelationship between diet and the structure and operations of the human gut microbiome is key to advancing our understanding of the nutritional value of food, for creating new guidelines for feeding humans at various stages of their lifespan, for improving global human health, and for developing new ways to manipulate the properties of the microbiota to prevent or treat various diseases. The experiments and model described above highlight the extent to which host diet can explain the configuration of the microbiota, both for refined diets where all of the perturbed diet components are digestible by the host, and for human diets whose ingredients are only partially known. These models can now be tested using larger defined gut microbial communities representing those of humans living in different cultural settings, and with more complex diets, including various combinations of food ingredients that they consume.
Supplementary Material
Acknowledgments
We are indebted to David O’Donnell, Maria Karlsson, and Sabrina Wagoner for their help with various aspects of gnotobiotic mouse husbandry, and Barbara Mickelson, Ilaria Mogno, Andy Goodman, Nicholas Griffin, Henning Seedorf, Gabriel Simon, Jonathan Chase, and Barak Cohen for their many helpful suggestions during the course of this work. This work was supported by grants from the NIH (DK30292, DK70977) and the Crohn’s and Colitis Foundation of America. COPRO-Seq and microbial RNA-Seq data are available in the Gene Expression Omnibus (accession number GSE26687). Processed data can be obtained at http://gordonlab.wustl.edu/modeling_microbiota/.
References and Notes
- 1.Ley RE, Turnbaugh PJ, Klein S, Gordon JI. Nature. 2006;444:1022. doi: 10.1038/4441022a. [DOI] [PubMed] [Google Scholar]
- 2.Clayton TA, Baker D, Lindon JC, Everett JR, Nicholson JK. Proc Natl Acad Sci USA. 2009;106:14728. doi: 10.1073/pnas.0904489106. [DOI] [PMC free article] [PubMed] [Google Scholar]
- 3.Xavier RJ, Podolsky DK. Nature. 2007;448:427. doi: 10.1038/nature06005. [DOI] [PubMed] [Google Scholar]
- 4.Qin J, et al. Nature. 2010;464:59. [Google Scholar]
- 5.Turnbaugh PJ, et al. Proc Natl Acad Sci USA. 2010;107:7503. doi: 10.1073/pnas.1002355107. [DOI] [PMC free article] [PubMed] [Google Scholar]
- 6.Turnbaugh PJ, et al. Sci Transl Med. 2009;1:6ra14. doi: 10.1126/scitranslmed.3000322. [DOI] [PMC free article] [PubMed] [Google Scholar]
- 7.Kendall AI. Lea & Febiger. Philadelphia, New York: 1921. pp. 617–621. [Google Scholar]
- 8.Handelsman J. DNA Cell Biol. 2008;27:219. doi: 10.1089/dna.2008.1503. [DOI] [PubMed] [Google Scholar]
- 9.Faith JJ, et al. ISME J. 2010;4:1094. doi: 10.1038/ismej.2010.110. [DOI] [PMC free article] [PubMed] [Google Scholar]
- 10.Rey FE, et al. J Biol Chem. 2010;285:22082. doi: 10.1074/jbc.M110.117713. [DOI] [PMC free article] [PubMed] [Google Scholar]
- 11.Mahowald MA, et al. Proc Natl Acad Sci USA. 2009;106:5859. [Google Scholar]
- 12.Goodman AL, et al. Cell Host Microbe. 2009;6:279. doi: 10.1016/j.chom.2009.08.003. [DOI] [PMC free article] [PubMed] [Google Scholar]
- 13.Methods are available as supporting material on Science Online.
- 14.Mortazavi A, Williams BA, McCue K, Schaeffer L, Wold B. Nat Methods. 2008;5:621. doi: 10.1038/nmeth.1226. [DOI] [PubMed] [Google Scholar]
- 15.Fu X, et al. BMC Genomics. 2009;10:161. doi: 10.1186/1471-2164-10-161. [DOI] [PMC free article] [PubMed] [Google Scholar]
- 16.Chase JM, Leibold MA. Interspecific interactions. University of Chicago Press; Chicago; London: 2003. Ecological niches: linking classical and contemporary approaches. [Google Scholar]
Associated Data
This section collects any data citations, data availability statements, or supplementary materials included in this article.


