

Abstract
In the advent of next-generation sequencing (NGS) platforms, map-based sequencing strategy has been recently suppressed being too expensive and laborious. The detailed studies on NGS drafts alone indicated these assemblies remain far from gold standard reference quality, especially when applied on complex genomes. In this context the conventional BAC-based physical mapping has been identified as an important intermediate layer in current hybrid sequencing strategy. BAC-based physical map construction and its integration with high-density genetic maps have benefited from NGS and high-throughput array platforms. This paper addresses the current advancements of BAC-based physical mapping and high-throughput map integration strategies to obtain densely anchored well-ordered physical maps. The resulted maps are of immediate utility while providing a template to harness the maximum benefits of the current NGS platforms.
1. Introduction
Access to a high-quality reference genome sequence is the ultimate tool for advanced genomic research both in plants and biomedical sciences [1]. A genome sequence fundamentally can be obtained from two different approaches [2]. The widespread whole-genome shotgun sequencing (WGS) strategy randomly shears the genomic DNA into small pieces and subsequently clones into plasmids prior to sequencing [3]. In contrast, the conservative hierarchical/clone-by-clone method relies on a physical map that is used to define a minimum tilling path (MTP) representing the least redundant overlapping clones [4]. Due to the revolutionary advances in next-generation sequencing (NGS) platforms, the whole-genome shotgun (WGS) strategy soon became the method of choice for many sequencing projects as it enabled sequencing any given organism irrespective of the genome size within a short time and for a fraction of the cost it used to be [5, 6]. These sequencing projects indeed have provided rapid access to new gene models from many more organisms than previously anticipated [2, 7]. In spite of the constant improvements on the assemblers, read lengths, and mate pair technologies [8–10], to date the resulted assemblies still remain highly fragmented with incomplete genomic representation and prone to misassemblies [2, 7]. Although the quality of WGS assemblies over the hierarchical method has been questioned ever since its invention, this was not critically assessed, mainly due to the lack of resources such as complete cDNA libraries or a finished genome sequence [7]. The first attempt to address this issue was performed by Aach et al. [11] by comparing the two draft sequences of the human genome generated by human genome project [4] (HGP) and Celera genomics [3]. The “Celera assembly” remained far from being independent as it used the sequences from HGP in a “shredded” manner that retained nearly all the information from the original sequences [12]. Recently the availability of two completely de novo assembled human draft genomes [13] enabled a systematic comparison to the HGP reference sequence [3, 4]. The results indicated that the most adversely affected areas of de novo NGS alone drafts are the segmental duplications and larger common repeats [7, 14]. The depiction became actuate when the sequence identity exceeded 85% resulting in a loss of 16% of the genome due to sequence collapse while 99% of the true pairwise segmental duplications were absent [7, 14]. Further analysis on impact of genomic reduction revealed that only 57% of the genes had sufficient representation in the assembly (≥95% of the gene) while over 2300 exons were completely missing [7]. In contrast, as the hierarchical strategy primarily relies on an ordered, densely anchored physical map, the resulted sequences mainly remain local, thereby reducing the complexity [15–17] and facilitating efficient handling of repeats and segmentally duplicated regions. Furthermore, as the hierarchical method can deliver nearly the complete genome sequence, it facilitates the accuracy of sequence assembly as well as gene annotation processes [2, 7]. As the shortcomings of draft sequences generated by NGS platforms alone and its adverse effects on downstream applications (such as copy number variations (CNVs), accurate gene prediction, functional annotations, and evolutionary and comparative studies) are becoming increasingly apparent, hybrid sequencing approaches combining the conventional hierarchical strategy with multiplatform NGS sequencing including the third-generation long read technologies are gaining more recognition [2, 7, 9], especially when dealing with large and repeat-rich genomes. While physical maps are identified as an important intermediate layer in modern sequencing, considerable amount of technical advances have been established in contig map construction. This paper outlines the recent technical advances of BAC-based physical mapping and its integration with high-density genetic maps.
2. Diverse BAC Libraries Ensure High Genomic Representation
A physical map is a model of a genome of interest reconstructed on the basis of overlapping fragments of genomic DNA. A prerequisite for building a physical map either being genomewide, chromosome specific, or for a region of interest is access to BAC libraries that represent several folds of haploid genome coverage [18–24]. It is best to use a combination of BAC libraries with various origins such as different restriction enzymes and/or constructed by mechanical shearing of genomic DNA [24, 25]. If only a single BAC library originated from partial digest with a single enzyme is solely used for physical map construction, the resulted map is likely to contain gaps due to cloning bias and segments that are noncloneable or unstable in the E. coli host [26, 27]. To overcome the cloning bias, BAC libraries originated from different restriction enzymes are employed [24, 28, 29]. The rationale behind constructing independent BAC libraries by partial digestion with different restriction endonucleases is that the frequency of occurrence of a specific restriction site in the DNA sequence is a function of the base pair composition of a species genome and recognition site [29]. For instance a restriction site composed of 4 nucleotides should theoretically generate fragments once in 256 bp ((1/4)4 = 1/256) while a six-base cutter will generate fragments in every 4096 ((1/4)6 = 1/4096) nucleotides in a completely random sequence. However, as for most DNA sequences the nucleotide distribution is not random, a bias in restriction site distribution is observed. Thus, selecting multiple enzymes with different recognition sequences is a measure to limit the risk of underrepresentation of specific regions in the resulted BAC map [29]. Including a mechanically sheared library is an alternative to further overcome cloning bias [24, 30, 31].
3. Fosmids as a Tool for Physical Mapping
Fosmids represent an alternative cloning system derived from low copy number cosmid vectors. Similar to BACs, the Fosmid inserts remain under the control of E. coli F factor replicon enhancing its stable maintenance and propagation. However, in contrast to BACs, Fosmids carry much narrower insert sizes with an average of 40 Kb. As the fragmentation of DNA is performed via mechanical shearing, no cloning bias is introduced to the resulted libraries [32]. As opposed to the high technical skills and costs required to develop large-insert deep-coverage BAC libraries, Fosmid library construction remains quite trivial [33]. The narrower insert range, stable maintenance, and easy production have made Fosmids suitable for a wide range of applications [30, 34]. For instance, Fosmid libraries per se are useful for whole-genome physical mapping [35–37] and refining the BAC/PAC-based physical maps by effective gap filling [26, 30]. Furthermore, paired Fosmid end sequences, due to the narrower insert size range of Fosmid clones, are useful for sequence scaffolding in large-scale sequencing projects and studies related to structural variation and organization of the genomes [34, 38–41].
4. Methods of Physical Map Construction—Status Quo and New Approaches
Physical maps are generated based on technologies to detect clone overlaps. Two distinct approaches, namely (1) screening BACs to assess presence of mapped markers and (2) restriction map-based fingerprinting, are used to identify the overlap among clones. Each of these approaches is represented by numerous techniques [42]. The underlying principle of these techniques, advantages, and limitations have been extensively discussed in previous reviews [42, 43] and thus will only be outlined below. Briefly the first method relies on PCR amplification of short fragments (sequence tagged sited STS) [44, 45] and/or hybridization of labeled cDNA clones/gene-specific oligonucleotides [46]. The method became less attractive as it was laborious and required extremely large number of markers that were limited for many species [42]. The second approach is based on DNA fingerprinting, essentially performed by restriction mapping [42, 44, 47]. Soon this approach became the method of choice in physical map construction as it is suited better for unexploited genomes and was more amenable for automation [42]. A genomewide restriction fragment map was first produced based on acrylamide [47] and agrose gel electrophoresis [44]. As these methods largely remained of low throughput while delivering relatively low amount of information and imprecise fragment sizing, a set of new fingerprinting methods collectively known as high information content fingerprinting (HICF) has been developed [48–50]. All HICF methods are based on capillary electrophoresis leading to substantial increase in both throughput and sensitivity of the resulted fingerprints. After a comparative evaluation of the proposed HICF fingerprinting methods it was concluded that the method developed by Luo et al. [50] was the most effective and thus has been used in many recent fingerprinting projects thereafter [16, 24, 42].
5. Whole-Genome Profiling (WGP)
Whole-genome profiling (WGP) is a novel next-generation, sequence-based physical mapping strategy. The method makes use of short sequence tags adjacent to restriction enzyme sites generated either by Illumina GA or SOLiD platforms [51]. A key difference between WGP and the current gold standard HICF method [50] is that WGP uses short sequence tags (20 bp or larger with recent read length improvements of the short read sequencing technologies) generated across BACs (every 2-3 Kb) to identify the overlapping BACs uniquely and for the subsequent contigs building process [52], while the latter relies on fragment sizes obtained after capillary electrophoresis [50]. As WGP orders BACs into contigs by identifying the clone overlaps through sequence data, it simultaneously generates a partial genome sequence. To trade off the costs involved in BAC DNA preparation and Illumina GA/SOLiD sequencing, an efficient BAC pooling strategy is a must for WGP. The complexity of the pools and the redundancy of the WGP tags per BAC (i.e., coverage) are related to the complexity and size of the genome under investigation. It was demonstrated that WGP on small genomes requires less complex pools, whereas large and complex genomes require complex pools with more BACs per pool [51]. The pooled DNA is then digested with two enzymes MseI and EcoRI prior to ligating with universal MseI P7 and a sample-specific tagged EcoRI P5 adaptors, respectively. The subsets of fragments that contain both adaptors are selected by PCR amplification and sequenced on Illumina GA or SOLiD platforms. In contrast to HICF, WGP allows the identification and filtration of repeat originated sequences reducing the chances of chimeric contig formation [51]. The method was tested by developing a WGP-based physical map of Arabidopsis thaliana Col-1 by using ∼6100 BAC clones (6X genome coverage). The comparison of the resulted sequence-based physical contigs against the “Columbia” reference sequence revealed ~98% of the assembled contigs (i.e., 80% of the map length) matched the reference sequence. To substantiate the robustness of the method, four additional genomes of melon (450 Mb), tomato (950 Mb), rape seed (1.2 Gb), and lettuce (2.6 Gb) were subjected to WGP. Furthermore, in silico analysis of the maize genome indicated the reliability of the method when applied to repeat-rich genomes [51].
Interestingly, the comparative studies on WGP and HICF have revealed that WGP results in significantly less number of contigs while reducing the chimeric and misassembled contigs by 3% and 4%, respectively [53]. Though WGP offers attractive and immediate advantages, the method still remains expensive. Nevertheless, the dramatic decrease in sequencing costs and employing smarter BAC pools will help to trade off the associated costs.
6. Genetic Anchoring of Physical Maps—Increasing the Efficiency
To achieve the full benefits of a physical map, bacterial artificial chromosome (BAC) contigs are required to be integrated with genetic maps at high density and resolution [54–56] (Figure 1). Screening BAC libraries is an indispensable step for physical and genetic map integration, by which BAC clones and contigs can be placed and ordered along a genetic map [16, 54–56]. Until few years ago anchoring per se was a rate-limiting step mainly due to technical limitations in screening procedures and partly due to the lack of high-quality dense genetic maps [56–58]. The steady technological advancements in screening procedures resulted in cost-effective and highly parallelized multiplexing platforms.
Figure 1.
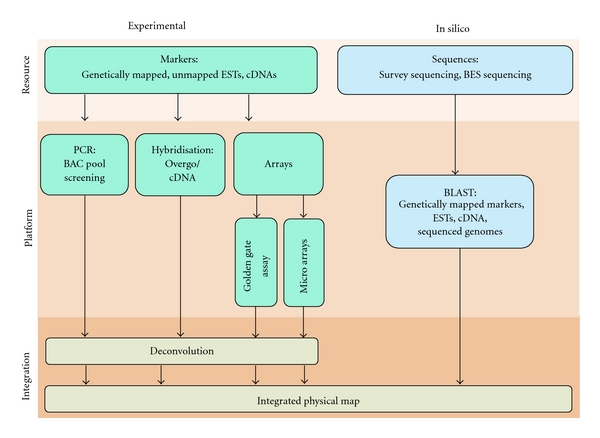
Approaches to BAC library screening. Genetically mapped markers and unmapped sequence information such as cDNA and ETSs can be used to screen multidimensional BAC pools via PCR-based methods, hybridization of BAC filters, or highly parallel array platforms. The resulted data are deconvoluted to obtain marker BAC relationships prior to integrating to the contig map. Alternatively the BAC sequence information obtained through survey sequencing (NGS/Sanger sequencing) or BES could be searched against genetically mapped markers, ESTs, cDNA, and so forth of the same organism or different species.
7. Advances in Multidimensional BAC Pooling
At the end of constructing a BAC library the recombinant colonies are robotically picked and arrayed into microtiter plates generating gridded bacterial stock cultures that are used for storage, routine work as well as shipping [18, 24, 59, 60]. The gridded cultures can be used for generating multi-dimensional BAC pools, a prerequisite to maximize the effectiveness of BAC library screening [61, 62]. A BAC pool is composed by combining a set of predefined BACs within or between microtiter plates [62]. Several pooling strategies have been proposed, all of which rely on concentrating the BACs into pools composed of overlapping groups of clones [56, 58, 61]. One of the earliest and frequently used pooling schemes is the three-dimensional (3D) plate, row, and column pools (PP, CP, and RP) [61, 62]. The 3D pools are generated by subdividing the library into several groups, each containing equal number of microtiter plates representing a known amount of genome equivalents. Prior to pooling, the DNA is isolated separately and pooled in an equimolar fashion to generate plate, row, and column pools within the predefined subset of microtiter plates [61, 62]. Although 3D pools reduce the number of assays required to identify a marker-BAC relationship, it is prone to generate false-positives [56, 58, 63]. Therefore, to identify the positive BAC clones for a given marker reliably while performing minimum number of PCR assays, pooling additional dimensions was tested [61]. For instance the 6D pooling strategy includes three-dimensional pools called plate, face, and side pools (3D stack), together with additional three types of pools, namely, row, column, and diagonal pools [63]. Only the 3D stack is screened to identify the positive clones while the remaining dimensions are used for clone confirmation, which reduces the tedious task of individual clone verification [63]. A major drawback of the 6D scheme is the large number of pools generated for subsequent screening procedures, for instance, a total of 184, 208, and 288 pools were generated for 730 Mbp sorghum [64], 1.1 Gbp soybean [65], and 2.5 Gbp maize [63], respectively. Because the number of pools to be screened in order to identify a marker-BAC relationship is a function of the genome size, the workload for screening BAC libraries for species with larger genomes is unacceptably high, limiting its applications on large genomes [56, 58].
To facilitate screening multiple genome equivalents of large genomes while keeping the number of pools manageably low, a new 5D pooling scheme was introduced [58]. Similar to other pooling strategies the microtiter plates were arranged into groups, each containing equal number of plates that were then pooled to form plate, row, and column pools as previously described. To generate the remaining two dimensions, BACs with a single microtiter plate were pooled to form low-complexity plate pools (PPs). The resulted pools were then arranged in a two-dimensional grid and further pooled to form row super pools (RSPs) and column super pools (CSPs), respectively [58].
Recently, conventional 3D BAC pools were further modified into convenient two-step screening, namely, super pool and matrix pool, a proprietary method invented by a commercial supplier [66–68]. The total number of super pools in a kit is determined by the number of BACs in the library [67]. For instance, the barley BAC library HVVMRXALLeA with 147 and 456 BACs (i.e., 3.7x genome equivalent) contained 55 super pools. A single super pool is composed of seven 384 microtiter plates (i.e., 2,688 BACs per super pool) (Figure 2). The BACs included in a single super pool are further pooled on a predefined matrix to form plate, row, and column pools (matrix pools) [67, 68]. An important feature of this two-step pooling scheme is that it does not only reduce the number of PCR assays, but also decreases the false-positives as the matrix pool screening results demand for two signals to identify a given coordinate, that is, a total of six signals is required to identify a positive BAC (Figure 3) [67]. This is because within a given matrix pool each coordinate (plate, row, or column) is represented twice; thus both coordinates are required to identify the corresponding BAC address (Figure 3).
Figure 2.
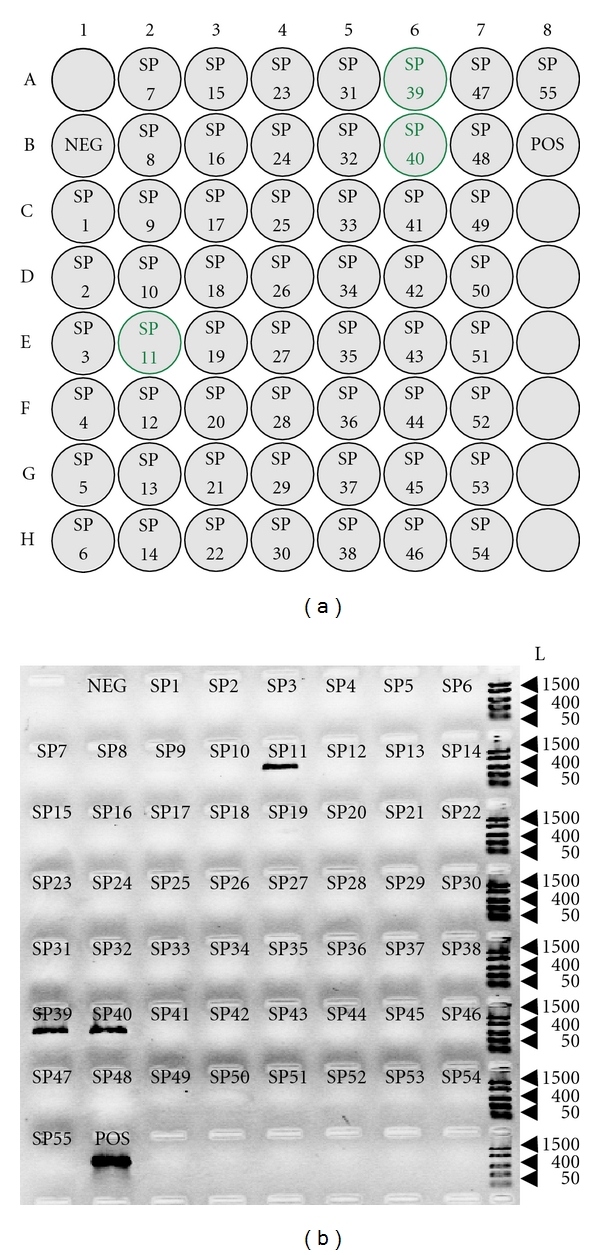
Results of super pool (SP) screening for the barley BAC library HVVMRXALLeA. (a) Schematic representation of 55 barley super pools originated from the BAC library HVVMRXALLeA [24]. SP1 to SP55 represent the super pools 1 to 55. Each super pool is composed of 7 × 384 microtiter plates, that is, 2688 BACs per super pool. NEG: negative control. POS: positive control, in this case genomic DNA of the barley cultivar Morex where the BAC library was derived. (b) Ethidium-bromide-stained agarose gel (1.5%) image of the super pool screening. Only the positive super pools (highlighted with a green border in (a)) amplified a single fragment that is of identical size to the product in Morex. Arrowheads indicate in each panel the position of the 1500, 400, and 50 bp fragments of the FastRuler Low Range marker (Fermentas). L (size standard in bp).
Figure 3.
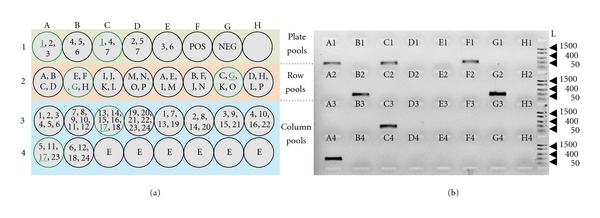
Results of matrix pool screening for the barley BAC library HVVMRXALLeA. (a) Schematic representation of a matrix pool composed of 23 pools for the BAC library HVVMRXALLeA [24]. The colored panels in A indicate the plate, row, and column matrix pools. Each circle represents a plate/row/column matrix pool where its composition is indicated within the circle. A matrix pool is composed of clones from seven 384 well BAC library plates. The clones within the seven plates are pooled based on a predefined matrix to form plate, row, and column matrix pools. A1—H4 indicate the position of each pool in a 96-well plate. NEG: negative control. POS: positive control, in this case genomic DNA of barley cultivar “Morex” where the BAC library was derived from. E: empty well. (b) Ethidium-bromide-stained agarose gel (1.5%) image of matrix pool screening. A1—H4 indicate the well position of each pool in the PCR plate. F1 is the positive control where G1 represents the negative control. Two signals are required to identify a given coordinate of the BAC address. Positive pools are highlighted by a green border and the shared coordinates between positive pools are underlined in (a). Arrowheads indicate in each panel the position of the 1500, 400, and 50 bp fragments of the FastRuler Low Range marker. L (size standard in bp).
8. PCR-Based Methods for BAC Library Screening
Screening BAC libraries by PCR assays is one of the earliest methods of library screening and has been extensively used in early physical mapping projects [15, 69]. The key advantage of PCR screening over hybridizations is the low rate of false-positives compared to conventional hybridization techniques [56–58, 63]. Additionally, the appropriate design of primers to amplify locus-specific products would allow mapping of genes that belong to a gene family [63]. On the other hand it enables sequencing the resulted amplicons to identify paralogous genes that often complicate the assignment between FPC contigs and genetic markers [65]. Recently, PCR-based techniques have also benefited from the increased automation and throughput [55, 70]. For example the advancements in thermocyclers have focused on scaling sample volume down, increasing the number of samples run simultaneously and decreasing overall cycling time [57, 70]. Additionally BAC library screening has also been performed on quantitative PCR machines with melt curve analysis capabilities [55, 70]. In principle the technique utilizes a standard PCR reaction performed in presence of a saturated/unsaturated intercalating dye such as Eva or SYBR green. The method accelerates the sample analysis and automated scoring by eliminating post-PCR agarose gel electrophoresis. The specificity of the amplicons generated in a given sample is verified by comparing the melting profiles of the samples to a known positive control that is essentially the genomic DNA of the cultivar/accession the BAC library was developed from [55, 70].
To enhance the throughput of BAC pool screening via PCR assays, new in silico analysis algorithms have been developed [55]. These algorithms facilitated the reduction of cost and labor involved in screening procedures, especially when dealing with large genomes. For example “electronic physical map anchoring tool” (ELEPHANT) combines the contig information generated from standard physical mapping tool “FPC” [52] along with the screening data originated from single-dimension plate pools. The programme is capable of identifying marker-BAC relationships unambiguously, simultaneously reducing the number of PCR assays. Nevertheless, this tool can only be applied if the library represents a genome coverage between 6- and 29-fold. Being below or above this range decreases the confidence of the identified contigs-BAC relationships [55]. In spite of these advancements, the PCR-based methods still remain cumbersome and of rather low throughput when large numbers of markers are to be screened [46, 54, 58, 68, 71].
9. BAC Filters for Library Screening
Until a couple of years ago, hybridization of single DNA probes or combinatorial pools of probes to BAC filters was a common approach for BAC library screening [15, 54, 71–73]. The BAC filters are composed of immobilized and lysed BAC colonies, which were robotically grided onto Nylon membranes [28, 57, 71]. Several types of probes can be used for screening BAC filters. The most commonly used are subcloned DNA fragments, PCR amplicons, cDNA inserts [74], or DNA oligonucleotides [64]. These probes can be used either individually or as a group [54, 71]. Major disadvantages of the hybridization method are the tendency of single probes hybridizing to multiple clones belonging to independent loci or of multiple probes with contradicting genetic information hybridizing to the same single BAC [58, 71]. Thus, the unequivocal assignment of contigs to loci on a genetic map may become troublesome [58]. Such contradictions could arise if the probes have originated from duplicated genes, conserved motifs, and repeat content, or due to contaminations that may have occurred during library construction and/or handling steps [71]. To overcome the drawbacks largely associated with hybridizing PCR/cDNA or EST inserts directly onto BAC filters, Ross et al. [46] introduced the concept of “overgo probes.” An overgo probe is often a 40 bp dsDNA oligonucleotide. Each overgo consists of two 24 mer oligonucleotides, which share eight base pairs of complimentary sequence at their 3′ ends. After synthesis and annealing, they create a sixteen-base overhang subsequently filled in using “Klenow fragment” and radio-labeled nucleotides ([∞P32]dCTP and [∞P32]dATP) [46, 71]. The probes can be designed after consulting a complete database where sequences are already repeat masked [75]. The precaution enhances the unequivocal assignment of contigs to genetic loci by improving probe specificity [71, 75]. Furthermore, overgo probes facilitated probe pooling/multiplexing as they could be designed to have uniform thermodynamic properties [71].The drawback of the original Ross et al. [46] protocol is that if extrapolated to large number of probes (10,000 or more) and applied to larger genomes (e.g.,: barley, 5.1 Gbp), the method demanded a problematic level of human exposure to radio isotopes [71]. Therefore, Madishetty et al. [71] modified and optimized the protocol for its application in large-scale multiplex screening. In contrast to the original method, the modified protocol utilizes all four radio isotopes in a hot pulse followed by a cold nucleotide chase and extends the exposure time to compensate for reduced specific activity of the probes [71]. The rationale behind using four radio nucleotides was that this would help to equalize the intensity of all probes by reducing the influence of nucleotide frequency. The modified method was successfully applied to identify a set of gene-bearing barley BACs (~65,000) from a BAC library composed of 313,344 clones (6.3-fold genome coverage) by using 12,600 overgo probes [71]. Although the multiplex hybridization screening is both cost- and time-efficient, it generates large amount of data that must be analyzed, assimilated, and disambiguated efficiently. Thus, to facilitate the data handling and rapid deconvolution, computational solutions are in place and have been successfully applied in large-scale physical mapping projects [76].
10. Array-Based Methods for BAC Library Screening
10.1. Illumina Golden Gate Assay
To increase the efficiency of BAC library screening, highly parallel array-based platforms have been tested on multidimensional BAC pools [58, 68]. Luo et al. [58] employed the highly parallel SNP genotyping platform, the Illumina golden gate assay, to screen a BAC library [77, 78]. Principally the golden gate assay targets a specific SNP locus and utilizes two allele-specific oligonucleotides to discriminate between SNP alleles while the third locus-specific oligonucleotide contains an address sequence downstream of the SNP. The two allele-specific primers each containing an allele discriminating nucleotide at its 3′ end are labeled either with Cy3 or Cy5 fluorochromes, respectively. After annealing one of the two allele-specific oligonucleotides to the genomic DNA template, it is extended by DNA polymerase and ligated to the locus-specific oligonucleotide downstream forming a contiguous PCR template. The ratio of Cy3 and Cy5 fluorescence is used to determine the genotype at a SNP locus [77, 78]. Luo et al. [58] demonstrated that annealing of allele- and locus-specific oligonucleotides to pooled BAC DNA enables determining whether or not a BAC pool harbors a specific locus, thus genotyping the BAC pools for presence or absence of a locus. To demonstrate the feasibility of the technique on complex genomes, 5D BAC pools originated from the genome of Ae. tauschii were used in the pilot experiment. The genotyping of BACs was performed on plate pools each representing ~1-fold genome equivalents. While the query asked in SNP genotyping is which of the two nucleotides is at a SNP site, the query asked in BAC pool genotyping is whether a target sequence is present or absent in a given BAC clone. Therefore, it is a prerequisite to genotype a segregating population before BACs are genotyped as the former provides the reference for defining call regions/clusters to identify the positive BACs. Furthermore, the BAC library used for genotyping should originate from one of the parents of the segregating population. Though this method primarily utilizes the golden gate assay, it still requires PCR screening of row super pools (RSPs) and column super pools (CSP) to verify the positive plates while clone verification required PCR screening of row pools (RPs) and column pools (CPs) [58] (see Section 7 for pooling details). In order to enhance the efficiency by eliminating the necessity of PCR screening, You et al. proposed a new implementation of the 5D pooling where four of the five dimensions (RSP, CSP, RP, and CP) could be screened directly on the golden gate platform [56]. The fifth dimension is the information about overlapping BAC clones in the contig map that is used to detect and verify true-positives among putative positive clones [56]. The main advantage of the golden gate screening as opposed to general PCR and hybridization approaches is a higher tendency of revealing one-to-one relationships between BAC contigs and genetic markers [56, 58].
10.2. Microarray Platforms
Although originally designed for studying multiparallel gene expressions, the feasibility of microarrays for high-throughput BAC library screening was recently explored [68, 79]. Pilot studies explored the possibility of using barley transcript-derived markers as a surrogate to anchor and order physical contigs of wheat chromosome 3B [79]. The BAC DNA of the three-dimensional MTP pools of wheat 3B chromosome was directly hybridized to a custom microarray of barley. The wheat-barley cross hybridizations allowed to identify the gene space across the wheat 3B chromosome while overcoming the limited availability of transcript-derived markers originated from wheat. Prior to hybridization, the pooled DNA was mixed with a reference barley mRNA template that facilitated the grid alignment and spot identification. The reference mRNA and BAC DNA was tagged with Cy5 (red) and Cy3 (green), respectively. After signal quantification and normalization, hybridization data was evaluated with four complementary scoring methods to reliably locate as many barley gene homologs as possible on wheat BACs. A complementary scoring scheme was applied to identify all positive signals, as missing coordinates in one approach could be recovered from the remaining methods. The method allowed mapping of 738 barley orthologous genes on wheat chromosome 3B. The reliability of the identified genes was validated by homology searches against the sequenced contigs of 3B [79].
This approach was further extended to anchor the HICF-derived barley BAC contigs to the unigenes deposited at HarvEST database [68, 80]. For this study a custom microarray (SCRI_Hv35_44k_v1) that contained 42,300 barley expressed sequence tags (ESTs) was used together with previously described matrix pools originated from barley BAC library HVVMRXALLeA (see Section 7). The hybridizations were performed by using two-channel processing of the microarray. Two matrix pools each representing 1/16th of the whole barley genome were uniquely labeled with either Cy3 or Cy5 and directly hybridized to the barley array. The signals were extracted, normalized, and subjected to downstream data processing through a customized semiautomated pipeline. The data processing scripts facilitated the rapid deconvolution of BAC addresses. The resulted marker BAC relations were independently validated and confirmed by four different approaches namely (1) shotgun sequencing of individual BACs, (2) plate/super pool DNA, (3) gene-specific qPCR assays, and (4) BLAST analysis against Brachypodium genes [68]. Microarray-based screening comes at the advantage of high-throughput and accurate gene-to-BAC addressing. Furthermore, the costs are defined by the overall number of arrays required to screen sufficient pool depth. For the golden gate assay-based screening cost degression can be achieved by using the same assay design for many samples, which, however, is not necessarily a limitation since the most efficient golden gate assay-based BAC library screening will be achieved in conjunction with genotyping a segregating population. Both multiplex screening approaches offer efficient improvements over previously applied marker-BAC address screening methods.
10.3. In Silico Anchoring
The term in silico anchoring refers to the computational assignment of the marker/gene sequences to a particular BAC unambiguously based on sequence similarities. Sequencing paired ends of BAC clones (BAC end sequencing (BES)), ideally of fingerprinted BAC clones, has become a standard practice in physical mapping projects [16, 81–83]. Paired BAC end sequencing refers to the bidirectional end sequencing of the genomic DNA insert with the help of universal priming sites in the cloning vector [84]. Access to end sequence information of BAC clones can facilitate in silico anchoring of the contig map to the genetic map and has proven particularly useful in small, gene-dense genomes [84, 85]. Their utility diminishes in repeat-rich genomes as only a limited percentage of BES will account for coding/low copy sequences, which can be reliably used for in silico anchoring [86]. Usage of BES information for in silico anchoring is two-fold. First they could be directly searched for gene-based/genomic markers within the same species, a standard practice from the early genome sequencing projects [15, 69, 87]. For instance during the rice genome sequencing project [87] all BESs originated from BAC libraries used to construct the rice physical map were preprocessed (by cleaning E. coli contamination and vector trimming) and repeat masked to avoid repetitive DNA sequences [87]. The preprocessed sequences were then searched for over 2000 rice markers via rapid sequence comparison programmes. This approach delivered over 400 putative marker BAC relations on average with 98.5% sequence identity over 216 bases. The verification experiments indicated that in silico anchored BACs grouped into the same fingerprint contig thus confirming the stringency level of alignment parameters helping to avoid the paralogous gene detection. The assignments were further confirmed by amplifying the corresponding markers from the overlapping BACs during wet lab experiments [87].
Secondly cross-referencing BES against the sequenced genomes in order to assign the BAC contigs to genetic bins became a method of choice due to the availability of large number of sequenced genomes and extensive knowledge on conserved syntenic relationships [69, 88]. This approach facilitated assigning physical contigs into genetic bins even in absence of dense genetic maps for the species of interest. For instance in the physical mapping project of Brachypodium distachyon BAC end sequences were aligned against the wheat ESTs and rice genome sequences, which immediately facilitated anchoring a large number of Brachypodium BAC contigs to the rice genome sequence and wheat deletion maps [89]. The indirect anchoring of the Brachypodium BAC contigs bypassed the lack of a dense genetic map of Brachypodium.
Additionally BES provides the raw material for “end sequence profiling” (ESP), a standard practice in human genomics to identify the genomic architecture of tumor/disease genomes [90, 91]. The ESP is essentially based on the concept of sequence-tagged connectors developed to facilitate de novo genome sequencing [92]. The technique is capable of providing high-resolution copy number (CNV) and structural aberrations/variation (SV) maps on selected tumor/disease tissues. To this end BAC libraries are required to be generated from the rearranged genomes followed by subsequent generation of BES. Mapping these BES to a reference genome facilitates the detection of CNV/SV. For instance the aberrations in distance and/or orientation between end sequence read pairs reveals the presence of larger-scale SV while the use of comparative genomic hybridization (cGH) arrays allows mainly insights into CVs. The ESP method has since been adapted to characterize CNV/SV in human genomes using paired-end sequencing on NGS platforms [93–95].
11. Summary and Outlook
The next-generation sequencing (NGS) platforms have offered the potential to generate whole-genome sequences (WGS) for any organism irrespective of its genome size for a fraction of cost and time it used to be [1, 2, 7]. Though the resulted assemblies remain highly fragmented with lack of context and encompassing limited information on gene location and order, they provide immediate access to large number of gene models than ever before. Nevertheless, often this type of output remains far from even a true draft genome sequence, not to mention a gold standard reference sequence, which is the primary goal of most research communities [2, 7]. To this end it is noteworthy that the plant genomes are of average representative genome size of 6 Gbp and composed of a high proportion of repetitive DNA making WGS-based sequencing alone a daunting task [2, 96]. Although the access to genome sequences of different quality and status of finishing can be very enabling and utilized in many aspects of genome analysis and crop improvement, only high-quality drafts or finished genome sequences will allow advanced and accurate gene prediction including the determination of all regulatory sequences of a genome. The understanding of the extent structural/copy number variations and their impact on crop performance is only in its infancy and studied only in a limited number of plant genomes like maize and rice [97–99]. To gain further and deeper insights towards all aspects of the structure of economically important crop plant genomes and their impact on crop performance will require access to high-quality physical maps. This is not only true for different crop species but applies furthermore to genotypes representing key haplotypes of the available crop germplasm. Thus, the possibilities provided by new sequencing technologies eventually lead to a reinforced need for physical maps rather than making those obsolete.
References
- 1.Varshney RK, Nayak SN, May GD, Jackson SA. Next-generation sequencing technologies and their implications for crop genetics and breeding. Trends in Biotechnology. 2009;27(9):522–530. doi: 10.1016/j.tibtech.2009.05.006. [DOI] [PubMed] [Google Scholar]
- 2.Feuillet C, Leach JE, Rogers J, Schnable PS, Eversole K. Crop genome sequencing: lessons and rationales. Trends in Plant Science. 2011;16(2):77–88. doi: 10.1016/j.tplants.2010.10.005. [DOI] [PubMed] [Google Scholar]
- 3.Craig Venter J, Adams MD, Myers EW, et al. The sequence of the human genome. Science. 2001;291(5507):1304–1351. doi: 10.1126/science.1058040. [DOI] [PubMed] [Google Scholar]
- 4.Lander ES, Linton LM, Birren B, et al. Initial sequencing and analysis of the human genome. Nature. 2001;409(6822):860–921. doi: 10.1038/35057062. [DOI] [PubMed] [Google Scholar]
- 5.Huang S, Li R, Zhang Z, et al. The genome of the cucumber, Cucumis sativus L. Nature Genetics. 2009;41(12):1275–1281. doi: 10.1038/ng.475. [DOI] [PubMed] [Google Scholar]
- 6.Li R, Fan W, Tian G, et al. The sequence and de novo assembly of the giant panda genome. Nature. 2010;463(7279):311–317. doi: 10.1038/nature08696. [DOI] [PMC free article] [PubMed] [Google Scholar]
- 7.Alkan C, Sajjadian S, Eichler EE. Limitations of next-generation genome sequence assembly. Nature Methods. 2011;8(1):61–65. doi: 10.1038/nmeth.1527. [DOI] [PMC free article] [PubMed] [Google Scholar]
- 8.Hert DG, Fredlake CP, Barron AE. Advantages and limitations of next-generation sequencing technologies: a comparison of electrophoresis and non-electrophoresis methods. Electrophoresis. 2008;29(23):4618–4626. doi: 10.1002/elps.200800456. [DOI] [PubMed] [Google Scholar]
- 9.Schatz MC, Delcher AL, Salzberg SL. Assembly of large genomes using second-generation sequencing. Genome Research. 2010;20(9):1165–1173. doi: 10.1101/gr.101360.109. [DOI] [PMC free article] [PubMed] [Google Scholar]
- 10.Shendure J, Ji H. Next-generation DNA sequencing. Nature Biotechnology. 2008;26(10):1135–1145. doi: 10.1038/nbt1486. [DOI] [PubMed] [Google Scholar]
- 11.Aach J, Bulyk ML, Church GM, Comander J, Derti A, Shendure J. Computational comparison of two draft sequences of the human genome. Nature. 2001;409(6822):856–859. doi: 10.1038/35057055. [DOI] [PubMed] [Google Scholar]
- 12.Green P. Whole-genome disassembly. Proceedings of the National Academy of Sciences of the United States of America. 2002;99(7):4143–4144. doi: 10.1073/pnas.082095999. [DOI] [PMC free article] [PubMed] [Google Scholar]
- 13.Li R, Zhu H, Ruan J, et al. De novo assembly of human genomes with massively parallel short read sequencing. Genome Research. 2010;20(2):265–272. doi: 10.1101/gr.097261.109. [DOI] [PMC free article] [PubMed] [Google Scholar]
- 14.Alkan C, Kidd JM, Marques-Bonet T, et al. Personalized copy number and segmental duplication maps using next-generation sequencing. Nature Genetics. 2009;41(10):1061–1067. doi: 10.1038/ng.437. [DOI] [PMC free article] [PubMed] [Google Scholar]
- 15.McPherson JD, Marra M, Hillier L, et al. A physical map of the human genome. Nature. 2001;409(6822):934–941. doi: 10.1038/35057157. [DOI] [PubMed] [Google Scholar]
- 16.Paux E, Sourdille P, Salse J, et al. A physical map of the 1-gigabase bread wheat chromosome 3B. Science. 2008;322(5898):101–104. doi: 10.1126/science.1161847. [DOI] [PubMed] [Google Scholar]
- 17.Wei F, Zhang J, Zhou S, et al. The physical and genetic framework of the maize B73 genome. PLoS Genetics. 2009;5(11) doi: 10.1371/journal.pgen.1000715. Article ID e1000715. [DOI] [PMC free article] [PubMed] [Google Scholar]
- 18.Adam-Blondon AF, Bernole A, Faes G, et al. Construction and characterization of BAC libraries from major grapevine cultivars. Theoretical and Applied Genetics. 2005;110(8):1363–1371. doi: 10.1007/s00122-005-1924-9. [DOI] [PubMed] [Google Scholar]
- 19.Yim YS, Davis GL, Duru NA, et al. Characterization of three maize bacterial artificial chromosome libraries toward anchoring of the physical map to the genetic map using high-density bacterial artificial chromosome filter hybridization. Plant Physiology. 2002;130(4):1686–1696. doi: 10.1104/pp.013474. [DOI] [PMC free article] [PubMed] [Google Scholar]
- 20.Yüksel B, Paterson AH. Construction and characterization of a peanut HindIII BAC library. Theoretical and Applied Genetics. 2005;111(4):630–639. doi: 10.1007/s00122-005-1992-x. [DOI] [PubMed] [Google Scholar]
- 21.Ming R, Moore PH, Zee F, Abbey CA, Ma H, Paterson AH. Construction and characterization of a papaya BAC library as a foundation for molecular dissection of a tree-fruit genome. Theoretical and Applied Genetics. 2001;102(6-7):892–899. [Google Scholar]
- 22.Kim UJ, Birren BW, Slepak T, et al. Construction and characterization of a human bacterial artificial chromosome library. Genomics. 1996;34(2):213–218. doi: 10.1006/geno.1996.0268. [DOI] [PubMed] [Google Scholar]
- 23.Woo SS, Jiang J, Gill BS, Paterson AH, Wing RA. Construction and characterization of a bacterial artificial chromosome library of Sorghum bicolor. Nucleic Acids Research. 1994;22(23):4922–4931. doi: 10.1093/nar/22.23.4922. [DOI] [PMC free article] [PubMed] [Google Scholar]
- 24.Schulte D, Ariyadasa R, Shi B, et al. BAC library resources for map-based cloning and physical map construction in barley (Hordeum vulgare L.) BMC Genomics. 2011;12, article 247 doi: 10.1186/1471-2164-12-247. [DOI] [PMC free article] [PubMed] [Google Scholar]
- 25.Wu CC, Nimmakayala P, Santos FA, et al. Construction and characterization of a soybean bacterial artificial chromosome library and use of multiple complementary libraries for genome physical mapping. Theoretical and Applied Genetics. 2004;109(5):1041–1050. doi: 10.1007/s00122-004-1712-y. [DOI] [PubMed] [Google Scholar]
- 26.Ammiraju JSS, Yu Y, Luo M, et al. Random sheared fosmid library as a new genomic tool to accelerate complete finishing of rice (Oryza sativa spp. Nipponbare) genome sequence: sequencing of gap-specific fosmid clones uncovers new euchromatic portions of the genome. Theoretical and Applied Genetics. 2005;111(8):1596–1607. doi: 10.1007/s00122-005-0091-3. [DOI] [PubMed] [Google Scholar]
- 27.Yang TJ, Yu Y, Nah G, et al. Construction and utility of 10-kb libraries for efficient clone-gap closure for rice genome sequencing. Theoretical and Applied Genetics. 2003;107(4):652–660. doi: 10.1007/s00122-003-1302-4. [DOI] [PubMed] [Google Scholar]
- 28.Coe E, Cone K, McMullen M, et al. Access to the maize genome: an integrated physical and genetic map. Plant Physiology. 2002;128(1):9–12. doi: 10.1104/pp.128.1.9. [DOI] [PMC free article] [PubMed] [Google Scholar]
- 29.Wu C, Sun S, Nimmakayala P, et al. A BAC- and BIBAC-based physical map of the soybean genome. Genome Research. 2004;14(2):319–326. doi: 10.1101/gr.1405004. [DOI] [PMC free article] [PubMed] [Google Scholar]
- 30.Ammiraju JSS, Luo M, Goicoechea JL, et al. The Oryza bacterial artificial chromosome library resource: construction and analysis of 12 deep-coverage large-insert BAC libraries that represent the 10 genome types of the genus Oryza. Genome Research. 2006;16(1):140–147. doi: 10.1101/gr.3766306. [DOI] [PMC free article] [PubMed] [Google Scholar]
- 31.Godiska R, Mead DA, Dhodda V, et al. Bias-Free Cloning of “Unclonable” DNA for Simplified Genomic Finishing. Sudbury, Mass, USA: Jones and Bartlett Publishers; 2008. [Google Scholar]
- 32.Kim UJ, Shizuya H, De Jong PJ, Birren B, Simon MI. Stable propagation of cosmid sized human DNA inserts in an F factor based vector. Nucleic Acids Research. 1992;20(5):1083–1085. doi: 10.1093/nar/20.5.1083. [DOI] [PMC free article] [PubMed] [Google Scholar]
- 33.De Tomaso AW, Weissman IL. Construction and characterization of large-insert genomic libraries (BAC and fosmid) from the ascidian Botryllus schlosseri and initial physical mapping of a histocompatibility locus. Marine Biotechnology. 2003;5(2):103–115. doi: 10.1007/s10126-002-0071-4. [DOI] [PubMed] [Google Scholar]
- 34.Hao D, Yang L, Xiao P. The first insight into the Taxus genome via fosmid library construction and end sequencing. Molecular Genetics and Genomics. 2011;285(3):197–205. doi: 10.1007/s00438-010-0598-4. [DOI] [PubMed] [Google Scholar]
- 35.Gingrich JC, Boehrer DM, Garnes JA, et al. Construction and characterization of human chromosome 2-specific cosmid, fosmid, and PAC clone libraries. Genomics. 1996;32(1):65–74. doi: 10.1006/geno.1996.0077. [DOI] [PubMed] [Google Scholar]
- 36.Kim CG, Fujiyama A, Saitou N. Construction of a gorilla fosmid library and its PCR screening system. Genomics. 2003;82(5):571–574. doi: 10.1016/s0888-7543(03)00174-5. [DOI] [PubMed] [Google Scholar]
- 37.Kim UJ, Shizuya H, Sainz J, et al. Construction and utility of a human chromosome 22-specific Fosmid library. Genetic Analysis—Biomolecular Engineering. 1995;12(2):81–84. doi: 10.1016/1050-3862(95)00122-0. [DOI] [PubMed] [Google Scholar]
- 38.Lange C, Holtgräwe D, Schulz B, Weisshaar B, Himmelbauer H. Construction and characterization of a sugar beet (Beta vulgaris) fosmid library. Genome. 2008;51(11):948–951. doi: 10.1139/G08-071. [DOI] [PubMed] [Google Scholar]
- 39.Newman TL, Tuzun E, Morrison VA, et al. A genome-wide survey of structural variation between human and chimpanzee. Genome Research. 2005;15(10):1344–1356. doi: 10.1101/gr.4338005. [DOI] [PMC free article] [PubMed] [Google Scholar]
- 40.Tuzun E, Sharp AJ, Bailey JA, et al. Fine-scale structural variation of the human genome. Nature Genetics. 2005;37(7):727–732. doi: 10.1038/ng1562. [DOI] [PubMed] [Google Scholar]
- 41.Meyer JDF, Deleu W, Garcia-Mas J, Havey MJ. Construction of a fosmid library of cucumber (Cucumis sativus) and comparative analyses of the eIF4E and eIF(iso)4E regions from cucumber and melon (Cucumis melo) Molecular Genetics and Genomics. 2008;279(5):473–480. doi: 10.1007/s00438-008-0326-5. [DOI] [PubMed] [Google Scholar]
- 42.Meyers BC, Scalabrin S, Morgante M. Mapping and sequencing complex genomes: let’s get physical! Nature Reviews Genetics. 2004;5(8):578–588. doi: 10.1038/nrg1404. [DOI] [PubMed] [Google Scholar]
- 43.Nelson WM, Bharti AK, Butler E, et al. Whole-genome validation of high-information-content fingerprinting. Plant Physiology. 2005;139(1):27–38. doi: 10.1104/pp.105.061978. [DOI] [PMC free article] [PubMed] [Google Scholar]
- 44.Olson M, Hood L, Cantor C, Botstein D. A common language for physical mapping of the human genome. Science. 1989;245(4925):1434–1435. doi: 10.1126/science.2781285. [DOI] [PubMed] [Google Scholar]
- 45.Green ED, Green P. Sequence-tagged site (STS) content mapping of human chromosomes: theoretical considerations and early experiences. PCR Methods and Applications. 1991;1(2):77–90. doi: 10.1101/gr.1.2.77. [DOI] [PubMed] [Google Scholar]
- 46.Ross M, LaBrie T, McPherson S, Stanton VP. urrent Protocols in Human Genetics. New York, NY, USA: John Wiley & Sons; 1999. Screening large-insert libraries by hybridization; pp. 5.6.1–5.6.32. [Google Scholar]
- 47.Coulson A, Sulston J, Brenner S, Karn J. Toward a physical map of the genome of the nematode Caenorhabditis elegans. Proceedings of the National Academy of Sciences of the United States of America. 1986;83(20):7821–7825. doi: 10.1073/pnas.83.20.7821. [DOI] [PMC free article] [PubMed] [Google Scholar]
- 48.Ding Y, Johnson MD, Chen WQ, et al. Five-color-based high-information-content fingerprinting of bacterial artificial chromosome clones using type IIS restriction endonucleases. Genomics. 2001;74(2):142–154. doi: 10.1006/geno.2001.6547. [DOI] [PubMed] [Google Scholar]
- 49.Ding Y, Johnson MD, Colayco R, et al. Contig assembly of bacterial artificial chromosome clones through multiplexed fluorescence-labeled fingerprinting. Genomics. 1999;56(3):237–246. doi: 10.1006/geno.1998.5734. [DOI] [PubMed] [Google Scholar]
- 50.Luo MC, Thomas C, You FM, et al. High-throughput fingerprinting of bacterial artificial chromosomes using the SNaPshot labeling kit and sizing of restriction fragments by capillary electrophoresis. Genomics. 2003;82(3):378–389. doi: 10.1016/s0888-7543(03)00128-9. [DOI] [PubMed] [Google Scholar]
- 51.Van Oeveren J, De Ruiter M, Jesse T, et al. Sequence-based physical mapping of complex genomes by whole genome profiling. Genome Research. 2011;21(4):618–625. doi: 10.1101/gr.112094.110. [DOI] [PMC free article] [PubMed] [Google Scholar]
- 52.Soderlund C, Longden I, Mott R. FPC: a system for building contigs from restriction fingerprinted clones. Computer Applications in the Biosciences. 1997;13(5):523–535. doi: 10.1093/bioinformatics/13.5.523. [DOI] [PubMed] [Google Scholar]
- 53.20th International Triticeae Mapping Initiative (ITMI) programme and abstract web page. http://www.20th-itmi.com/image/program_abstracts.pdf.
- 54.Gardiner J, Schroeder S, Polacco ML, et al. Anchoring 9,371 maize expressed sequence tagged unigenes to the bacterial artificial chromosome contig map by two-dimensional overgo hybridization. Plant Physiology. 2004;134(4):1317–1326. doi: 10.1104/pp.103.034538. [DOI] [PMC free article] [PubMed] [Google Scholar]
- 55.Paux E, Legeai F, Guilhot N, et al. Physical mapping in large genomes: accelerating anchoring of BAC contigs to genetic maps through in silico analysis. Functional and Integrative Genomics. 2008;8(1):29–32. doi: 10.1007/s10142-007-0068-1. [DOI] [PubMed] [Google Scholar]
- 56.You FM, Luo MC, Xu K, Deal KR, Anderson OD, Dvorak J. A new implementation of high-throughput five-dimensional clone pooling strategy for BAC library screening. BMC Genomics. 2010;11(1, article 692) doi: 10.1186/1471-2164-11-692. [DOI] [PMC free article] [PubMed] [Google Scholar]
- 57.Campbell TN, Choy FYM. Approaches to library screening. Journal of Molecular Microbiology and Biotechnology. 2002;4(6):551–554. [PubMed] [Google Scholar]
- 58.Luo MC, Xu K, Ma Y, Deal KR, Nicolet CM, Dvorak J. A high-throughput strategy for screening of bacterial artificial chromosome libraries and anchoring of clones on a genetic map constructed with single nucleotide polymorphisms. BMC Genomics. 2009;10, article 28 doi: 10.1186/1471-2164-10-28. [DOI] [PMC free article] [PubMed] [Google Scholar]
- 59.Farrar K, Donnison IS. Construction and screening of BAC libraries made from Brachypodium genomic DNA. Nature Protocols. 2007;2(7):1661–1674. doi: 10.1038/nprot.2007.204. [DOI] [PubMed] [Google Scholar]
- 60.Safar J, Bartoš J, Janda J, et al. Dissecting large and complex genomes: flow sorting and BAC cloning of individual chromosomes from bread wheat. Plant Journal. 2004;39(6):960–968. doi: 10.1111/j.1365-313X.2004.02179.x. [DOI] [PubMed] [Google Scholar]
- 61.Barillot E, Lacroix B, Cohen D. Theoretical analysis of library screening using a N-dimensional pooling strategy. Nucleic Acids Research. 1991;19(22):6241–6247. doi: 10.1093/nar/19.22.6241. [DOI] [PMC free article] [PubMed] [Google Scholar]
- 62.Bruno WJ, Knill E, Balding DJ, et al. Efficient pooling designs for library screening. Genomics. 1995;26(1):21–30. doi: 10.1016/0888-7543(95)80078-z. [DOI] [PubMed] [Google Scholar]
- 63.Yim YS, Moak P, Sanchez-Villeda H, et al. A BAC pooling strategy combined with PCR-based screenings in a large, highly repetitive genome enables integration of the maize genetic and physical maps. BMC Genomics. 2007;8, article 47 doi: 10.1186/1471-2164-8-47. [DOI] [PMC free article] [PubMed] [Google Scholar]
- 64.Klein PE, Klein RR, Cartinhour SW, et al. A high-throughput AFLP-based method for constructing integrated genetic and physical maps: progress toward a sorghum genome map. Genome Research. 2000;10(6):789–807. doi: 10.1101/gr.10.6.789. [DOI] [PMC free article] [PubMed] [Google Scholar]
- 65.Wu X, Zhong G, Findley SD, Cregan P, Stacey G, Nguyen HT. Genetic marker anchoring by six-dimensional pools for development of a soybean physical map. BMC Genomics. 2008;9, article 28 doi: 10.1186/1471-2164-9-28. [DOI] [PMC free article] [PubMed] [Google Scholar]
- 66.Bouzidi MF, Franchel J, Tao Q, et al. A sunflower BAC library suitable for PCR screening and physical mapping of targeted genomic regions. Theoretical and Applied Genetics. 2006;113(1):81–89. doi: 10.1007/s00122-006-0274-6. [DOI] [PubMed] [Google Scholar]
- 67.Users manual for BAC pools produced by Amplon Express. http://www.genomex.com/aexDownloads.php.
- 68.Liu H, McNicol J, Bayer M, et al. Highly parallel gene-to-BAC addressing using microarrays. BioTechniques. 2011;50(3):165–172. doi: 10.2144/000113627. [DOI] [PubMed] [Google Scholar]
- 69.Gregory SG, Sekhon M, Schein J, et al. A physical map of the mouse genome. Nature. 2002;418(6899):743–750. doi: 10.1038/nature00957. [DOI] [PubMed] [Google Scholar]
- 70.Vu GTH, Caligari PDS, Wilkinson MJ. A simple, high throughput method to locate single copy sequences from Bacterial Artificial Chromosome (BAC) libraries using High Resolution Melt analysis. BMC Genomics. 2010;11(1, article 301) doi: 10.1186/1471-2164-11-301. [DOI] [PMC free article] [PubMed] [Google Scholar]
- 71.Madishetty K, Condamine P, Svensson JT, Rodriguez E, Close TJ. An improved method to identify BAC clones using pooled overgos. Nucleic Acids Research. 2007;35(1, article e5) doi: 10.1093/nar/gkl920. [DOI] [PMC free article] [PubMed] [Google Scholar]
- 72.Chen M, Presting G, Barbazuk WB, et al. An integrated physical and genetic map of the rice genome. Plant Cell. 2002;14(3):537–545. doi: 10.1105/tpc.010485. [DOI] [PMC free article] [PubMed] [Google Scholar]
- 73.Romanov MN, Price JA, Dodgson JB. Integration of animal linkage and BAC contig maps using overgo hybridization. Cytogenetic and Genome Research. 2003;102(1–4):277–281. doi: 10.1159/000075763. [DOI] [PubMed] [Google Scholar]
- 74.Xu J, Yang D, Domingo J, Ni J, Huang N. Screening for overlapping bacterial artificial chromosome clones by PCR analysis with an arbitrary primer. Proceedings of the National Academy of Sciences of the United States of America. 1998;95(10):5661–5666. doi: 10.1073/pnas.95.10.5661. [DOI] [PMC free article] [PubMed] [Google Scholar]
- 75.Zheng J, Svensson JT, Madishetty K, Close TJ, Jiang T, Lonardi S. OligoSpawn: a software tool for the design of overgo probes from large unigene datasets. BMC Bioinformatics. 2006;7, article 7 doi: 10.1186/1471-2105-7-7. [DOI] [PMC free article] [PubMed] [Google Scholar]
- 76.Jamison DC, Thomas JW, Green ED. ComboScreen facilitates the multiplex hybridization-based screening of high-density clone arrays. Bioinformatics. 2000;16(8):678–684. doi: 10.1093/bioinformatics/16.8.678. [DOI] [PubMed] [Google Scholar]
- 77.Illumina golden gate assay genotyping web page. http://www.illumina.com/technology/goldengate_genotyping_assay.ilmn.
- 78.Fan JB, Oliphant A, Shen R, et al. Highly parallel SNP genotyping. Cold Spring Harbor Symposia on Quantitative Biology. 2003;68:69–78. doi: 10.1101/sqb.2003.68.69. [DOI] [PubMed] [Google Scholar]
- 79.Rustenholz C, Hedley PE, Morris J, et al. Specific patterns of gene space organisation revealed in wheat by using the combination of barley and wheat genomic resources. BMC Genomics. 2010;11, article 714 doi: 10.1186/1471-2164-11-714. [DOI] [PMC free article] [PubMed] [Google Scholar]
- 80.HarvEST web page. http://www.harvest.ucr.edu/
- 81.Cheung F, Town CD. A BAC end view of the Musa acuminata genome. BMC Plant Biology. 2007;7, article 29 doi: 10.1186/1471-2229-7-29. [DOI] [PMC free article] [PubMed] [Google Scholar]
- 82.Han Y, Korban SS. An overview of the apple genome through BAC end sequence analysis. Plant Molecular Biology. 2008;67(6):581–588. doi: 10.1007/s11103-008-9321-9. [DOI] [PubMed] [Google Scholar]
- 83.Mao L, Wood TC, Yu Y, et al. Rice transposable elements: a survey of 73,000 sequence-tagged-connectors. Genome Research. 2000;10(7):982–990. doi: 10.1101/gr.10.7.982. [DOI] [PMC free article] [PubMed] [Google Scholar]
- 84.Ragupathy R, Rathinavelu R, Cloutier S. Physical mapping and BAC-end sequence analysis provide initial insights into the flax (Linum usitatissimum L.) genome. BMC Genomics. 2011;12, article 217 doi: 10.1186/1471-2164-12-217. [DOI] [PMC free article] [PubMed] [Google Scholar]
- 85.Febrer M, Goicoechea JL, Wright J, et al. An integrated physical, genetic and cytogenetic map of Brachypodium distachyon, a model system for grass research. PLoS ONE. 2010;5(10) doi: 10.1371/journal.pone.0013461. Article ID e13461. [DOI] [PMC free article] [PubMed] [Google Scholar]
- 86.Gu YQ, Ma Y, Huo N, et al. A BAC-based physical map of Brachypodium distachyon and its comparative analysis with rice and wheat. BMC Genomics. 2009;10, article 1471:p. 496. doi: 10.1186/1471-2164-10-496. [DOI] [PMC free article] [PubMed] [Google Scholar]
- 87.Yuan Q, Liang F, Hsiao J, et al. Anchoring of rice BAC clones to the rice genetic map in silico. Nucleic Acids Research. 2000;28(18):3636–3641. doi: 10.1093/nar/28.18.3636. [DOI] [PMC free article] [PubMed] [Google Scholar]
- 88.Bowers JE, Arias MA, Asher R, et al. Comparative physical mapping links conservation of microsynteny to chromosome structure and recombination in grasses. Proceedings of the National Academy of Sciences of the United States of America. 2005;102(37):13206–13211. doi: 10.1073/pnas.0502365102. [DOI] [PMC free article] [PubMed] [Google Scholar]
- 89.Huo N, Lazo GR, Vogel JP, et al. The nuclear genome of Brachypodium distachyon: analysis of BAC end sequences. Functional and Integrative Genomics. 2008;8(2):135–147. doi: 10.1007/s10142-007-0062-7. [DOI] [PubMed] [Google Scholar]
- 90.Volik S, Zhao S, Chin K, et al. End-sequence profiling: sequence-based analysis of aberrant genomes. Proceedings of the National Academy of Sciences of the United States of America. 2003;100(13):7696–7701. doi: 10.1073/pnas.1232418100. [DOI] [PMC free article] [PubMed] [Google Scholar]
- 91.Raphael BJ, Volik S, Collins C, Pevzner PA. Reconstructing tumor genome architectures. Bioinformatics. 2003;19(2):162–171. doi: 10.1093/bioinformatics/btg1074. [DOI] [PubMed] [Google Scholar]
- 92.Mahairas GG, Wallace JC, Smith K, et al. Sequence-tagged connectors: a sequence approach to mapping and scanning the human genome. Proceedings of the National Academy of Sciences of the United States of America. 1999;96(17):9739–9744. doi: 10.1073/pnas.96.17.9739. [DOI] [PMC free article] [PubMed] [Google Scholar]
- 93.Korbel JO, Urban AE, Affourtit JP, et al. Paired-end mapping reveals extensive structural variation in the human genome. Science. 2007;318(5849):420–426. doi: 10.1126/science.1149504. [DOI] [PMC free article] [PubMed] [Google Scholar]
- 94.Campbell PJ, Stephens PJ, Pleasance ED, et al. Identification of somatically acquired rearrangements in cancer using genome-wide massively parallel paired-end sequencing. Nature Genetics. 2008;40(6):722–729. doi: 10.1038/ng.128. [DOI] [PMC free article] [PubMed] [Google Scholar]
- 95.McKernan KJ, Peckham HE, Costa GL, et al. Sequence and structural variation in a human genome uncovered by short-read, massively parallel ligation sequencing using two-base encoding. Genome Research. 2009;19(9):1527–1541. doi: 10.1101/gr.091868.109. [DOI] [PMC free article] [PubMed] [Google Scholar]
- 96.Gregory TR, Nicol JA, Tamm H, et al. Eukaryotic genome size databases. Nucleic Acids Research. 2007;35(1):D332–D338. doi: 10.1093/nar/gkl828. [DOI] [PMC free article] [PubMed] [Google Scholar]
- 97.Kim HR, Hurwitz B, Yu Y, et al. Construction, alignment and analysis of twelve framework physical maps that represent the ten genome types of the genus Oryza. Genome Biology. 2008;9(2, article R45) doi: 10.1186/gb-2008-9-2-r45. [DOI] [PMC free article] [PubMed] [Google Scholar]
- 98.Springer NM, Ying K, Fu Y, et al. Maize inbreds exhibit high levels of copy number variation (CNV) and presence/absence variation (PAV) in genome content. PLoS Genetics. 2009;5(11) doi: 10.1371/journal.pgen.1000734. Article ID e1000734. [DOI] [PMC free article] [PubMed] [Google Scholar]
- 99.Swanson-Wagner RA, Eichten SR, Kumari S, et al. Pervasive gene content variation and copy number variation in maize and its undomesticated progenitor. Genome Research. 2010;20(12):1689–1699. doi: 10.1101/gr.109165.110. [DOI] [PMC free article] [PubMed] [Google Scholar]