Abstract
Aims
Left ventricular (LV) pressure–strain loop area reflects regional myocardial work and metabolic demand, but the clinical use of this index is limited by the need for invasive pressure. In this study, we introduce a non-invasive method to measure LV pressure–strain loop area.
Methods and results
Left ventricular pressure was estimated by utilizing the profile of an empiric, normalized reference curve which was adjusted according to the duration of LV isovolumic and ejection phases, as defined by timing of aortic and mitral valve events by echocardiography. Absolute LV systolic pressure was set equal to arterial pressure measured invasively in dogs (n = 12) and non-invasively in patients (n = 18). In six patients, myocardial glucose metabolism was measured by positron emission tomography (PET). First, we studied anaesthetized dogs and observed an excellent correlation (r = 0.96) and a good agreement between estimated LV pressure–strain loop area and loop area by LV micromanometer and sonomicrometry. Secondly, we validated the method in patients with various cardiac disorders, including LV dyssynchrony, and confirmed an excellent correlation (r = 0.99) and a good agreement between pressure–strain loop areas using non-invasive and invasive LV pressure. Non-invasive pressure–strain loop area reflected work when incorporating changes in local LV geometry (r = 0.97) and showed a strong correlation with regional myocardial glucose metabolism by PET (r = 0.81).
Conclusions
The novel non-invasive method for regional LV pressure–strain loop area corresponded well with invasive measurements and with directly measured myocardial work and it reflected myocardial metabolism. This method for assessment of regional work may be of clinical interest for several patients groups, including LV dyssynchrony and ischaemia.
Keywords: Heart failure, Dyssynchrony, Cardiac resynchronization therapy
Introduction
Clinical assessment of left ventricular (LV) systolic function is commonly performed by measuring indices of myocardial fibre shortening such as LV ejection fraction which is a global index, and LV wall thickening, myocardial velocity, and strain which reflect regional function. The shortening indices, however, do not reflect myocardial work or oxygen demand. As shown by Suga1 in an experimental study, the area of the LV pressure–volume loop reflects stroke work as well as myocardial oxygen consumption, and it was later confirmed that this concept is valid clinically.2 According to the same principle, the area of the myocardial force–segment length loop reflects regional myocardial work and oxygen consumption.3 Because calculation of myocardial force is challenging, pressure is used as a substitute for force and the area of LV pressure–dimension loop is used as an index of regional work.4–7
In the present study, we introduce a non-invasive method for LV work analysis which is based upon an estimated LV pressure curve in combination with strain by speckle-tracking echocardiography (STE). The estimated pressure curve is generated by adjusting the profile of a reference LV pressure curve according to the duration of the isovolumic and ejection phases as measured by echocardiographic timing of aortic and mitral valve events. Peak LV pressure was estimated non-invasively from brachial artery cuff pressure. The main objective of the present study was to determine whether LV pressure–strain loop area can be estimated with an entirely non-invasive approach by using the estimated pressure curve in combination with strain by STE. First, we tested the principle in a dog model under a wide range of haemodynamic conditions with LV micromanometer and implanted ultrasonic dimension crystals as reference methods. Secondly, we validated the non-invasive method in patients and used invasive LV pressure in combination with strain by STE as a reference method for pressure–strain loop area. Finally, to determine whether pressure–strain loop area reflects regional myocardial metabolism, we compared loop area with glucose turnover measured by positron emission tomography (PET).
Methods
Experimental study
Animal preparation
Twelve mongrel dogs of either sex and body weight 36 ± 2 kg were anaesthetized, ventilated, and surgically prepared as previously described,7 including induction of left bundle branch block (LBBB, n = 6) by radiofrequency ablation8 and regional ischaemia (n = 6) by left anterior descending coronary artery (LAD) occlusion. The study was approved by the National Animal Experimentation Board. The laboratory animals were supplied by Centre for Comparative Medicine, Oslo University Hospital, Rikshospitalet, Norway.
Haemodynamic measurements and sonomicrometry
Ascending aortic pressure, left atrial pressure, and LV pressure (LVP) were measured by micromanometers (MPC-500, Millar Instruments Inc., Houston, TX, USA). Segment lengths were measured using sonomicrometry crystals implanted endocardially (Sonometrics Corp., London, Ontario, Canada). In dogs with LBBB, longitudinal crystal pairs were placed in the septum and LV lateral wall, and a circumferential pair was placed in the posterolateral LV free wall. In the ischaemia group, a longitudinal pair was placed in the perfusion territory of the LAD. Strain was calculated as the percentage of end-diastolic length. Data were sampled at 200 Hz.
Echocardiography
A Vivid 7 ultrasound scanner (GE Vingmed Ultrasound AS, Horten, Norway) was used to record two-dimensional (2D) grey-scale images and strain by STE. Recordings were done in the LV equatorial short-axis and two- and four-chamber views (frame rate 63 ± 13s−1), and recordings were also done corresponding to the location of ultrasound crystals. Strain was measured successfully at all interventions, except for one dog during ischaemia.
Experimental protocol
In six dogs, measurements were performed at baseline and after induction of LBBB. In the remaining six animals, recordings were done before and after LAD occlusion for 60min. Data were recorded with the ventilator temporarily switched off.
Clinical study
The study population included 24 patients with mean age 66 ± 8 years (25% females). All patients had chronic heart failure (NYHA II–IV). A total of 18 patients underwent LV catheterization, including 11 with ischaemic cardiomyopathy and 7 with non-ischaemic dilated cardiomyopathy. Twelve of these patients had LBBB (QRS 160 ± 20 ms). Two of the patients with LBBB had a cardiac resynchronization therapy (CRT) device allowing for measurements with CRT on and off.
The six remaining patients were studied with 18F-fluorodeoxyglucose PET imaging (FDG-PET). These patients had dilated cardiomyopathy and LBBB (QRS 165 ± 16 ms). Coronary artery disease was ruled out by coronary angiography. In these patients, only the non-invasively estimated pressure curve was used for calculation of work. The study was approved by the Regional Committee for Medical Research Ethics. All subjects gave written informed consent.
Haemodynamic and echocardiographic measurements
Left ventricular pressure was measured by a micromanometer-tipped catheter (Millar) and a fluid-filled catheter connected to an external pressure transducer served as an absolute pressure reference. Brachial artery cuff pressure was measured. Myocardial strain was measured by STE in apical long-axis and two- and four-chamber views (frame rate 67 ± 7s−1), and 2D images with a narrow sector over the valves (frame rate 91 ± 23 s−1) were used to define opening and closure of the aortic and mitral valves. Pressure and strain data were recorded in a synchronized fashion and stored on the scanner for offline analysis. Echocardiography was performed immediately after the PET study. Patients with echocardiography images not amenable for speckle tracking were excluded prior to invasive pressure measurements (n = 2). An average of 16 ± 2 segments were analysed in each patient.
Fluorodeoxyglucose positron emission tomography
To reduce myocardial fatty acid metabolism and stimulate insulin-dependent glucose uptake, plasma glucose levels were titrated with oral glucose and i.v. insulin as described previously.9 Gated FDG-PET acquisition (Simens Biograph 64) was started 60–80 min after i.v. administration of the FDG (370–380 MBq), with eight gates per RR interval. The acquisition was also gated for respiration. Images were reconstructed and analysed on the Xeleris workstation (GE Healthcare). The point in the LV myocardium with the highest FDG uptake was used as a reference (100%), and segmental values were reported as percentages of this value.
Calculation of estimated left ventricular pressure curve
The non-invasively estimated LV pressure curve was validated first in the dog model which allowed testing under a wide range of haemodynamic conditions. Thereafter, the method was validated in patients with various cardiac disorders. As an estimate of peak LV pressure, aortic pressure measured invasively was used in dogs and brachial artery cuff pressure in patients. The profile of the estimated LV pressure curve was determined by using an empiric reference curve which was adjusted according to the duration of the isovolumic and ejection phases as determined by echocardiography.
Calculating left ventricular pressure reference curve
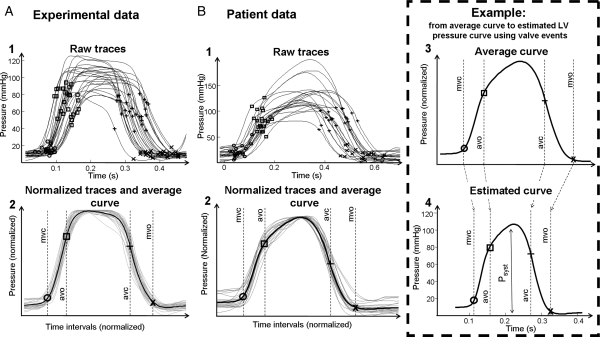
The LV pressure reference curve was calculated by pooling single cycle LV pressure traces from all interventions and normalizing each pressure trace using timing of valvular events in the following three steps: (i) the timing of opening and closure of the mitral and aortic valves was identified by echocardiography and assigned to each of the pressure traces (Figure 1A1 and B1). (ii) Each of the raw data traces was stretched or compressed along the time axis between individual valve events in order to make the valvular events coincide for all recordings (Figure 1A2 and B2). (iii) All traces were scaled vertically to have the same peak value. An averaged waveform was then calculated (black line in Figure 1A2 and B2).
Figure 1.
Estimation of left ventricular pressure curve. (A, 1) Raw left ventricular pressure data from dogs used for creating a profile of the reference pressure waveform, consisting of pressure recordings under different haemodynamic situations. Timing of mitral and aortic valve events is indicated. (A, 2) The raw pressure waveforms (grey curves) have been stretched or compressed along the time axis between individual valve events in order to make the valvular events coincide for all recordings. The waveforms have also been vertically scaled to have the same peak value. The averaged waveform to be used for predicting pressure traces is indicated by the black curve. (B, 1 and 2) Patient data: estimation of average pressure waveform as described in (A, 1) and (A, 2). (B, 3) The averaged waveform with arbitrary time intervals, transferred from (B, 2). (B, 4) Prediction of the left ventricular pressure waveform is based on the timing of valvular event. The left ventricular pressure waveform is constructed by adjusting the duration of time intervals to match the actual valvular timing as determined by echocardiography in the specific subject. In addition to the time-axis adjustments, the waveform has been scaled according to systolic arterial cuff pressure.
Applying left ventricular pressure reference curve to a specific subject
The reference curve was used for predicting LVP in a specific subject by measuring the actual valvular timing and adjusting the duration of time intervals of isovolumic contraction (IVC), ejection, and isovolumic relaxation (IVR) phases by stretching or compressing the time axis of the averaged LV pressure curve to match the measured time intervals (Figure 1B3 and 4). Peak arterial pressure was used to scale the amplitude of the pressure curve. Separate reference curves were used for dogs and patients. Note that data from all interventions in the dog study were used and that data from all patient observations were included in the calculation of the normalized LV pressure reference curve without considering their clinical status.
Data analysis: experimental study
Strain and pressure data were synchronized using onset R in electrocardiogram as a common time reference. Strain by STE was converted to the same sampling rate as sonomicrometry (200 Hz) by bandlimited sinc interpolation. Loop area was calculated by the following methods:
Invasive method. The area of the LV pressure–strain loops by LVP and STE.
Non-invasive method. The area of the LV pressure–strain loops by the estimated LV pressure curve and STE.
Comparison between left ventricular pressure–strain loop area and myocardial work
Left ventricular pressure–strain loop area as an index and myocardial work does not take into account effects on work related to changes in the radius of curvature or contribution from different fibre directions. To determine the magnitude of this effect, we measured myocardial work incorporating LV geometry (circumferential and longitudinal) and area strain during LBBB (for methods described in detail, see Supplementary material online, Appendix S1). To be able to compare the two methods, we correlated work done by the septum divided by work done by the lateral wall using the two methods. A comparison between the septum and the lateral wall was made because during LBBB, the septum does less work compared with the lateral wall.
Statistical analysis
Values are expressed as mean ± SD. Variables were compared using least-squares linear regression, Pearson's correlation coefficients, and the Bland–Altman plots with calculations of limits of agreement. To account for multiple measurements from each animal or patient when using the Bland–Altman plots, we display reference intervals based on agreement between methods of measurement with multiple observations per individual.10 For multiple comparisons, we used two-way repeated-measurements ANOVA with least significant difference post-test (SPSS 15.0, SPSS Inc., Chicago, IL, USA). All post hoc tests are compared with baseline. A value of P< 0.05 was considered significant.
To assess interobserver variability, loop area using estimated LV pressure for six randomly selected patients was analysed by two independent observers, using the interclass correlation coefficient (α value) and the Bland–Altman method.
Results
Experimental study
Haemodynamic variables at baseline, LBBB, and LAD occlusion are displayed in Table 1. There was a strong correlation between measured LVP and the estimated LV pressure curve for all animals during all interventions with mean r = 0.99 (range 0.98–1.0; Figure 2A and B). Figure 2C shows a good agreement between measured LV pressure vs. the estimated LV pressure curve as a function of time (limit of agreement −8.9–8.9 mmHg).
Table 1.
Haemodynamic variables and loop areas in experimental study
| LBBB group |
Ischaemia group |
|||||
|---|---|---|---|---|---|---|
| Baseline (n = 6) | LBBB (n = 6) | Baseline (n = 6) | Ischaemia (n = 6) | |||
| Haemodynamic variables and ECG | ||||||
| Heart rate (b.p.m.) | 121 ± 17 | 122 ± 13 | 107 ± 16 | 134 ± 9* | ||
| QRS width (ms) | 68 ± 5 | 116 ± 7* | 69 ± 9 | 67 ± 8 | ||
| LV dP/dtmax (mmHg/s) | 1284 ± 198 | 1098 ± 189 | 1794 ± 337 | 1737 ± 102 | ||
| LV EDP (mmHg) | 10 ± 3 | 10 ± 4 | 8 ± 1 | 10 ± 2 | ||
| Peak LVP (mmHg) | 96 ± 12 | 94 ± 9 | 111 ± 11 | 114 ± 9 | ||
| Loop areas | ||||||
| Septum | Lateral wall | Septum | Lateral wall | Anterior wall | Anterior wall | |
| Invasive method | ||||||
| Loop area by LV pressure–strain(mmHg %) | 693 ± 256 | 659 ± 264 | 155 ± 289* | 1024 ± 486* | 932 ± 239 | 322 ± 250* |
| Non-invasive method | ||||||
| Loop area by estimated LVpressure–strain (mmHg %) | 839 ± 230 | 770 ± 269 | 227 ± 278* | 1031 ± 475* | 914 ± 242 | 295 ± 221* |
Values are mean ± SD. LBBB, left bundle branch block; EDP, end-diastolic pressure; anterior wall affected by ischaemia. Strain was measured by speckle tracking echocardiography.
*P < 0.05 vs. baseline.
Figure 2.
Comparison between estimated and measured left ventricular pressure. (A) Traces from a representative dog. (B) Point-for-point correlation between measured left ventricular pressure and the estimated left ventricular pressure curve for the same animal as in (A). (C) There was good agreement between measured left ventricular pressure vs. estimated left ventricular pressure as a function of time for all the animals (limits of agreement −8.9–8.9 mmHg).
Pressure–strain loops
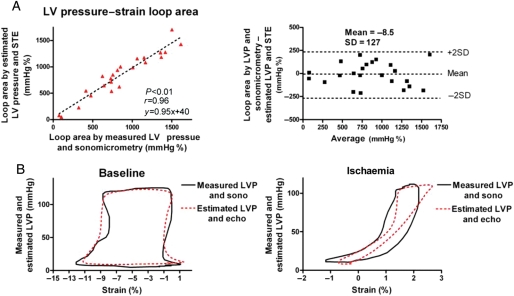
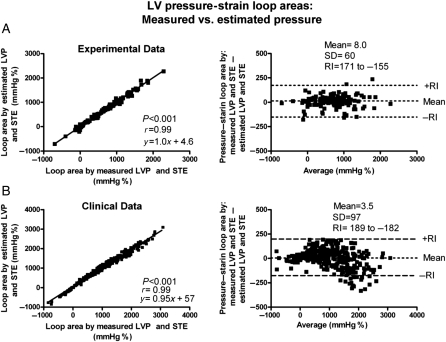
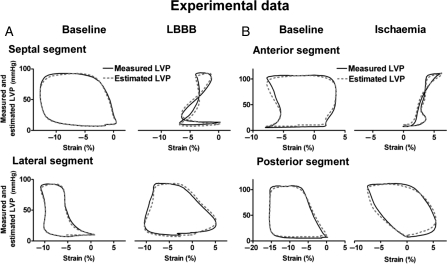
When comparing the areas of the pressure–strain loops using the estimated LV pressure curve and the LV pressure–segment length loop, there was an excellent correlation (r = 0.96) and a good agreement (Figure 3A and B). There was also an excellent correlation (r = 0.99) and a good agreement between areas of the pressure–strain loop using the estimated LV pressure curve and the pressure–strain loops using measured LVP (Figures 4A and 5A and B). Induction of LBBB was associated with a marked decrease in LV pressure–strain loop area in the septum and there was an increase in loop area in the LV lateral wall (Figure 5A and Table 1). As predicted, the LV pressure–strain loop area decreased significantly in the segments affected by ischaemia compared with baseline (Figures 3B and 5B, and Table 1).
Figure 3.
(A) Correlation and agreement between area of the pressure–strain loops by estimated left ventricular pressure and speckle tracking echocardiography vs. measured left ventricular pressure and sonomicrometry. (B) Representative traces showing pressure–strain loops by left ventricular pressure and sonomicrometry (black line) vs. estimated left ventricular pressure and echocardiography (red dotted line). Measurements during baseline (left panel) and ischaemia (right panel). Sono, sonomicrometry; echo, speckle tracking echocardiography.
Figure 4.
Correlation and agreement between area of the pressure–strain loops by estimated left ventricular pressure and speckle tracking echocardiography (STE) vs. measured left ventricular pressure and STE. (A) Experimental data. (B) Clinical data. Note that the same strain data are used for calculation by the two methods to show the isolated variation in loop area by using the non-invasive left ventricular pressure curve vs. measured left ventricular pressure. RI, reference interval.
Figure 5.
Representative traces showing pressure–strain loops by left ventricular pressure and speckle-tracking echocardiography (solid line) vs. estimated left ventricular pressure and speckle-tracking echocardiography (dashed line). Measurements during baseline and left bundle branch block (A) and during baseline and ischaemia (B) in the experimental dog model.
Relationship between myocardial work and pressure–strain loop area during LBBB
Induction of LBBB was associated with flattening of the septum relative to the lateral wall. This was expressed as a decrease in mean systolic curvature for the septum relative to the LV free wall: reduction in septal curvature/reduction in lateral wall curvature = 1.14. Furthermore, work done by the septum relative to the lateral wall was greater when calculated using curvature data and area–strain compared with calculations done using the non-invasive method with ratios of 0.54 ± 0.60 and 0.43 ± 0.67, respectively, but these differences were not statistically significant (P = 0.202). There was, however, an excellent correlation between the two methods (r = 0.97, y = 0.73x + 0.15, P < 0.0001) when comparing relative values between the septum and the LV lateral wall.
Clinical study
The patients had a QRS width of 140 ± 40 ms, a peak LVP of 128 ± 22 mmHg, and a heart rate of 73 ± 29 b.p.m. The peak brachial systolic pressure was 131 ± 19 mmHg.
Left ventricular pressure–strain loops
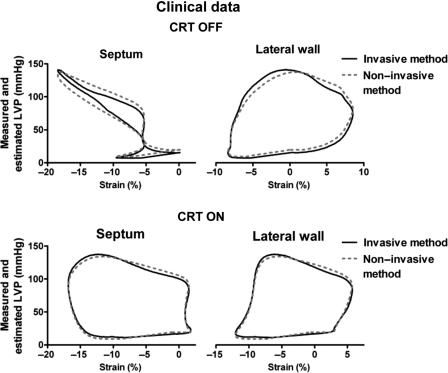
There was an excellent correlation (r = 0.99) and a good agreement between areas of the pressure–strain loops using measured and estimated LV pressure (Figure 4B). Similar to observations in the experimental study, patients with LBBB demonstrated markedly reduced work in the septum compared with the lateral wall (358 ± 512 vs. 1308 ± 495 and 402 ± 539 vs.1315 ± 473 mmHg %, by the invasive and non-invasive methods, respectively). Pressure–strain loops from a representative patient are displayed in Figure 6 and show how CRT alters loop areas. Also in the ischaemic cardiomyopathy patients without LBBB, findings were similar to those in the experimental study. The pressure–strain loop area was significantly reduced in areas supplied by an occluded coronary artery compared with areas with normal perfusion assessed by angiography (248 ± 629 vs.1181 ± 626 and 223 ± 636 vs.1186 ± 583, by the invasive and non-invasive methods, respectively).
Figure 6.
Loop areas by left ventricular pressure and speckle-tracking echocardiography (solid line) vs. the non-invasive method by estimated left ventricular pressure and speckle-tracking echocardiography (dashed line), for a septal and lateral wall segment in a patient with the cardiac resynchronization therapy device turned on and off.
Relationship between myocardial glucose metabolism (fluorodeoxyglucose positron emission tomography) and pressure–strain loop area during left bundle branch block
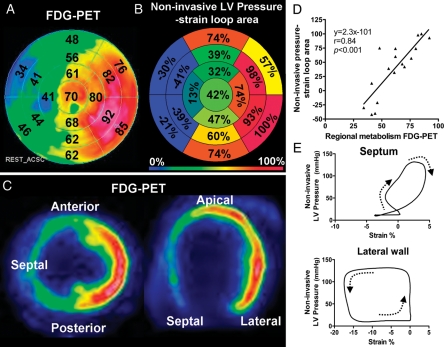
Glucose metabolism in the patients with LBBB showed significant regional differences and was highest in the lateral wall and lowest in the septum. The non-invasive LV pressure–strain loop area showed a pattern of regional work distribution which was very similar to the distribution of glucose uptake (Figure 7). The correlation between segmental values of the loop area and FDG uptake for all the patients was strong with average r = 0.81 and individual values ranging from 0.70 to 0.87.
Figure 7.
Data from one representative patient. (A) Bull's eye plot showing relative glucose metabolism by fluorodeoxyglucose positron emission tomography (FDG-PET) in a representative patient with left bundle branch block. The point in the left ventricular myocardium with the highest FDG uptake was used as a reference (100%), and segmental values were reported as percentages of this value. (B) Bull's eye plot with similar anatomical distribution as in (A), showing relative loop area by estimated left ventricular pressure and speckle-tracking echocardiography. The segment with the largest loop area was used as a reference (100%), and segmental values were reported as percentages of this value. (C) Correlation between regional metabolism by FDG-PET and loop area by estimated left ventricular pressure and speckle-tracking echocardiography. (D) Representative pictures showing regional distribution of glucose metabolism by FDG-PET for short-axis (left panel) and four-chamber (right panel) views. (E) Estimated left ventricular pressure and speckle-tracking echocardiography loops from the septum and lateral wall.
Interobserver variability
Measurements of 22 loop areas by two independent observers showed a mean difference of −46 mmHg % with an average loop area of 765 mmHg %. The intraclass correlation coefficient between the two observers was 0.99, indicating good reproducibility.
Discussion
In the present study, we demonstrate that LV pressure–strain loop area, which reflects regional LV myocardial work, can be measured clinically by an entirely non-invasive approach. This was feasible by combining a non-invasively estimated LV pressure curve with strain by STE. The validity of this method was confirmed in the experimental part of the study by an excellent correlation and a good agreement with loop area by invasive pressure–segment length analysis. In the clinical study, LV pressure–strain loop area using the non-invasive LV pressure curve showed a strong correlation and a good agreement with loop area using invasive LV pressure. When the non-invasive pressure–strain assessment was applied in patients with LBBB, we observed a marked non-uniformity in work distribution with reduced work in the septum and increased work in the LV lateral wall, suggesting that the work analysis may represent a means to explore the haemodynamic impact of electrical dyssynchrony and to monitor responses to CRT. Non-uniformity in work distribution was also apparent when comparing ischaemic vs. non-ischaemic segments. Furthermore, we show that non-invasive pressure–strain loop area reflects regional metabolism, which further supports its use as an index of myocardial work.
Calculation of work
In principle, the area of the myocardial force–dimension loop represents regional LV work and may also be used as a mechanical index of regional myocardial oxygen consumption.3 Regional work by force–dimension analysis can be measured in animal preparations using LV pressure in combination with sonomicrometry or cardiac magnetic resonance imaging and by taking local geometry into consideration.11,12 There is, however, no easily accessible clinical method to record myocardial force–dimension loops since calculation of force requires measurements which are difficult to obtain simultaneously and continuously throughout the heart cycle. In the present study, we used pressure as a substitute for force and the area of the LV pressure–strain loop was used as an index of regional work. This index does not provide a measure, which has units of work, and does not incorporate the modifying effect of local radii of curvature or contributions from different fibre orientations on force. To address these issues and in particular to explore how changes in septal curvature during LBBB would modify the ability of septal pressure–strain loop area to reflect the force–strain loop area, we performed additional analysis. This analysis showed that induction of LBBB was associated with a decrease in mean systolic (circumferential and longitudinal) curvature for both the septum and the lateral wall, compared with baseline. Although the septum flattens during LBBB as a result of its initial rapid contraction during IVC,8 the relative difference in mean systolic curvature between the septum and the lateral wall was not statistically significant because after this initial contraction, the septum was stretched and maintained its curvature during ejection relative to the lateral wall. We also observed a tendency, although not significant, that the relative difference in work done by the septum compared with the lateral wall was greater when calculated using curvature data and area–strain compared with calculations done using pressure–strain loop area. However, there was a strong correlation between relative work using the two methods (r = 0.97), indicating that the pressure–strain loop area gives adequate clinical information regarding relative differences in work distribution within the same heart. Furthermore, in our laboratory, we have previously demonstrated that changes in segmental pressure–dimension loops approximate changes in the stress–dimension loops during myocardial ischaemia.13
The ability of pressure length area to reflect myocardial oxygen consumption has been shown previously.6 In the present study, we found that the non-invasive LV pressure–strain loop area had a strong correlation and agreement with regional glucose metabolism using FDG-PET. Previous studies have shown that glucose metabolism reflects myocardial work,14 and this finding therefore supports our conclusion that pressure–strain loop area reflects differences in myocardial work distribution. The present findings of regional changes in work distribution in patients with LBBB are in keeping with the observations by Prinzen et al.12 in a dog model with right ventricular pacing.
Estimated left ventricular pressure curve
There are numerous techniques which can provide a more accurate central aortic pressure than just using brachial artery cuff pressure, and these may be applied in combination with the present method. However, when the non-invasive pressure method is used for comparing work between segments, the main issue is the abnormal distribution of work and not the absolute values.
It is important to note that the only application of the non-invasive pressure curve proposed in this study was to serve as a pressure estimate when calculating LV pressure–strain loop areas, and for this application, it served its purpose very well, as indicated by the excellent relationship to reference methods for pressure loop area. It does not have sufficient accuracy, however, to provide a measure of LV diastolic pressure or peak rate of rise or fall in LV pressure.
Whereas correct timing of peak LV pressure was of little importance for pressure–strain loop area, errors in timing of early systolic rise in pressure (IVC) and early-diastolic fall in LV pressure (IVR) would be expected to have effects on loop area, in particular when there is pre-ejection or post-ejection shortening. Thus, the pre-ejection septal shortening during LBBB which occurs against low LV pressure, and therefore represents little work, would appear erroneously as a more substantial work if timing of aortic valve opening (AVO) was set prematurely. Similarly, the work represented by post-systolic shortening in ischaemic myocardium would be overestimated if timing of aortic valve closure (AVC) was set too late. The error in timing of IVC and IVR, however, was minor as demonstrated by testing sensitivity to errors in timing of AVO and AVC (see Supplementary material online, Appendix S2). Strain by STE is dependent on image quality to be able to accurately track the speckles from frame to frame. Therefore, work analysis may not be feasible in all patients. Furthermore, in patients with valvular pathology such as aortic stenosis, the pressure gradient over the valve will invalidate peripheral systolic arterial pressure as an estimate of peak LV pressure, and in these patients, the use of the estimated non-invasive pressure does therefore not apply.
Limitations
The use of a reference curve to define timing of peak systolic pressure is in principle a limitation of the estimated pressure curve method since patients have different timing of peak LV pressure and this may vary from time to time in a given patient. This might have been improved by using brachial artery tonometry or a similar method to define timing of peak pressure and the pressure profile during LV ejection. However, additional analysis described in Supplementary material online, Appendix S2, showed that accurate timing of true peak pressure did not really matter since the impact on work of under- or overestimating LV pressure during the first part of the LV ejection phase was essentially compensated for by the opposite effect during the last part. For detection of more subtle differences in regional work, however, the use of a tonometrically recorded pressure curve may be of value. Measured LVP data from the analysed subject was not excluded from the average curve, as doing so did not significantly alter the estimated LV pressure waveform.
Speckle-tracking echocardiography measures motion in the image plane while sonomicrometry measures motion of material points in the myocardium. Therefore, a misalignment of the ultrasound plane vs. the crystals may account for some of the discrepancies between the two measurements. When calculating area strain and curvature, we used circumferential and longitudinal measurements obtained from two separate 2D echocardiographic projections. This method assumes that the projections are orthogonal and misalignment is a potential source of error.
Fluorodeoxyglucose positron emission tomography assesses glucose metabolism and will show increased uptake in areas both with aerobic and anaerobic (ischaemia) metabolism. Therefore, in the present study, we included only patients with a normal coronary angiography and no history of coronary artery disease. The observed abnormal changes in LV glucose metabolism during LBBB are in keeping with previous findings.15
The sample size in the present study is small and further validation of the findings should therefore be performed in a larger cohort; however, the consistency of the data support our findings.
Potential for clinical application
As suggested by previous studies,12,16,17 analysis of cardiac mechanics and regional work during ventricular dyssynchrony may provide important insights into mechanisms of remodelling and LV dysfunction. During LBBB, the early-activated septal segments produce little or negative work, while the late-activated segments are hyperstretched by the early septal contraction, and therefore generate more work than normal segments.8,12 The difference in intersegmental work distribution during LBBB is associated with differences in regional blood flow and oxygen demand and may also account for remodelling of the left ventricle.6,15,17,18 A clinical method which can assess regional work is therefore likely to provide important insights into cardiac mechanics and may be useful when evaluating patients who are candidates for CRT.
Because the proposed method uses LVP as a surrogate for force, it does not reflect changes in force that result from individual differences in LV geometry, and therefore, comparison between hearts is difficult. The most important application of the method would be to compare work between segments in a given ventricle. Such insight might be used to explore how non-uniformity of work distribution contributes to LV remodelling. Furthermore, studies should be done to determine whether work distribution during LV dyssynchrony may be used to identify responders to CRT and serve as a means to optimize electrode placement. Similar information cannot be obtained by just measuring strain, as illustrated by septal pre-ejection shortening and post-systolic shortening in the ischaemic myocardium which represent substantial shortening, but little work since LV pressure is low.
Conclusions
In the present study, we introduce a novel non-invasive method for LV pressure–strain analysis which may serve as a means to quantify regional myocardial work and may also provide information regarding metabolic demand. Assessing work distribution will give the clinician additional information when assessing patients with ischaemia and might be useful for selecting patients for CRT. Furthermore, work analysis may play an important part in optimizing CRT settings and improve responder rate. Further studies are needed to define the clinical role of the proposed method.
Supplementary material
Supplementary material is available at European Heart Journal online.
Funding
K.R., E.W.R., and O.G. were recipients of clinical research fellowships from the University of Oslo, Helse Sør-Øst, and The Norwegian Research Council, respectively.
Conflict of interest: none declared.
Supplementary Material
Acknowledgements
The expert technical assistance of Randi Moen Forfang with the PET studies is gratefully acknowledged.
References
- 1.Suga H. Total mechanical energy of a ventricle model and cardiac oxygen consumption. Am J Physiol. 1979;236:H498–H505. doi: 10.1152/ajpheart.1979.236.3.H498. [DOI] [PubMed] [Google Scholar]
- 2.Takaoka H, Takeuchi M, Odake M, Yokoyama M. Assessment of myocardial oxygen consumption (Vo2) and systolic pressure–volume area (PVA) in human hearts. Eur Heart J. 1992;13(Suppl. E):85–90. doi: 10.1093/eurheartj/13.suppl_e.85. [DOI] [PubMed] [Google Scholar]
- 3.Hisano R, Cooper G. Correlation of force–length area with oxygen consumption in ferret papillary muscle. Circ Res. 1987;61:318–328. doi: 10.1161/01.res.61.3.318. [DOI] [PubMed] [Google Scholar]
- 4.Tyberg JV, Forrester JS, Wyatt HL, Goldner SJ, Parmley WW, Swan HJ. An analysis of segmental ischemic dysfunction utilizing the pressure–length loop. Circulation. 1974;49:748–754. doi: 10.1161/01.cir.49.4.748. [DOI] [PubMed] [Google Scholar]
- 5.Forrester JS, Tyberg JV, Wyatt HL, Goldner S, Parmely WW, Swan HJ. Pressure–length loop: a new method for simultaneous measurement of segmental and total cardiac function. J Appl Physiol. 1974;37:771–775. doi: 10.1152/jappl.1974.37.5.771. [DOI] [PubMed] [Google Scholar]
- 6.Delhaas T, Arts T, Prinzen FW, Reneman RS. Regional fibre stress-fibre strain area as an estimate of regional blood flow and oxygen demand in the canine heart. J Physiol. 1994;477(Pt 3):481–496. doi: 10.1113/jphysiol.1994.sp020209. [DOI] [PMC free article] [PubMed] [Google Scholar]
- 7.Urheim S, Rabben SI, Skulstad H, Lyseggen E, Ihlen H, Smiseth OA. Regional myocardial work by strain Doppler echocardiography and LV pressure: a new method for quantifying myocardial function. Am J Physiol Heart Circ Physiol. 2005;288:H2375–H2380. doi: 10.1152/ajpheart.00946.2004. doi:10.1152/ajpheart.00946.2004. [DOI] [PubMed] [Google Scholar]
- 8.Gjesdal O, Remme EW, Opdahl A, Skulstad H, Russell K, Kongsgaard E, Edvardsen T, Smiseth OA. Mechanisms of abnormal systolic motion of the interventricular septum during left bundle-branch block. Circ Cardiovasc Imaging. 2011;4:264–273. doi: 10.1161/CIRCIMAGING.110.961417. doi:10.1161/CIRCIMAGING.110.961417. [DOI] [PubMed] [Google Scholar]
- 9.Martin WH, Jones RC, Delbeke D, Sandler MP. A simplified intravenous glucose loading protocol for fluorine-18 fluorodeoxyglucose cardiac single-photon emission tomography. Eur J Nucl Med. 1997;24:1291–1297. doi: 10.1007/s002590050154. doi:10.1007/s002590050154. [DOI] [PubMed] [Google Scholar]
- 10.Bland JM, Altman DG. Agreement between methods of measurement with multiple observations per individual. J Biopharm Stat. 2007;17:571–582. doi: 10.1080/10543400701329422. doi:10.1080/10543400701329422. [DOI] [PubMed] [Google Scholar]
- 11.Goto Y, Igarashi Y, Yasumura Y, Nozawa T, Futaki S, Hiramori K, Suga H. Integrated regional work equals total left ventricular work in regionally ischemic canine heart. Am J Physiol Heart Circ Physiol. 1988;254:H894–H904. doi: 10.1152/ajpheart.1988.254.5.H894. [DOI] [PubMed] [Google Scholar]
- 12.Prinzen FW, Hunter WC, Wyman BT, McVeigh ER. Mapping of regional myocardial strain and work during ventricular pacing: experimental study using magnetic resonance imaging tagging. J Am Coll Cardiol. 1999;33:1735–1742. doi: 10.1016/s0735-1097(99)00068-6. doi:10.1016/S0735-1097(99)00068-6. [DOI] [PMC free article] [PubMed] [Google Scholar]
- 13.Skulstad H, Edvardsen T, Urheim S, Rabben SI, Stugaard M, Lyseggen E, Ihlen H, Smiseth OA. Postsystolic shortening in ischemic myocardium: active contraction or passive recoil? Circulation. 2002;106:718–724. doi: 10.1161/01.cir.0000024102.55150.b6. doi:10.1161/01.CIR.0000024102.55150.B6. [DOI] [PubMed] [Google Scholar]
- 14.Bergman BC, Tsvetkova T, Lowes B, Wolfel EE. Myocardial glucose and lactate metabolism during rest and atrial pacing in humans. J Physiol. 2009;587(Pt 9):2087–2099. doi: 10.1113/jphysiol.2008.168286. doi:10.1113/jphysiol.2008.168286. [DOI] [PMC free article] [PubMed] [Google Scholar]
- 15.Nowak B, Sinha AM, Schaefer WM, Koch KC, Kaiser HJ, Hanrath P, Buell U, Stellbrink C. Cardiac resynchronization therapy homogenizes myocardial glucose metabolism and perfusion in dilated cardiomyopathy and left bundle branch block. J Am Coll Cardiol. 2003;41:1523–1528. doi: 10.1016/s0735-1097(03)00257-2. doi:10.1016/S0735-1097(03)00257-2. [DOI] [PubMed] [Google Scholar]
- 16.Prinzen FW, Cheriex EC, Delhaas T, van Oosterhout MFM, Arts T, Wellens HJJ, Reneman RS. Asymmetric thickness of the left ventricular wall resulting from asynchronous electric activation: a study in dogs with ventricular pacing and in patients with left bundle branch block. Am Heart J. 1995;130:1045–1053. doi: 10.1016/0002-8703(95)90207-4. doi:10.1016/0002-8703(95)90207-4. [DOI] [PubMed] [Google Scholar]
- 17.van Oosterhout MF, Prinzen FW, Arts T, Schreuder JJ, Vanagt WY, Cleutjens JP, Reneman RS. Asynchronous electrical activation induces asymmetrical hypertrophy of the left ventricular wall. Circulation. 1998;98:588–595. doi: 10.1161/01.cir.98.6.588. [DOI] [PubMed] [Google Scholar]
- 18.Prinzen FW, Augustijn CH, Arts T, Allessie MA, Reneman RS. Redistribution of myocardial fiber strain and blood flow by asynchronous activation. Am J Physiol. 1990;259(2 Pt 2):H300–H308. doi: 10.1152/ajpheart.1990.259.2.H300. [DOI] [PubMed] [Google Scholar]
Associated Data
This section collects any data citations, data availability statements, or supplementary materials included in this article.


