Abstract
The ability to assess frontal lobe function in a rapid, objective, and standardized way, without the need for expertise in cognitive test administration might be particularly helpful in mild traumatic brain injury (TBI), where objective measures are needed. Functional near infrared spectroscopy (fNIRS) is a reliable technique to noninvasively measure local hemodynamic changes in brain areas near the head surface. In this paper, we are combining fNIRS and frameless stereotaxy which allowed us to co-register the functional images with previously acquired anatomical MRI volumes. In our experiment, the subjects were asked to perform a task, evaluating the complexity of daily life activities, previously shown with fMRI to activate areas of the anterior frontal cortex. We reconstructed averaged oxyhemoglobin and deoxyhemoglobin data from 20 healthy subjects in spherical coordinate. The spherical coordinate is a natural representation of surface brain activation projection. Our results show surface activation projected from the medial frontopolar cortex which is consistent with previous fMRI results. With this original technique, we will construct a normative database for a simple cognitive test which can be useful in evaluating cognitive disability such as mild traumatic brain injury.
Keywords: Near infrared spectroscopy, frameless stereotaxy, frontal cortex, group study
Introduction
Traumatic brain injury (TBI) is a major public health problem, affecting almost 1.6 million people in the United States annually (Maas et al., 2008). TBI is also prevalent in the military population (Rish et al., 1983), ranging in severity from mild, closed TBI to penetrating head injuries (PHI) from low-velocity metallic shrapnel. The prefrontal cortex is particularly vulnerable to TBI and injuries there lead to impaired executive function which is a major source of disability and social displacement, even in patients who recover well in other spheres (Hanna-Pladdy, 2007; Salazar et al., 1995; Schwab et al., 1993). Functional neuroimaging, particularly functional magnetic resonance imaging (fMRI), which provides a local measure of Blood Oxygenation Level Dependent (BOLD) signal during behavior, is widely used to investigate cognitive processes and has been proposed as a means of evaluating deficits due to TBI and guiding rehabilitation (Dubroff and Newberg, 2008; Hillary et al., 2002; Laatsch, 2007; Ptito et al., 2007; Wishart et al., 2002). However, fMRI is relatively expensive, requires specialized, permanently sited, facilities and specialized personnel; these are often unavailable in the acute setting. Functional near infrared spectroscopy (fNIRS) is an established technique to noninvasively measure local hemodynamic changes in brain areas near the head surface. Multi-channel fNIRS systems can produce maps of brain activation during cognitive, perceptual, and motor tasks (Benaron et al., 2000; Boas et al., 2004; Villringer and Chance, 1997) and may have utility for imaging brain activation in neurological disease or after TBI. The technique takes advantage of the fact that biological tissues are relatively transparent to light in the near-infrared (700–1000 nm) range (Ferrari et al., 2004). Light sources, usually lasers, are applied to the scalp and surrounding detectors (optodes), a few centimeters away, detect the light as it scatters and diffuses through the underlying tissues. The system detects changes in the absorption spectrum of the tissue corresponding to local changes in oxyhemoglobin (HbO) and deoxyhemoglobin (HbR) concentrations related to regional brain activity. The blood flow response to brain activation shows the same overshoot in HbR. Familiar to fMRI users who use the BOLD contrast in the same way (Boas et al., 2004; Boas et al., 2003). fNIRS has the additional advantage of directly measuring HbO, HbR, and total hemoglobin concentration.
Though fMRI is useful in the diagnosis and development of treatment strategies for TBI, facilities with fMRI capability are not always readily available during the acute stage of head injury thus necessitating development of alternative approaches to functional imaging. fNIRS, with its simple and inexpensive apparatus, may represent a substitute for the current functional imaging “gold standard”, fMRI, where appropriate paradigms have been established and cross-validated. However, unlike fMRI which can provide registered functional and anatomical images, fNIRS images require registration with individual data or a standard anatomical system for interpretation and analysis. This requires co-registration with anatomical images and the need to develop simple, reproducible techniques for image construction. Several techniques have been developed to co-register functional images from fNIRS with structural images into a common space. However, this registration depends on the ability to reliably localize the optodes on the scalp. One technique is to use probabilistically locations on a pre-existing neurological atlas (Ayaz et al., 2006; Okamoto et al., 2004; Okamoto and Dan, 2005; Okamoto et al., 2009) for positioning the light sources and the detectors needed to acquire an fNIRS image. However, optode position is difficult to estimate without instrumentation, and errors can lead to unreliable fNIRS measurement (Kleinschmidt et al., 1996). Another solution is to acquire a structural head image including the locations of the optodes (Cui et al., 2010). However, this method does not allow positioning of optodes over specific brain areas or consistent optode positioning for repeated experiments. Additionally, the anatomical and functional images have to be acquired within a short time frame and the structural imaging device may have limited availability.
Co-registering physical points (optode coordinates) with two- or three-dimensional images (anatomical images) can be done with 3-D digitization and stereotaxic systems. The challenge consists in finding the appropriate registration algorithm. The alignment between the structural image (MRI generally) and the point surface measurement is done using landmark points (reference points easily identifiable), surface fitting alignment (surface of the scalp), or a combination of the two (Whalen et al., 2008). Such methods are commonly used for transcranial magnetic stimulation (TMS) and give good localization (Sparing et al., 2008). Frameless stereotaxy has the advantage of being able to co-register optode coordinates and the subject’s MRI, thereby allowing group analysis by registering group data in the same space and avoiding the need for anatomical scanning with the optodes in place.
Here, we replicated an fMRI study, using a simple fNIRS technique combined with frameless stereotaxy and a novel angular method to localize scalp activations. The goal was to quantitatively compare the locations of the activations detected with the two techniques and a preliminary estimate of individual topographical variation in the fNIRS measurements. This latter goal, in particular, is relevant to developing a clinical test. We adapted a cognitive activation paradigm (Krueger et al., 2009), which produced robust anterior frontal activation on fMRI, to the fNIRS environment.
Materials and methods
Participants
Twenty healthy native English speakers (10 females and 10 males; aged (mean±s.d) 28.3±5.7 years) participated in the experiment. None of the participants had a history of medical, psychiatric, or neurological disorder; no participant was taking neuroactive medications. Written informed consent was obtained and the study was approved by the Brain Institutional Review Board of the National Institutes of Health, Bethesda, MD, USA.
Experimental Design
We chose an event-related paradigm previously shown to produce robust activation in anterior frontal regions (Krueger et al., 2009). There were two conditions used: an experimental condition (Complexity task) and a control condition (Font task). Stimulus presentation was controlled by the E-prime software package (Psychology Software Tools, Inc., http://www.pstnet.com/eprime.cfm). Participants were first trained on a separate set of stimuli to familiarize them with the experiment. At the beginning of each trial, an instruction indicating the type of task (Complexity or Font) and the name of a daily-life activity, e.g., “stirring a cup of coffee”, were displayed on a computer monitor for 4 seconds. In the Complexity task, participants were asked to make a dichotomous decision about the complexity of the activity: simple: e.g., “stirring a cup of coffee” vs. complex: e.g., “planning a wedding”, using a two-button response pad. In the Font task, participants were asked to decide whether the instruction and the activity were presented in the same or different fonts. Participants were told to make their decisions as quickly and accurately as possible; response times and decisions were recorded. Trials were separated by a randomly varied interval of 6 to 8 seconds. The fNIRS experiment was a single 15-min run consisting of randomly ordered Font (n=33) and Complexity (n=33) trials. Stimuli were matched for word length between the Complexity and Font tasks. Before and after the experiment, a frameless stereotaxic registration procedure was performed.
Data acquisition
Structural MRI was performed on a GE 3.0T signa Hdx (General Electric, Milwaukee, WI, USA) equipped with a standard circularly polarized head coil using a T1-weighted 3D MP-RAGE sequence (repetition time=9.7 ms; echo time = 4.0ms; flip angle = 121; field of view = 240 mm; matrix size=256 × 256; slice thickness = 1.2 mm).
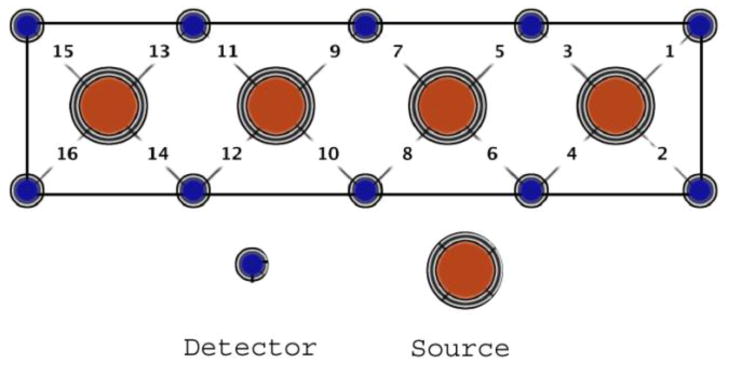
Hemodynamic response changes were recorded with a continuous wave fNIRS device with 4 light sources and 10 photodetectors (fNIR Devices LLC). Each source/detector pair was separated by dsd= 2.5 cm. The light sources were activated in sequence for collecting measurements from 16 different channels that spanned the forehead at 2Hz (Fig. 1). Each source emitted light at two different wavelengths (730 nm and 850 nm) at intensity I0; the detector measured the light emerging at intensity I. Variations in intensity at two wavelengths were transformed on HBR and HbO concentration using the modified Beer-Lambert law (Delpy et al., 1988; Izzetoglu et al., 2007).
Figure 1.
Optical sensor pad schematic. It is composed of 4 sources and 10 detectors which form 16 source/detector pairs separated by 2.5cm. The sensor pad is positioned on the volunteer’s forehead.
The locations of fNIRS sensors (sources and detectors) were co-registered with each subject’s MRI, using a frameless stereotaxy system (Brainsight, Rogue Research. Inc). The registration started with determining a set of anatomical landmarks (fiducial points), which could be identified in the two spaces (MR image and subject’s head space). By convention, and for reliability, the fiducial points typically used are the two pre-auricular points and the nasion (Whalen et al., 2008). The quality of the registration between the subject’s head and his/her anatomical MRI was controlled by looking at the coordinate of the stereotaxy tracker device, positioned on a different head surface point, on the MR image. Finally, the participant’s brain MRI was registered with the MNI atlas 152T1 (Fonov et al., 2010).
From the coordinates of the detectors in the MNI atlas and the geometry of the optical sensor (Figure1), we interpolated the position of the sources. We estimated the measurement point for one source and detector pair at an equal distance from the source and the detector.
Data analysis
Changes in HbO and HbR concentrations were recorded for the entire experiment. HbO and HbR changes for the 16 source/detector pairs were filtered with a Butterworth band pass filter (f1=0.02Hz, f2=0.8Hz, filter order = 10). For each event (33 Font trials and 33 Complexity trials), changes in HbO and HbR for the 10 seconds after stimulus presentation were extracted and averaged for each condition (Font or Complex task). Finally, for each source/detector pair, the Complexity condition was contrasted with the Font condition and normalized to the subject’s maximum intensity value from the 16 source/detector pairs for that condition.
For each subject, the 16 sets of Cartesian coordinates were registered to the MNI atlas and transformed into spherical coordinates. A spherical system is appropriate for fNIRS because, lacking depth information, the measurement is located on the head surface. In spherical coordinate, R, the distance between the origin and the optodes is not relevant for the image group reconstruction and the optodes location can be described with only two parameters: θ (azimuth angle) and ϕ (elevation angle). The origin of this coordinate system is the origin of the MNI atlas. The activation map for each subject was created from the normalized integrated hemodynamic response function (HRF) and interpolated over the surface. We made a group image from the average of the 20 individual activation maps. Finally, the 2-D images were wrapped on the surface of the cortex for better visualization.
Results
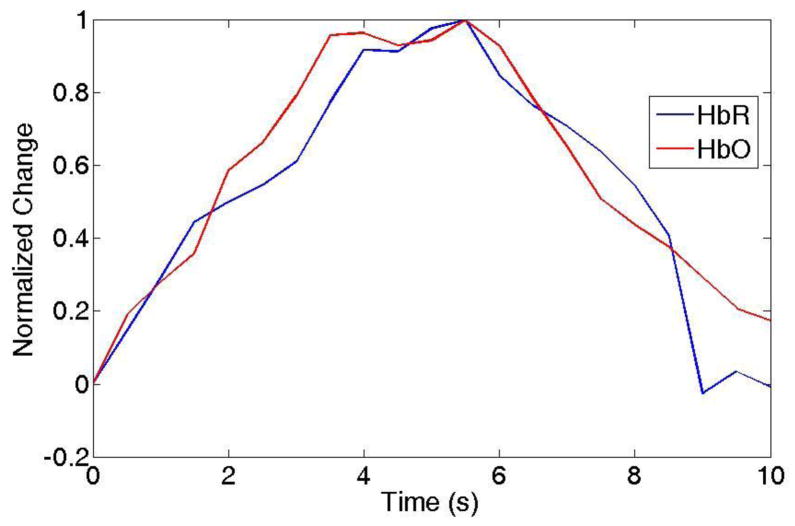
For each source/detector pair of a single subject, the Complexity condition was contrasted with the Font condition and normalized to the subject’s maximum intensity value from the 16 source/detector pairs for that condition.. Figure 2 shows the normalized contrasted HRF (HbO and HbR) for 20 subjects for the source/detector pair with the maximum activation intensity.
Figure 2.
Example of HRF for HbO and HbR changes due to local activation. The HbO and HbR were averaged with 20 subjects.
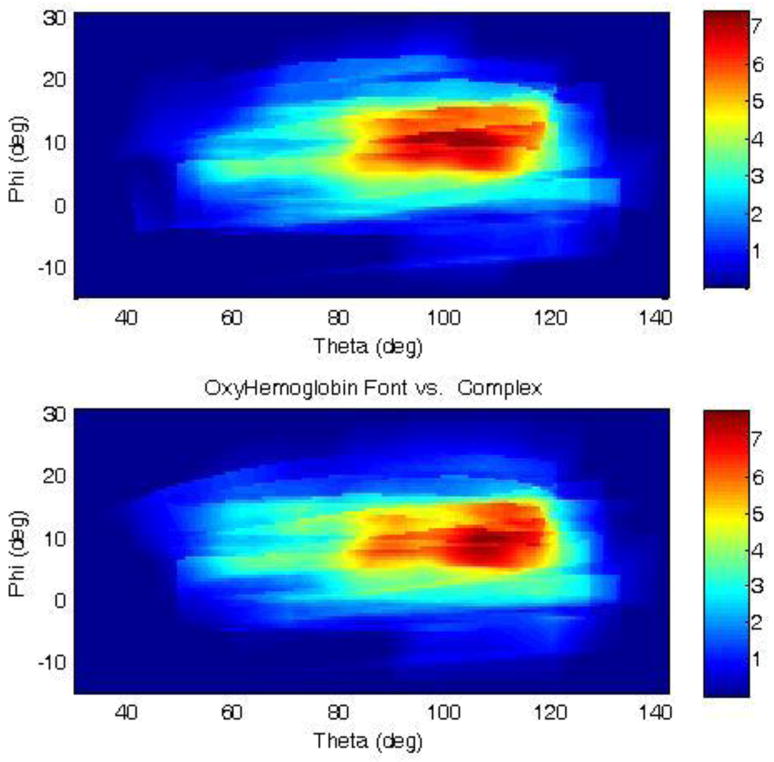
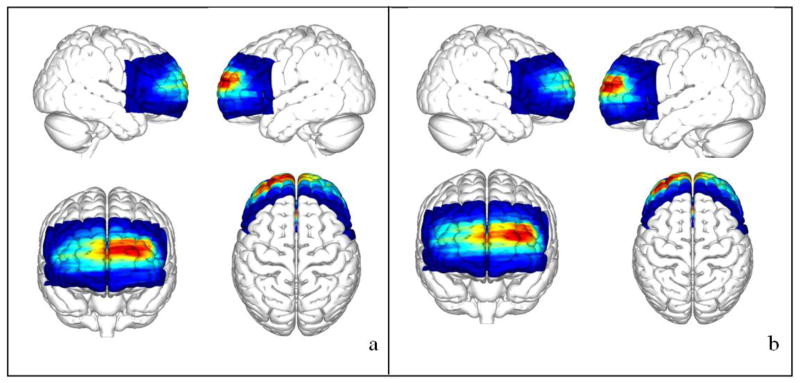
Activation maps were created for each subject from the 16 integrated HRFs. Each pixel of the activation map corresponds to one spherical coordinate in the MNI atlas. Figure 3 represents the average of the activation maps from the 20 subjects in the MNI space, using a spherical coordinate system. The centers of mass of the group activation maps were at the angle θ=95.0º±11.1 and φ=8.5º±6.7º for HbO and at the angle θ=95.2º±9.1 and φ=8.5º±7.0º for HbR (figure 4). The average of these two angles gives the Cartesian coordinates x= −7, y =85, z=13 in the MNI atlas. The corresponding maximum in the Krueger’s study (Krueger et al., 2009) was at −3, 66, 19, corresponding to Brodmann area 10. Projection of this location on the surface of the MNI atlas head yields a spherical coordinate location of θ=93.4º and φ=11.0º. The group analysis gives a mean activation at the angle θ=95.0º and φ=8.5º for HbO and at the angle θ=95.2 and φ=8.5º for HbR. The difference between the fMRI activation projected on the surface and our measured activation was 1.3 cm.
Figure 3.
HbO (upper figure) and HbR (lower figure) activation map for all subjects in the spherical coordinate. θ represents the elevation and ϕ HRF measured for each source/detector pair over 10 seconds interpolated over the entire image.
Figure 4.
HbR (a) and HbO (b) concentration map issued from the Fig. 3 wrap on the surface cortex of the MNI atlas.
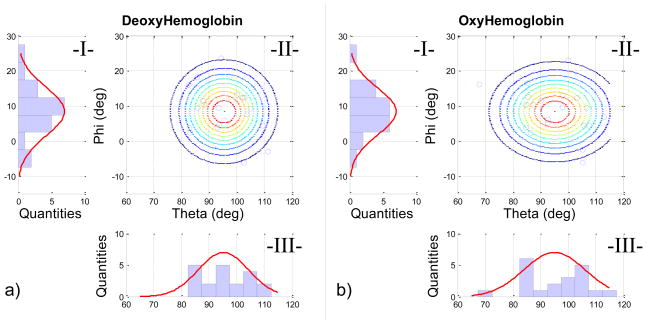
To evaluate the spatial variability of the peak Complexity-Font HRF difference across subjects, we created 2D probability maps for HbO and HbR (Fig. 5). Angular variation in the ϕ plane appeared normally distributed, whereas the variability in θ was irregular.
Figure 5.
Normal angular distribution for (a) HbR and (b) HbO for the 20 subjects. The 2-D angular distribution (II-a and II-b) is given by the normal distribution of elevation (red curve in I-a and I-b) and the normal distribution of the azimuth (red curve III-a and III-b). The lines in Fig. II-a and II-b are the iso-probability lines calculated; the blue circles represent the subject measurement.
Discussion
The prefrontal cortex is particularly vulnerable in TBI and physiological markers of brain function are mostly important for diagnosis in mild injury and prognosis across the severity spectrum. Physiological surrogates for behavioral outcomes are also needed for therapeutic trials. This is the first step in developing a simple method to evaluate the linkage of prefrontal cortex cognitive activity to hemodynamic response. In this experiment, we successfully used a cognitive task that had previously yielded medial frontopolar activation on fMRI (Krueger et al., 2009) to produce a robust effect detectable with a simple fNIRS system. Using stereotaxic registration with the individual subjects’ structural MRI data and a spherical coordinate system, we demonstrated that the activation originated in essentially the same location previously reported thereby showing that the within-subject variation in the location of peak activation was moderate and comparable to that in the fMRI findings. . However, the location is a projection of the activation on the head surface. The system cannot provide information about the depth location because of his low density sensors. The only depth information comes from the separation of the source and the detectors (2.5cm) and the associated Photon measurement density function which has a depth penetration close to 2.5cm. Only a higher density sensor system will be able to provide depth information (Wylie et al., 2009).
Applying the recording apparatus and administering the activation task took a combined time of approximately 20 minutes; our healthy subjects found the task easy to perform. An abbreviated data analysis, which simply contrasted the HRFs for the Complexity and Font conditions, perhaps integrating over source/detector pairs, could be easily automated to produce a score for the degree of activation, further simplifying the procedure. With further validation in clinical populations, this, or a similar technique, may produce objective and quantifiable diagnostic or prognostic data.
We used a combined stereotactic/fNIRS system to record the positions of the optodes on individual MRI scans and project the HRF measurement from the cognitive experiment. This allowed us to use a scan made before the actual experiment. Moreover, this enabled us to register the functional images with a brain atlas for group analysis. However, having shown that the activation we detected from the scalp corresponds with the surface projection of the BOLD response in the medial frontopolar cortex detected by Krueger et al. (2009), there would be no need for MRI co-registration in individual patients, should further studies demonstrate clinical utility for a diagnostic/prognostic fNIRS technique, based on this task.
In summary, we used a simple task to produce increased anterior frontal lobe blood flow and, by using MRI co-registration, group analysis, and an angular mapping technique, showed that the scalp activity detected with a simple NIRS apparatus corresponded to the spatial location of the blood flow change detected with fMRI during the same task. The combination of a somewhat easy activation task, simple and relatively inexpensive NIRS apparatus, application of the emitter/detector array over the hairless forehead, and single-subject analysis, which could be easily automated, makes our technique an attractive candidate for further validation in clinical populations. The ability to assesses frontal lobe function in a rapid, objective, and standardized way, without the need for expertise in cognitive test administration might be particularly helpful in mild traumatic brain injury, where objective measures are needed (Ruff, 2011).
Highlights.
Normative database of activation for the judgment of complexity task
Functional Near infrared spectroscopy images registered with MRI anatomical image
Activation in the prefrontal cortex which is consistent with previous fMRI results
Quick and easy detection of activation of frontal lobe in group study, creation of group data and look their variability
Acknowledgments
We thank Dr. Jordan Grafman for his valuable suggestions and comments on this project. We also acknowledge the funding of the intramural program of the Eunice Kennedy Shriver National Institute of Child Health and Human Development, the National Institute of Neurological Disorders and Stroke and Center for Neuroscience and Regenerative Medicine.
Footnotes
Publisher's Disclaimer: This is a PDF file of an unedited manuscript that has been accepted for publication. As a service to our customers we are providing this early version of the manuscript. The manuscript will undergo copyediting, typesetting, and review of the resulting proof before it is published in its final citable form. Please note that during the production process errors may be discovered which could affect the content, and all legal disclaimers that apply to the journal pertain.
References
- Ayaz H, Izzetoglu M, Platek SM, Bunce S, Izzetoglu K, Pourrezaei K, Onaral B. Registering fNIR data to brain surface image using MRI templates. Conf Proc IEEE Eng Med Biol Soc. 2006;1:2671–2674. doi: 10.1109/IEMBS.2006.260835. [DOI] [PubMed] [Google Scholar]
- Benaron DA, Hintz SR, Villringer A, Boas D, Kleinschmidt A, Frahm J, Hirth C, Obrig H, van Houten JC, Kermit EL, Cheong WF, Stevenson DK. Noninvasive functional imaging of human brain using light. J Cereb Blood Flow Metab. 2000;20:469–477. doi: 10.1097/00004647-200003000-00005. [DOI] [PubMed] [Google Scholar]
- Boas DA, Chen K, Grebert D, Franceschini MA. Improving the diffuse optical imaging spatial resolution of the cerebral hemodynamic response to brain activation in humans. Opt Lett. 2004;29:1506–1508. doi: 10.1364/ol.29.001506. [DOI] [PubMed] [Google Scholar]
- Boas DA, Strangman G, Culver JP, Hoge RD, Jasdzewski G, Poldrack RA, Rosen BR, Mandeville JB. Can the cerebral metabolic rate of oxygen be estimated with near-infrared spectroscopy? Phys Med Biol. 2003;48:2405–2418. doi: 10.1088/0031-9155/48/15/311. [DOI] [PubMed] [Google Scholar]
- Cui X, Bray S, Bryant DM, Glover GH, Reiss AL. A quantitative comparison of NIRS and fMRI across multiple cognitive tasks. Neuroimage. 2010;54:2808–2821. doi: 10.1016/j.neuroimage.2010.10.069. [DOI] [PMC free article] [PubMed] [Google Scholar]
- Delpy DT, Cope M, van der Zee P, Arridge S, Wray S, Wyatt J. Estimation of optical pathlength through tissue from direct time of flight measurement. Phys Med Biol. 1988;33:1433–1442. doi: 10.1088/0031-9155/33/12/008. [DOI] [PubMed] [Google Scholar]
- Dubroff JG, Newberg A. Neuroimaging of traumatic brain injury. Semin Neurol. 2008;28:548–557. doi: 10.1055/s-0028-1083698. [DOI] [PubMed] [Google Scholar]
- Ferrari M, Mottola L, Quaresima V. Principles, techniques, and limitations of near infrared spectroscopy. Can J Appl Physiol. 2004;29:463–487. doi: 10.1139/h04-031. [DOI] [PubMed] [Google Scholar]
- Fonov V, Evans AC, Botteron K, Almli CR, McKinstry RC, Collins DL. Unbiased average age-appropriate atlases for pediatric studies. Neuroimage. 2010;54:313–327. doi: 10.1016/j.neuroimage.2010.07.033. [DOI] [PMC free article] [PubMed] [Google Scholar]
- Hanna-Pladdy B. Dysexecutive syndromes in neurologic disease. J Neurol Phys Ther. 2007;31:119–127. doi: 10.1097/NPT.0b013e31814a63c2. [DOI] [PubMed] [Google Scholar]
- Hillary FG, Steffener J, Biswal BB, Lange G, DeLuca J, Ashburner J. Functional magnetic resonance imaging technology and traumatic brain injury rehabilitation: guidelines for methodological and conceptual pitfalls. J Head Trauma Rehabil. 2002;17:411–430. doi: 10.1097/00001199-200210000-00004. [DOI] [PubMed] [Google Scholar]
- Izzetoglu M, Bunce SC, Izzetoglu K, Onaral B, Pourrezaei K. Functional brain imaging using near-infrared technology. IEEE Eng Med Biol Mag. 2007;26:38–46. doi: 10.1109/memb.2007.384094. [DOI] [PubMed] [Google Scholar]
- Kleinschmidt A, Obrig H, Requardt M, Merboldt KD, Dirnagl U, Villringer A, Frahm J. Simultaneous recording of cerebral blood oxygenation changes during human brain activation by magnetic resonance imaging and near-infrared spectroscopy. J Cereb Blood Flow Metab. 1996;16:817–826. doi: 10.1097/00004647-199609000-00006. [DOI] [PubMed] [Google Scholar]
- Krueger F, Spampinato MV, Barbey AK, Huey ED, Morland T, Grafman J. The frontopolar cortex mediates event knowledge complexity: a parametric functional MRI study. Neuroreport. 2009;20:1093–1097. doi: 10.1097/WNR.0b013e32832e7ea5. [DOI] [PMC free article] [PubMed] [Google Scholar]
- Laatsch L. The use of functional MRI in traumatic brain injury diagnosis and treatment. Phys Med Rehabil Clin N Am. 2007;18:69–85. vi. doi: 10.1016/j.pmr.2006.11.004. [DOI] [PubMed] [Google Scholar]
- Maas AI, Stocchetti N, Bullock R. Moderate and severe traumatic brain injury in adults. Lancet Neurol. 2008;7:728–741. doi: 10.1016/S1474-4422(08)70164-9. [DOI] [PubMed] [Google Scholar]
- Okamoto M, Dan H, Sakamoto K, Takeo K, Shimizu K, Kohno S, Oda I, Isobe S, Suzuki T, Kohyama K, Dan I. Three-dimensional probabilistic anatomical cranio-cerebral correlation via the international 10–20 system oriented for transcranial functional brain mapping. Neuroimage. 2004;21:99–111. doi: 10.1016/j.neuroimage.2003.08.026. [DOI] [PubMed] [Google Scholar]
- Okamoto M, Dan I. Automated cortical projection of head-surface locations for transcranial functional brain mapping. Neuroimage. 2005;26:18–28. doi: 10.1016/j.neuroimage.2005.01.018. [DOI] [PubMed] [Google Scholar]
- Okamoto M, Tsuzuki D, Clowney L, Dan H, Singh AK, Dan I. Structural atlas-based spatial registration for functional near-infrared spectroscopy enabling inter-study data integration. Clin Neurophysiol. 2009;120:1320–1328. doi: 10.1016/j.clinph.2009.01.023. [DOI] [PubMed] [Google Scholar]
- Ptito A, Chen JK, Johnston KM. Contributions of functional magnetic resonance imaging (fMRI) to sport concussion evaluation. NeuroRehabilitation. 2007;22:217–227. [PubMed] [Google Scholar]
- Rish BL, Dillon JD, Weiss GH. Mortality following penetrating craniocerebral injuries. An analysis of the deaths in the Vietnam Head Injury Registry population. J Neurosurg. 1983;59:775–780. doi: 10.3171/jns.1983.59.5.0775. [DOI] [PubMed] [Google Scholar]
- Ruff RM. Mild traumatic brain injury and neural recovery: rethinking the debate. NeuroRehabilitation. 2011;28:167–180. doi: 10.3233/NRE-2011-0646. [DOI] [PubMed] [Google Scholar]
- Salazar AM, Schwab K, Grafman JH. Penetrating injuries in the Vietnam war. Traumatic unconsciousness, epilepsy, and psychosocial outcome. Neurosurg Clin N Am. 1995;6:715–726. [PubMed] [Google Scholar]
- Schwab K, Grafman J, Salazar AM, Kraft J. Residual impairments and work status 15 years after penetrating head injury: report from the Vietnam Head Injury Study. Neurology. 1993;43:95–103. doi: 10.1212/wnl.43.1_part_1.95. [DOI] [PubMed] [Google Scholar]
- Sparing R, Buelte D, Meister IG, Paus T, Fink GR. Transcranial magnetic stimulation and the challenge of coil placement: a comparison of conventional and stereotaxic neuronavigational strategies. Hum Brain Mapp. 2008;29:82–96. doi: 10.1002/hbm.20360. [DOI] [PMC free article] [PubMed] [Google Scholar]
- Villringer A, Chance B. Non-invasive optical spectroscopy and imaging of human brain function. Trends Neurosci. 1997;20:435–442. doi: 10.1016/s0166-2236(97)01132-6. [DOI] [PubMed] [Google Scholar]
- Whalen C, Maclin EL, Fabiani M, Gratton G. Validation of a method for coregistering scalp recording locations with 3D structural MR images. Hum Brain Mapp. 2008;29:1288–1301. doi: 10.1002/hbm.20465. [DOI] [PMC free article] [PubMed] [Google Scholar]
- Wishart HA, Saykin AJ, McAllister TW. Functional magnetic resonance imaging: emerging clinical applications. Curr Psychiatry Rep. 2002;4:338–345. doi: 10.1007/s11920-002-0081-y. [DOI] [PubMed] [Google Scholar]
- Wylie GR, Graber HL, Voelbel GT, Kohl AD, DeLuca J, Pei Y, Xu Y, Barbour RL. Using co-variations in the Hb signal to detect visual activation: a near infrared spectroscopic imaging study. Neuroimage. 2009;47:473–481. doi: 10.1016/j.neuroimage.2009.04.056. [DOI] [PMC free article] [PubMed] [Google Scholar]


