

Abstract
RNA folding is enabled by interactions between the nucleic acid and its ion atmosphere, the mobile sheath of aqueous ions that surrounds and stabilizes it. Understanding the ion atmosphere requires the interplay of experiment and theory. However, even an apparently simple experiment to probe the ion atmosphere—measuring the dependence of DNA duplex stability upon ion concentration and identity—suffers from substantial complexity, because the unfolded ensemble contains many conformational states that are difficult to treat accurately with theory. To minimize this limitation, we measured the unfolding equilibrium of a DNA hairpin using a single-molecule optical trapping assay, in which the unfolded state is constrained to a limited set of elongated conformations. The unfolding free energy increased linearly with the logarithm of monovalent cation concentration for several cations, such that smaller cations tended to favor the folded state. Mg2+ stabilized the hairpin much more effectively at low concentrations than did any of the monovalent cations. Poisson-Boltzmann theory captured trends in hairpin stability measured for the monovalent cation titrations with reasonable accuracy, but failed to do so for the Mg2+ titrations. This finding is consistent with previous work suggesting that Poisson-Boltzmann and other mean-field theories fail for higher valency cations where ionion correlation effects may become significant. The high-resolution data herein, because of the straightforward nature of both the folded and unfolded states, should serve as benchmarks for the development of more accurate electrostatic theories that will be needed for a more quantitative and predictive understanding of nucleic acid folding.
INTRODUCTION
RNA molecules carry genetic information and regulate gene expression in all kingdoms of life, and their cellular roles often depend on the intricate structures they can adopt and the interactions they make1. The acquisition of a functional form involves the pairing of single-stranded RNA into helices and, often, the juxtaposition of these helices into tertiary structure. For the folding process to be favorable, the energy of base pairing, stacking, and tertiary interactions must offset a concomitant reduction in the overall conformational entropy and an increase in the electrostatic repulsion between phosphate groups brought into proximity. Because RNA is strongly negatively charged, intra-molecular electrostatic repulsion would present an insurmountable barrier to folding, were it not mitigated by ions present in the immediate aqueous environment2. This environment, termed the ‘ion atmosphere,’ is enriched in cations and depleted of anions relative to the bulk solvent3,4, and rearranges in the event of folding or protein binding5.
To understand the role of the ion atmosphere in nucleic acid folding, an interplay of experimental studies and electrostatic theories is needed. The ion atmosphere is fluctuating and unstructured, making it challenging to probe both experimentally and theoretically6-8. The Poisson-Boltzmann (PB) theory takes a mean-field approach, treating the solvent as a continuum dielectric and the ions as non-interacting point charges6,9. This approach has been widely implemented, because of its relative simplicity and because several early studies comparing PB predictions with experimental observations found reasonable agreement (e.g., refs 10-12).
Studies of complex RNAs have provided useful insights into general folding behaviors, but they also involve caveats that limit their ability to evaluate theories rigorously. The electrostatic ‘relaxation’ of RNA molecules upon the addition of monovalent or divalent cations13-15 was shown to be broadly consistent with expectations from polyelectrolyte theories, with much lower concentrations of divalent cations than monovalent cations required to attain equivalent relaxation effects13,14,16. Furthermore, some measured aspects of Mg2+-induced tRNA17, 23S rRNA18 and RNA pseudoknot19 folding have been fit by PB calculations with reasonable success. However, such success may arise not because PB provides an accurate description of ion atmosphere-related energetics, but because the fits involved simplified treatments of molecular ensembles (e.g., the unfolded and intermediate states were represented by small subsets of the full ensemble of possible conformers, or by ad hoc models) and adjustable parameters (e.g., the energetic contribution from tertiary structure formation). Moreover, in some cases, the fits did not take into account energetic contributions from specific metal-ion binding.
In contrast to RNAs containing complex structures, smaller and simpler nucleic acids facilitate more direct comparisons between measurement and theory. Short DNA duplexes are structurally rigid, permitting direct probing of the shape20-22 and content3,23 of their ion atmospheres. However, a fully predictive understanding of the ion atmosphere should also describe its consequences for the thermodynamics of folding, conformational transitions, and binding events. To probe energetics in the context of a simple folding process and further evaluate PB, one recent study examined two DNA duplexes tethered by a simple neutral linker24. This system showed that PB theory can reasonably account for at least some aspects of the thermodynamic roles of monovalent cations, but cannot account for the effects of divalent cations in screening charges and relaxing conformational ensembles. Similar conclusions were drawn from studies of the ion atmosphere in the context of DNA duplex melting25-29. The two thermodynamic states in duplex melting correspond to all duplex base pairs being intact or broken, and define a measurable free-energy change (ΔG). But even for this apparently simple system, the comparison of experimental and theoretical trends in free energies is hindered by the extensive structural heterogeneity of the unfolded duplex ensemble30-32 (Figure 1).
Figure 1. Illustration of hairpin folding in the presence or absence of conformational constraint.
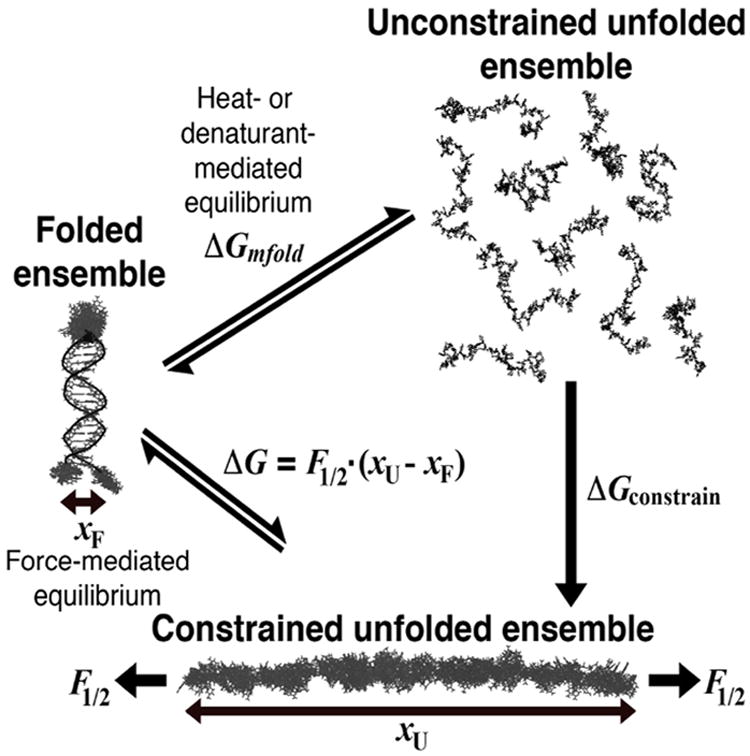
PB calculations were performed on ensembles of folded (left) and constrained unfolded (bottom) DNA hairpin structures representing the endpoints of folding in our single-molecule optical trapping assay. Positions of the nucleotides connecting the hairpin to the handles, in the folded hairpin loop, and in the entire unfolded hairpin were randomized by molecular dynamics. See text for explanations of variables.
Here, we introduce a new approach to evaluate ion atmosphere effects on folding, where the unfolded state is well defined. We followed the unfolding of a DNA hairpin using a single-molecule optical trapping assay that exerts tension on the 3′ and 5′ ends of the molecule (Figure 2A). Because the unfolded ensemble is physically constrained, it is extended and less structurally heterogeneous than a thermally or chemically denatured ensemble (Figure 1). This constraint allowed us to more fully represent the unfolded ensemble with all-atom models in PB calculations, rather than with the single cylindrical25,26,29,33,34 or ‘grooved’ models27,28 used previously. We measured trends in ΔG across a range of concentrations of several monovalent cations and Mg2+. Comparison of our experimental data and predictions from PB theory recapitulates the previously reported strengths and shortcomings of PB. More generally, these and additional force-induced unfolding data may provide simple and therefore powerful benchmarks for further tests and development of electrostatic theories.
Figure 2. Set-up of optical trapping experiments and sample data.
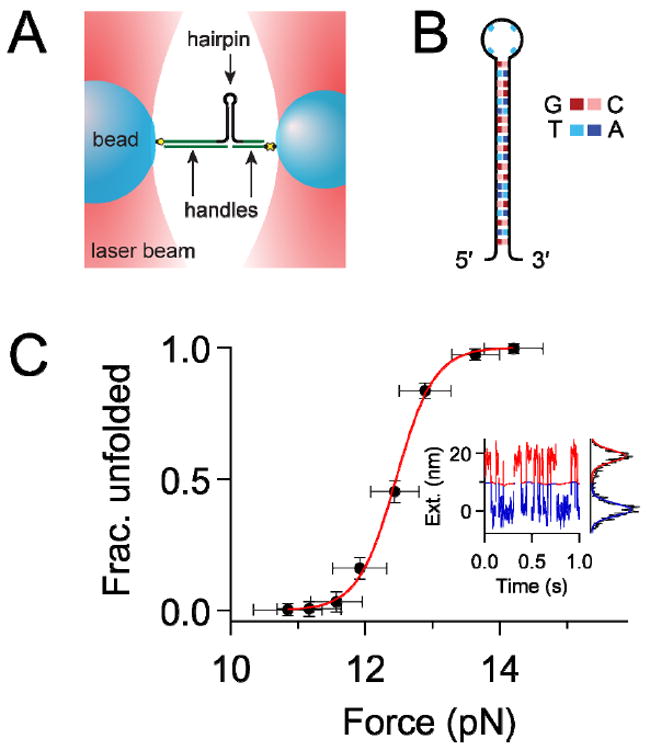
(A) Dumbbell single-molecule optical-trapping assay (not to scale). The DNA hairpin (black) was attached to two polystyrene beads (blue) through dsDNA handles (green) and specific chemical linkages (yellow). Each bead was held in a separate optical trap (red), and force was exerted on the hairpin by moving the traps apart. (B) The hairpin sequence used throughout this work. (C) Representative single-molecule data for a hairpin measured in 40 mM Na+. F1/2 was determined as the inflection point of a Boltzmann fit to the fraction of time in the unfolded state versus force. Inset, 1 s excerpt of the 10 s extension record corresponding to the point nearest to F1/2. The record was partitioned into the unfolded (red) and folded (blue) states, and a Gaussian function was fit to the histogram of points on each side of the partition. Δx (~18 nm) was determined as the distance between the peaks of the Gaussians.
EXPERIMENTAL SECTION
Optical trapping assay
The 20R55/4T DNA hairpin35 (Figure 2B) was attached to ~1 kb double-stranded DNA (dsDNA) handles and ~1 μm-diameter polystyrene beads to form dumbbells, which were measured in ionic solutions at 23 ± 0.5 °C using a dual-beam optical trapping instrument, as described (ref 35; see also Supporting Experimental Procedures). Trap stiffness was calibrated regularly as described36 by suspending beads in water and measuring Brownian fluctuations, Lorentzian roll-off frequencies and displacements under flow. When measuring in buffer, each dumbbell was first stretched to obtain a force-extension curve (FEC), with intensities of the traps adjusted to provide stiffnesses in the range of 0.2-0.3 pN/nm. The portion of the FEC corresponding to 0-8 pN was fit to the worm-like chain (WLC) interpolation formula37,38, and the dumbbell was discarded if the persistence length obtained was <20 nm (indicative of a multiple tether35). Otherwise, the dumbbell was measured in the passive optical force clamp39, with one bead pulled into the zero-stiffness region (ZSR) of the weaker trap, which was maintained ~3-fold less stiff than the other. As the intensity of this trap (and therefore the force) was stepped down sequentially, the bead moved within the ZSR and the hairpin was observed to fold and unfold stochastically, spending proportionately more time in the folded state (~ ≤1% to ≥99%). The force was held constant for the duration of each step (10 s). The displacements of the beads from the traps, from which forces and extensions were calculated, were sampled at 20 kHz, low-pass Bessel-filtered online at 10 kHz and median-smoothed offline over 3.1 ms, a window size determined empirically to preserve the briefest hairpin folding events under the experimental conditions.
Data analysis
The data obtained for each hairpin molecule consisted of several (≥5) 10 s records of extension and force. As previously35, each record was partitioned into two states, corresponding to the hairpin being fully open or closed, and sorted into 0.1 nm bins. Histograms of extension derived from the two states were well fit by Gaussians (Figure 2C), and the distance between the Gaussian peaks was interpreted as the raw hairpin opening distance. The final opening distance (Δx) for the record was obtained by rescaling this raw distance by an amount determined by the displacement of the bead in the weak trap from the trap center (see ref 39 and Figure S1). This rescaling factor averaged 0.97 (± 0.02 standard deviation) for all records from all molecules. Δx for each molecule was the average of the Δx values for the individual records, excluding those in which the hairpin spent >99% of the time in one state.
F1/2, the force at which the hairpin molecule spends equal times in the open and closed states, was determined from the midpoint of a Boltzmann fit to a plot of the fraction of time in the unfolded state versus force, with each point representing one record. Raw forces were based on trap stiffness calibrations performed in water. It is known that trap stiffness falls when solutes are added to an aqueous medium, arising mainly from an increase in the refractive index40. We re-measured the trap stiffness for every monovalent working buffer using the method of Brownian fluctuations, which is insensitive to minor differences in viscosity that may exist between buffers, and normalized the stiffness in each buffer to that measured in water (Figure S2). The forces for all molecules measured in each buffer were then scaled to the normalized stiffness. The stiffness did not change significantly when 10 mM MgCl2 was added to the 40 mM and 200 mM K+ buffers; we therefore used the normalized stiffness for the corresponding monovalent buffer when rescaling the divalent force data.
ΔG, the free energy of opening the hairpin, was the product of Δx and F1/2. Uncertainties in these parameters are discussed in the Supporting Experimental Procedures.
Hairpin energy landscape (HEL) model predictions
For each monovalent and divalent salt concentration, the model35,41 was run using the appropriate [Na+] and [Mg2+]-dependent DNA mfold energies for the hairpin base pairs and loop. (The sum of the mfold energies equaled, within error, the sum of the corresponding energies recently determined by Huguet et al.42 across the range of monovalent cation concentrations we tested. We therefore would not expect the HEL model to generate significantly different results using the latter set of energies.) Also input into the model were combinations of WLC parameters corresponding to integral values of force between 10 and 19 pN (inclusive), the approximate range of all experimental F1/2 values. Values for force-dependent extension per nucleotide (Db) of single-stranded DNA (ssDNA) were taken from previously published measurements of charomid DNA under low-salt conditions43. The per-nucleotide contour length (Dp) was determined by dividing Db by the fractional extension of ssDNA at the appropriate force and ionic strength, as modeled analytically by Cocco and co-workers44. ssDNA persistence length (Lp) was estimated using six previously published formulations that embody different dependencies on force and ion concentration (see Figure S3). The HEL model was run a total of 60 times per salt concentration (once per Lp estimate per force, at 10 different forces). As was done previously35, model results corresponding to different input parameters were averaged together for each condition. The reported model values of F1/2, Δx and ΔG (Figure 3, Figure 4, Table S1) represent the means ± standard deviations of these parameters from all successful runs (2290 out of 2340 for all conditions).
Figure 3. Monovalent titrations.
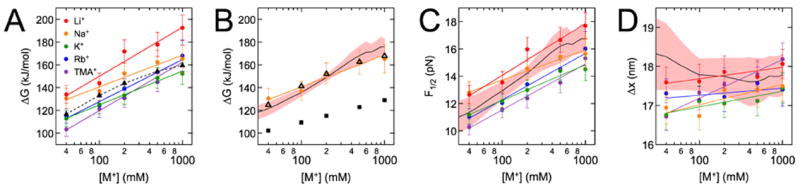
ΔG (A, B), F1/2 (C), and Δx (D) were measured (circles) for hairpin molecules in the presence of one of five monovalent ions (see legend). Ionic radii (in Å) are 3.6, 3.8, 4.2, 4.6 and 5.9 for Li+, Na+, K+, Rb+ and TMA+, respectively. (N.B: here we consider the radius inclusive of the first hydration shell46, since most ions in the ion atmosphere remain hydrated6.) Experimental error bars represent total uncertainty, i.e., the standard error on the mean of each measurement added to estimates of systematic uncertainty. Linear fits to the data are shown in color, with ΔGnon-el treated as an adjustable parameter. Values of ΔGel calculated with the PB equation (triangles) were fitted by χ2 minimization to all five data sets pooled together (A) or to the Na+ data set only (B). Uncertainties in the PB energies are smaller than the heights of the symbols. Predictions of experimental parameters were also calculated using the HEL model (black trace; uncertainty envelope in pink) and mfold (black squares, 5% uncertainties not shown).
Figure 4. Divalent titrations.
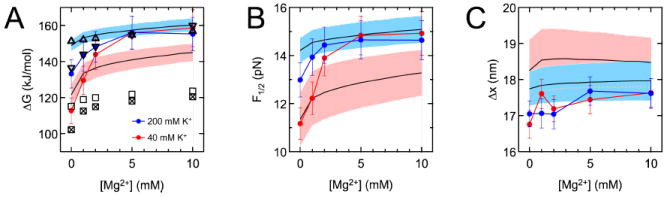
ΔG and ΔGel (A), F1/2 (B), and Δx (C) were measured (circles) and calculated for titrations of Mg2+ against K+ backgrounds. Experimental error bars are as reported in Figure 3. Data points are connected to guide the eye. PB energies (downward and upward-pointing triangles for 40 and 200 mM K+, respectively) were fitted by χ2 minimization to the experimental energies at 5 and 10 mM Mg2+ in each titration. Predictions from the HEL model and mfold are depicted by black traces (uncertainty envelopes for 40 and 200 mM K+ in pink and blue) and squares (crossed and open for 40 and 200 mM K+), respectively. Values of Δx (C) predicted by the HEL model overlapped substantially for the 40 and 200 mM K+ series; a pink dotted line denotes the bottom of the 40 mM uncertainty envelope.
Atomic models for Poisson-Boltzmann calculations
An initial atomic model of the folded DNA hairpin attached to two 25-bp handle fragments was created using Nucleic Acid Builder (NAB)45, using the same sequences that were present experimentally, and assuming B-form structures for the helical regions. The abasic sites separating the hairpin from its handles were replaced by thymidine residues in the model. To represent the system at forces just below the hairpin unfolding force, the handle fragments were placed as far apart as possible without causing unreasonable bond lengths. From this point, the handle fragments were moved a further 18 nm apart, in accordance with a previous measurement of this hairpin sequence35, to generate the initial unfolded model.
Control calculations performed on models incorporating a 17 nm distance change, a 5 Å/bp rise of the handle DNA, 10 bp handle fragments, or no handle DNA at all did not produce substantially different trends in unfolding energies (Table S2). Molecular dynamics simulations were conducted to generate molecular ensembles from the initial structures (see Supporting Experimental Procedures).
Poisson-Boltzmann calculations
We next calculated the electrostatic contributions to the unfolding energy of the DNA hairpin for each possible pair of folded and unfolded models, at each experimentally tested monovalent and divalent ion concentration. We assumed a thermodynamic cycle (Figure S4) in which the hairpin can fold in solution or in a vacuum, and determined the [M+]-dependent (or [Mg2+]-dependent) ΔG of unfolding in solution (ΔGel) as the appropriate sum of the ΔG of solvation (ΔGF, ΔGU) and folding in a vacuum (ΔGCoulomb). The ΔGF and ΔGU values were calculated using the Adaptive Poisson-Boltzmann Solver (APBS) 1.1.047 and the AMBER force field, as implemented in the PDB2PQR utility48,49, while the ΔGCoulomb values were evaluated using the APBS accessory program coulomb (see Supporting Experimental Procedures for further details). Substituting the CHARMM force field for the AMBER force field in the non-linear Poisson-Boltzmann calculations did not significantly affect trends in ΔGel (Table S2).
Size-modified Poisson-Boltzmann calculations were also conducted using an in-house modified version of APBS50, and the results did not strongly differ from those of standard PB (see Table 1 and Table S3).
Table 1.
Summary of fitting parameters for ΔG trends obtained from experimental monovalent titrations.a
| Ion | mdata | χ2HEL | χ2PB | χ2mfold |
|---|---|---|---|---|
| Li+ | 43 ± 9 | 1.4 | 3.3 | 9.1 |
| Na+ | 28 ± 9 | 2.2 | 0.75 | 1.4 |
| K+ | 30 ± 7 | 2.2 | 0.46 | 2.2 |
| Rb+ | 37 ± 8 | 0.60 | 1.5 | 5.2 |
| TMA+ | 43 ± 7 | 1.5 | 4.0 | 11.9 |
A line was fitted to the plot of experimental ΔG values versus log[M+] for each titration (Figure 3A) and the slope (mdata, in kJ/mol/log(mM)) was extracted. Similar linear fits to unfolding energies calculated from HEL, PB and mfold yielded slopes of 41 ± 3, 32 ± 1, and 20 ± 5, respectively. The calculated unfolding energies were also fitted to each experimental ΔG series using χ2 minimization, yielding the final χ2 values (with four degrees of freedom) shown.
RESULTS
The effect of varying cation concentration and identity on hairpin stability under force
Each molecule was measured in an optical force clamp35,39, which allows observation of the hairpin dynamically sampling the folded and unfolded states. Records of molecular end-to-end extension versus time revealed two stable states and directly yielded Δx, the change in extension between them. The value of ΔG for each molecule was calculated as the product of Δx and F1/2, the force at which the hairpin spends equal time in the two states, which was determined by gradually varying the applied force (see Figure 2C and Experimental Section).
To characterize the sensitivity of ΔG to the ion atmosphere, the unfolding process was measured across a range of monovalent ion concentrations. For each ion, ΔG increased approximately linearly with log[M+] (Figure 3A, Tables S4-S8), consistent with previous thermodynamic frameworks for duplex dissociation that separate ΔG into electrostatic (ΔGel) and non-electrostatic (ΔGnon-el) components29,33,51-55 (Eq. 1).
| (1) |
Electrostatic calculations are best used to supply differences in ΔG from one ionic condition to another—i.e., ΔΔG. Thus, we treat ΔGnon-el as a constant in order to evaluate the electrostatic component, ΔGel, both experimentally and computationally. In practice, this approximation holds over a wide range of ionic conditions (refs 25,26,33,51; see also refs 27,56). Here, ΔGnon-el incorporates, for example, the energies to disrupt base pairing and stacking. ΔGel arises mainly from releasing cations (and a corresponding number of anions, by charge neutrality) that are held close to the DNA to the bulk solvent4,57 upon duplex dissociation. This release, which yields less entropic benefit as the bulk concentrations of ions increase, occurs because ssDNA has a lower density of negative charges than dsDNA. The number of cations released (Δn) has been observed to be constant and independent of DNA concentration when bulk ions are present in excess (~0.1 mM – 1 M M+). Under these conditions, ΔGel is proportional to the logarithm of M+ 4,51,57-59:
| (2) |
A decrease in ΔG (the total energy to unfold the hairpin) indicates destabilization of the folded state relative to the unfolded state. We observed downward shifts in the measured ΔG series as the hydrated ionic radius46 was increased at each [M+] (Figure 3A, Figure S5A). This trend is consistent with larger counterions associating less closely and in smaller numbers with the folded hairpin. Such tendencies were suggested by experiments designed to monitor the competition between cations associating with DNA duplexes (Figure S5B)3,60. Our results are also consistent with previous data revealing that duplexes61-66 (as well as large RNAs13,67) are destabilized as larger cations in the ion atmosphere are substituted for smaller ones.
The slopes of lines fitted to the measured ΔG series (Figure 3A), which are proportional to Δn, were positively correlated with ionic radius (Table 1), although differences were not significant beyond experimental error, and Li+ (the smallest cation) did not follow this trend. Previous studies found that Δn exhibits little variation among the smallest monovalent cations62,64 but is lower for larger alkylammonium cations such as tetrame-thylammonium (TMA+)61,64.
Most of the differences in ΔG within each monovalent titration, and also between titrations, arose from differences in F1/2 (Figure 3C, Tables S4-S8): the measured values of Δx exhibited little variation, with a mean and standard deviation of 17.4 ± 0.4 nm for all titrations (Figure 3D, Tables S4-S8). Previous measurements68 have shown that the end-to-end extension of ssDNA increases with force but decreases with [M+], as ions better screen adjacent charges along the phosphate backbone and facilitate greater DNA compaction. We saw Δx rise slightly with [M+] over every titration. Thus, the effect of force prevails, but for most titrations, the overall change in Δx was negligible (<1 nm) and the values of Δx at the lowest and highest cation concentrations were not statistically different.
We also measured trends in ΔG as a function of the Mg2+ concentration (Figure 4A) in a background of 40 or 200 mM K+. Against a 40 mM K+ background, adding 5 mM Mg2+ stabilized the hairpin roughly as much as raising the K+ concentration to 1 M (Table S6). As was the case for all monovalent titrations, most if not all of the differences in ΔG were ascribable to differences in F1/2, and not Δx (Figure 4B and 4C).
In both K+ backgrounds, the experimental ΔG values increased substantially with [Mg2+] up to 5 mM, but only marginally thereafter (Figure 4A). In addition, the behavior of the two titrations converged at 5 mM Mg2+ and above. Similar patterns have been seen in the melting temperatures of DNA duplexes, which at ~10 mM Mg2+ reached apparent maxima and became insensitive to monovalent cation concentrations below ~100 mM62,69,70. The simplest explanation for our observations would be that the ion atmospheres of the folded and unfolded hairpins become saturated with Mg2+ when the bulk [Mg2+] reaches ~5 mM, such that K+ (whether present at 40 or 200 mM) is essentially excluded, and adding more Mg2+ has no effect. However, results from a cation competition experiment using a 24-bp DNA duplex cast doubt on this explanation. In the presence of 5 mM Mg2+ and 40 or 200 mM K+, the numbers of K+ ions remaining in the atmosphere were significant and differed depending on K+ concentration3.
More complex factors may therefore govern the energetics of DNA duplex folding in a mixture of monovalent and divalent cations. An early study using small-angle x-ray scattering (SAXS) revealed no changes in the normalized spatial distributions of monovalent and divalent cations around a DNA duplex as their relative abundances were changed, and the data were reasonably well predicted by PB20. However, small changes in the distributions may not have been resolvable with SAXS or PB, which does not account for finite ion size or ion-ion correlations and may inaccurately treat divalent cations near DNA71-77. The tightly bound ion theory, which accounts for the factors that PB does not, predicts a tighter association of Mg2+ with dsDNA28,56,78. This theory, along with additional experimental tests of the distributions of monovalent and divalent cations around dsDNA and ssDNA, could provide further insight. The diminishing increases we observed in ΔG as [Mg2+] was raised are likely due to the release of fewer Mg2+ ions to the bulk solvent upon unfolding, which has been documented previously69.
Hairpin energy landscape (HEL) model supports a simplified unfolded ensemble
We were motivated to study the process of hairpin unfolding by the expectation that a simpler and more defined unfolded ensemble would exist with the hairpin under force than when free in solution (Figure 1). Treating the unfolded hairpin as a worm-like chain79, we calculate an average Δx of ~5-8 nm in the absence of force under our conditions80. The experimentally determined values of Δx (~17-18 nm) are substantially larger and provide strong evidence that the unfolded state is elongated. To provide an independent test of this conclusion and to better understand our data, we compared them with the energetic predictions from two sources: the empirical mfold program81 and the semi-empirical hairpin energy landscape (HEL) model35,41.
Mfold provides estimates of the energies needed to break individual base pairs in a DNA helix in solution. These energies scale with the concentrations of monovalent (NaCl) and divalent (MgCl2) salts, and were summed to obtain predictions of ΔG for our hairpin. Because the mfold standard energies were established from large experimental datasets of duplex melting obtained in the absence of conformational constraint, we expected mfold to overestimate the entropy possessed by the unfolded hairpin in our experiment. A greater entropic gain upon unfolding, stabilizing the unfolded state relative to the folded state, would result in a smaller value of ΔG. Indeed, predictions of ΔG from mfold were consistently lower than those measured (Figure 3B, Figure S6).
The HEL model uses mfold as a starting point and adds the calculated energy of a hairpin as a function of its molecular end-to-end extension during mechanical unfolding. As each base pair is broken under force, the liberated nucleotides join growing strands of ssDNA on either side of the hairpin, and thereby increase the measured extension. Thus, the HEL model adds to the base-pair mfold energy the energy (ΔGconstrain) necessary to keep the ends of the hairpin separated. The stretching of ssDNA is modeled by a WLC function35. The HEL model predicts that two distinct potential wells occur at low and high extension, corresponding to the fully folded and unfolded states of the hairpin, and that the hairpin undergoes an extension change Δx (Figure 3D) to switch states. The HEL model also predicts values for F1/2 (Figure 3C) (by allowing the molecule to occupy these states with equal probability) and ΔGHEL (Figure 3B) (the product of F1/2 and Δx).
The HEL model generally captures trends in ΔG more accurately than mfold alone (Figure 3B), as it did previously for other hairpin sequences in 200 mM K+ 35,41 We emphasize that the HEL model produces absolute estimates of ΔG that may be directly compared with measured values, while electrostatic theories such as PB only estimate ΔGel and thus only changes in ΔG between ion concentrations. Here, the HEL model quantitatively reproduced values of ΔG across the full [M+] range. ΔGHEL most closely matched ΔG for the Na+ titration (Figure 3B, Figure S6, Table S1), likely because the mfold energies underlying the HEL calculations are based on measurements made in Na+. Nonetheless, the slope of the ΔGHEL trend was equal, within error, to slopes measured for the Li+, Rb+, and TMA+ titrations (Table 1).
The HEL model does not explicitly treat electrostatics. The [M+]-dependence of the calculated ΔGHEL values originates from the corresponding ion dependencies of ΔGmfold and the WLC parameters (see Experimental Section). One such parameter, the ssDNA contour length, was estimated using an analytical description44 of ssDNA stretching in the presence of monovalent cations, which, to our knowledge, has no analog for divalent cations. Perhaps for this reason, the HEL model underestimated the experimental increases in ΔG upon adding Mg2+ (Figure 4A), capturing the leveling-off of ΔG, but not the convergence between the two titrations. However, for the monovalent titrations, the HEL model predicted not only larger ΔG values than mfold, but also a steeper dependence of ΔG upon [M+] (Table 1, legend). In addition, the HEL model predicted that Δx would be largely insensitive to [M+], as measured (Figure 3D). These observations suggest that the HEL model captures the energy necessary to maintain the conformational constraint of the unfolded hairpin against ssDNA compaction as monovalent cations are added.
PB theory recapitulates trends in ΔG for monovalent but not divalent titrations
In parallel with our single-molecule measurements, we calculated electrostatic trends in ΔG versus [M+] using PB theory. he folded and constrained unfolded states of the hairpin were represented computationally by all-atom models of a B-form helix and elongated ssDNA, respectively, flanked by dsDNA handles (Figure 1). The distance changes modeled for unfolding were very close to the values of Δx measured here and in a previous study using the same hairpin sequence35, and a sensitivity analysis showed that minor differences in Δx did not significantly affect the goodness of the fits (see Experimental Section and Table S2). At each value of [M+], ‘virtual’ ion atmospheres were established around the folded and unfolded models according to the PB potential. Changes in the associated free energy of solvation were then calculated, and ΔGel was determined as part of a full thermodynamic cycle (see Experimental Section and Figure S4).
The calculated trend in ΔGel was nearly linear in log[M+], in agreement with the thermodynamic framework presented above [Equation (2)], and was fitted to the data aggregated across all ionic species (Figure 3A) or to the individual ionic series by varying the offset in energy (Figure 3B, Figure S6). PB does not explicitly consider ionic size, and therefore returns one ΔGel trend for all monovalent cations. The calculated trend was most similar to the K+ series (Table 1), in agreement with previous studies of folded DNA duplexes3,24. In general, there was good agreement between measured and calculated ΔG trends, which reflect changes in the relative stabilities of the folded and unfolded hairpin as the monovalent ion concentration is varied. As previous studies3,21,23,24 suggest that PB treats the association of monovalent ions with the folded hairpin with reasonable accuracy, our results suggest that PB also correctly treats monovalent ions around the unfolded hairpin.
While PB worked well in reproducing the trends of ΔGel for monovalent titrations, its efficacy was lower in the case of divalent titrations (Figure 4A). PB correctly predicted that the overall change in ΔG across a divalent titration would be larger against a less concentrated K+ background, but it significantly underestimated the magnitude of this change for both titrations. The PB results for 40 mM K+ showed ΔG saturating at high [Mg2+] but not increasing as much as measured for the lower Mg2+ concentrations, while the changes in ΔG for titrating Mg2+ against 200 mM K+ were insignificant. These results are consistent with previous quantitative failures of PB in capturing the association of Mg2+ with DNA duplexes3,24,27,29,78,82, and may result from ion-ion correlations, which the mean-field treatment in PB ignores. Such correlations allow Mg2+ ions to associate closely with folded duplexes in a coordinated manner and to displace monovalent ions to a greater extent than predicted by PB3,74,77, leading to greater stabilization of the folded hairpin.
DISCUSSION
Nucleic acid folding is enabled by interactions between the molecule itself and the many ions comprising its ion atmosphere. The energies of these interactions govern the shape and composition of the atmosphere, bias which conformations the molecule adopts, and substantially dictate the folding pathway of the molecule. Such energies have proven difficult to measure directly18,83,84 but are frequently estimated using electrostatic theories. Several decades ago, Record and co-workers conducted pioneering biochemical studies of DNA duplex melting54,85-87 and described the energetics of ion-DNA association using a theoretical framework that models the DNA backbone as a linear charge array. More recently, Draper and others have treated the folding of more complex nucleic acids using PB theory17-19,88,89, where advances in numerical methods have allowed calculations to be performed on arbitrary molecular conformations. These studies have provided valuable insights into nucleic acid folding. Nevertheless, the comparison of experiment and theory often requires the modeling of diverse conformational ensembles of unfolded (and partially folded) molecules in solution, which presents significant computational and theoretical challenges. Such diversity limits the use of experimental equilibria as benchmarks for developing and evaluating theoretical treatments of the influence of the ion atmosphere on nucleic acid energetics.
More direct comparisons can be made using simple nucleic acid systems where the range of accessible molecular conformations is limited. The ion-counting study mentioned above3 focused on short DNA duplexes, which are structurally rigid and do not dissociate under mild conditions. Such studies provide fundamental experimental characterizations of the ion atmosphere around nucleic acids and can provide rich datasets for comparison with theory. Nevertheless, these studies do not report directly on thermodynamic equilibria.
Here, we have returned to the thermodynamics of DNA duplex melting as a function of the ionic composition of the solution, akin to the earlier studies25-27,29,33,34,53,54,59,62,64,69,70,78,85,87,90,91, but have used force to impose useful conformational constraints on the unfolded hairpin, rendering the modeling of this ensemble more reliable, and facilitating comparisons of experiment and theory.
Our data support conclusions from prior studies that PB theory reasonably captures the energetic effects of monovalent cations on simple nucleic acid equilibria, but not those of divalent cations (refs 24-28,78; see also refs 3,20,21,72). These conclusions thus hold despite potential difficulties in modeling the complex ensemble of unfolded single-stranded states free in solution. Improvements to PB, or alternative theories, will therefore be needed to capture the full energetic role of diffuse, divalent cations in the nucleic acid folding process, as well as to incorporate salient details such as cationic size and ion-ion correlations (see e.g., refs 50,56,73,92, and references therein). To this end, the experimental data presented here should provide benchmarks for the development and evaluation of more advanced electrostatic theories.
Supplementary Material
Acknowledgments
This work was funded by graduate fellowships from the National Science Foundation (to P.C.A.), the Agency of Science, Technology, and Research of Singapore (to A.Y.L.S), and the Stanford Bio-X Program (to V.B.C), and by NIH grants GM 49243 (to D.H.) and GM 57035 (to S.M.B.). We further acknowledge use of computational resources at the Bio-X cluster, Stanford University (NSF award CNS-619926) and the National Energy Research Scientific Computing Center (supported by the Office of Science, U.S. Department of Energy under Contract No. DE-AC02-05CH11231).
Footnotes
Supporting Information Available. Additional experimental procedures; figures illustrating details of instrument calibration and PB calculations; figures presenting additional analyses of data and comparisons with HEL, PB, SMPB and mfold results; and tables summarizing experimental data and theoretical results. This material is available free of charge via the Internet at http://pubs.acs.org.
References
- 1.Cruz JA, Westhof E. Cell. 2009;136:604–9. doi: 10.1016/j.cell.2009.02.003. [DOI] [PubMed] [Google Scholar]
- 2.Chu VB, Bai Y, Lipfert J, Herschlag D, Doniach S. Curr Opin Chem Biol. 2008;12:619–25. doi: 10.1016/j.cbpa.2008.10.010. [DOI] [PMC free article] [PubMed] [Google Scholar]
- 3.Bai Y, Greenfeld M, Travers KJ, Chu VB, Lipfert J, Doniach S, Herschlag D. J Am Chem Soc. 2007;129:14981–8. doi: 10.1021/ja075020g. [DOI] [PMC free article] [PubMed] [Google Scholar]
- 4.Record MT, Jr, Anderson CF, Lohman TM. Q Rev Biophys. 1978;11:103–78. doi: 10.1017/s003358350000202x. [DOI] [PubMed] [Google Scholar]
- 5.Garcia-Garcia C, Draper DE. J Mol Biol. 2003;331:75–88. doi: 10.1016/s0022-2836(03)00615-6. [DOI] [PubMed] [Google Scholar]
- 6.Draper DE. Biophys J. 2008;95:5489–95. doi: 10.1529/biophysj.108.131813. [DOI] [PMC free article] [PubMed] [Google Scholar]
- 7.Manning GS. Journal of Chemical Physics. 1969;51:924. [Google Scholar]
- 8.Sharp KA, Honig B. Curr Opin Struct Biol. 1995;5:323–8. doi: 10.1016/0959-440x(95)80093-x. [DOI] [PubMed] [Google Scholar]
- 9.Honig B, Nicholls A. Science. 1995;268:1144–9. doi: 10.1126/science.7761829. [DOI] [PubMed] [Google Scholar]
- 10.Misra VK, Draper DE. J Mol Biol. 1999;294:1135–47. doi: 10.1006/jmbi.1999.3334. [DOI] [PubMed] [Google Scholar]
- 11.Misra VK, Sharp KA, Friedman RA, Honig B. J Mol Biol. 1994;238:245–63. doi: 10.1006/jmbi.1994.1285. [DOI] [PubMed] [Google Scholar]
- 12.Rouzina I, Bloomfield VA. Biophys Chem. 1997;64:139–55. doi: 10.1016/s0301-4622(96)02231-4. [DOI] [PubMed] [Google Scholar]
- 13.Heilman-Miller SL, Thirumalai D, Woodson SA. J Mol Biol. 2001;306:1157–66. doi: 10.1006/jmbi.2001.4437. [DOI] [PubMed] [Google Scholar]
- 14.Perez-Salas UA, Rangan P, Krueger S, Briber RM, Thirumalai D, Woodson SA. Biochemistry. 2004;43:1746–53. doi: 10.1021/bi035642o. [DOI] [PubMed] [Google Scholar]
- 15.Russell R, Millett IS, Tate MW, Kwok LW, Nakatani B, Gruner SM, Mochrie SG, Pande V, Doniach S, Herschlag D, Pollack L. Proc Natl Acad Sci U S A. 2002;99:4266–71. doi: 10.1073/pnas.072589599. [DOI] [PMC free article] [PubMed] [Google Scholar]
- 16.Das R, Kwok LW, Millett IS, Bai Y, Mills TT, Jacob J, Maskel GS, Seifert S, Mochrie SG, Thiyagarajan P, Doniach S, Pollack L, Herschlag D. J Mol Biol. 2003;332:311–9. doi: 10.1016/s0022-2836(03)00854-4. [DOI] [PubMed] [Google Scholar]
- 17.Misra VK, Draper DE. J Mol Biol. 2002;317:507–21. doi: 10.1006/jmbi.2002.5422. [DOI] [PubMed] [Google Scholar]
- 18.Grilley D, Misra V, Caliskan G, Draper DE. Biochemistry. 2007;46:10266–78. doi: 10.1021/bi062284r. [DOI] [PubMed] [Google Scholar]
- 19.Soto AM, Misra V, Draper DE. Biochemistry. 2007;46:2973–83. doi: 10.1021/bi0616753. [DOI] [PubMed] [Google Scholar]
- 20.Andresen K, Das R, Park HY, Smith H, Kwok LW, Lamb JS, Kirkland EJ, Herschlag D, Finkelstein KD, Pollack L. Phys Rev Lett. 2004;93:248103. doi: 10.1103/PhysRevLett.93.248103. [DOI] [PubMed] [Google Scholar]
- 21.Das R, Mills TT, Kwok LW, Maskel GS, Millett IS, Doniach S, Finkelstein KD, Herschlag D, Pollack L. Phys Rev Lett. 2003;90:188103. doi: 10.1103/PhysRevLett.90.188103. [DOI] [PubMed] [Google Scholar]
- 22.Pabit SA, Qiu X, Lamb JS, Li L, Meisburger SP, Pollack L. Nucleic Acids Res. 2009;37:3887–96. doi: 10.1093/nar/gkp257. [DOI] [PMC free article] [PubMed] [Google Scholar]
- 23.Pabit SA, Meisburger SP, Li L, Blose JM, Jones CD, Pollack L. J Am Chem Soc. 2010;132:16334–6. doi: 10.1021/ja107259y. [DOI] [PMC free article] [PubMed] [Google Scholar]
- 24.Bai Y, Chu VB, Lipfert J, Pande VS, Herschlag D, Doniach S. J Am Chem Soc. 2008;130:12334–41. doi: 10.1021/ja800854u. [DOI] [PMC free article] [PubMed] [Google Scholar]
- 25.Bond JP, Anderson CF, Record MT., Jr Biophys J. 1994;67:825–36. doi: 10.1016/S0006-3495(94)80542-9. [DOI] [PMC free article] [PubMed] [Google Scholar]
- 26.Shkel IA, Record MT., Jr Biochemistry. 2004;43:7090–101. doi: 10.1021/bi036225e. [DOI] [PubMed] [Google Scholar]
- 27.Tan ZJ, Chen SJ. Biophys J. 2006;90:1175–90. doi: 10.1529/biophysj.105.070904. [DOI] [PMC free article] [PubMed] [Google Scholar]
- 28.Tan ZJ, Chen SJ. Biophys J. 2007;92:3615–32. doi: 10.1529/biophysj.106.100388. [DOI] [PMC free article] [PubMed] [Google Scholar]
- 29.Korolev N, Lyubartsev AP, Nordenskiold L. Biophys J. 1998;75:3041–56. doi: 10.1016/S0006-3495(98)77745-8. [DOI] [PMC free article] [PubMed] [Google Scholar]
- 30.Goddard NL, Bonnet G, Krichevsky O, Libchaber A. Phys Rev Lett. 2000;85:2400–3. doi: 10.1103/PhysRevLett.85.2400. [DOI] [PubMed] [Google Scholar]
- 31.Jung J, Van Orden A. J Am Chem Soc. 2006;128:1240–9. doi: 10.1021/ja0560736. [DOI] [PubMed] [Google Scholar]
- 32.Ma H, Proctor DJ, Kierzek E, Kierzek R, Bevilacqua PC, Gruebele M. J Am Chem Soc. 2006;128:1523–30. doi: 10.1021/ja0553856. [DOI] [PubMed] [Google Scholar]
- 33.Korolev N, Lyubartsev AP, Nordenskiold L. J Biomol Struct Dyn. 2002;20:275–90. doi: 10.1080/07391102.2002.10506843. [DOI] [PubMed] [Google Scholar]
- 34.MacGillivray AD, McMullen AI. J Theor Biol. 1968;19:159–68. doi: 10.1016/0022-5193(68)90111-2. [DOI] [PubMed] [Google Scholar]
- 35.Woodside MT, Behnke-Parks WM, Larizadeh K, Travers K, Herschlag D, Block SM. Proc Natl Acad Sci U S A. 2006;103:6190–5. doi: 10.1073/pnas.0511048103. [DOI] [PMC free article] [PubMed] [Google Scholar]
- 36.Neuman KC, Block SM. Rev Sci Instrum. 2004;75:2787–809. doi: 10.1063/1.1785844. [DOI] [PMC free article] [PubMed] [Google Scholar]
- 37.Marko JF, Siggia ED. Macromolecules. 1995;28:8759–8770. [Google Scholar]
- 38.Bustamante C, Marko JF, Siggia ED, Smith S. Science. 1994;265:1599–1600. doi: 10.1126/science.8079175. [DOI] [PubMed] [Google Scholar]
- 39.Greenleaf WJ, Woodside MT, Abbondanzieri EA, Block SM. Phys Rev Lett. 2005;95:208102. doi: 10.1103/PhysRevLett.95.208102. [DOI] [PMC free article] [PubMed] [Google Scholar]
- 40.Svoboda K, Block SM. Cell. 1994;77:773–84. doi: 10.1016/0092-8674(94)90060-4. [DOI] [PubMed] [Google Scholar]
- 41.Woodside MT, Anthony PC, Behnke-Parks WM, Larizadeh K, Herschlag D, Block SM. Science. 2006;314:1001–4. doi: 10.1126/science.1133601. [DOI] [PMC free article] [PubMed] [Google Scholar]
- 42.Huguet JM, Bizarro CV, Forns N, Smith SB, Bustamante C, Ritort F. Proc Natl Acad Sci U S A. 2010;107:15431–6. doi: 10.1073/pnas.1001454107. [DOI] [PMC free article] [PubMed] [Google Scholar]
- 43.Dessinges MN, Maier B, Zhang Y, Peliti M, Bensimon D, Croquette V. Phys Rev Lett. 2002;89:248102. doi: 10.1103/PhysRevLett.89.248102. [DOI] [PubMed] [Google Scholar]
- 44.Cocco S, Marko JF, Monasson R, Sarkar A, Yan J. Eur Phys J E Soft Matter. 2003;10:249–63. doi: 10.1140/epje/i2002-10113-2. [DOI] [PubMed] [Google Scholar]
- 45.Macke TJ, Case DA. Molecular Modeling of Nucleic Acids. 1998;682:379–393. [Google Scholar]
- 46.Ohtaki H, Radnai T. Chemical Reviews. 1993;93:1157–1204. [Google Scholar]
- 47.Baker NA, Sept D, Joseph S, Holst MJ, McCammon JA. Proceedings of the National Academy of Sciences of the United States of America. 2001;98:10037–10041. doi: 10.1073/pnas.181342398. [DOI] [PMC free article] [PubMed] [Google Scholar]
- 48.Dolinsky TJ, Czodrowski P, Li H, Nielsen JE, Jensen JH, Klebe G, Baker NA. Nucleic Acids Res. 2007;35:W522–5. doi: 10.1093/nar/gkm276. [DOI] [PMC free article] [PubMed] [Google Scholar]
- 49.Dolinsky TJ, Nielsen JE, McCammon JA, Baker NA. Nucleic Acids Res. 2004;32:W665–7. doi: 10.1093/nar/gkh381. [DOI] [PMC free article] [PubMed] [Google Scholar]
- 50.Chu VB, Bai Y, Lipfert J, Herschlag D, Doniach S. Biophys J. 2007;93:3202–9. doi: 10.1529/biophysj.106.099168. [DOI] [PMC free article] [PubMed] [Google Scholar]
- 51.Frankkamenetskii MD, Anshelevich VV, Lukashin AV. Uspekhi Fizicheskikh Nauk. 1987;151:595–618. [Google Scholar]
- 52.Kotin L. J Mol Biol. 1963;7:309–11. doi: 10.1016/s0022-2836(63)80009-1. [DOI] [PubMed] [Google Scholar]
- 53.Schildkraut C. Biopolymers. 1965;3:195–208. doi: 10.1002/bip.360030207. [DOI] [PubMed] [Google Scholar]
- 54.Record MT., Jr Biopolymers. 1967;5:975–92. doi: 10.1002/bip.1967.360051010. [DOI] [PubMed] [Google Scholar]
- 55.Baldwin RL. Accounts of Chemical Research. 1971;4:265. [Google Scholar]
- 56.Tan ZJ, Chen SJ. Methods Enzymol. 2009;469:465–87. doi: 10.1016/S0076-6879(09)69022-4. [DOI] [PMC free article] [PubMed] [Google Scholar]
- 57.Leipply D, Lambert D, Draper DE. Methods Enzymol. 2009;469:433–63. doi: 10.1016/S0076-6879(09)69021-2. [DOI] [PMC free article] [PubMed] [Google Scholar]
- 58.Record MT, Jr, Zhang W, Anderson CF. Adv Protein Chem. 1998;51:281–353. doi: 10.1016/s0065-3233(08)60655-5. [DOI] [PubMed] [Google Scholar]
- 59.Rouzina I, Bloomfield VA. Biophys J. 1999;77:3242–51. doi: 10.1016/S0006-3495(99)77155-9. [DOI] [PMC free article] [PubMed] [Google Scholar]
- 60.Bleam ML, Anderson CF, Record MT. Proc Natl Acad Sci U S A. 1980;77:3085–9. doi: 10.1073/pnas.77.6.3085. [DOI] [PMC free article] [PubMed] [Google Scholar]
- 61.Collins JM, Rogers KS. Chem Biol Interact. 1977;19:197–203. doi: 10.1016/0009-2797(77)90031-x. [DOI] [PubMed] [Google Scholar]
- 62.Nakano S, Fujimoto M, Hara H, Sugimoto N. Nucleic Acids Res. 1999;27:2957–65. doi: 10.1093/nar/27.14.2957. [DOI] [PMC free article] [PubMed] [Google Scholar]
- 63.Orosz JM, Wetmur JG. Biopolymers. 1977;16:1183–99. doi: 10.1002/bip.1977.360160603. [DOI] [PubMed] [Google Scholar]
- 64.Stellwagen E, Muse JM, Stellwagen NC. Biochemistry. 2011;50:3084–94. doi: 10.1021/bi1015524. [DOI] [PubMed] [Google Scholar]
- 65.Trend BL, Knoll DA, Ueno M, Evans DF, Bloomfield VA. Biophys J. 1990;57:829–34. doi: 10.1016/S0006-3495(90)82602-3. [DOI] [PMC free article] [PubMed] [Google Scholar]
- 66.Vieregg J, Cheng W, Bustamante C, Tinoco I., Jr J Am Chem Soc. 2007;129:14966–73. doi: 10.1021/ja074809o. [DOI] [PMC free article] [PubMed] [Google Scholar]
- 67.Lambert D, Leipply D, Shiman R, Draper DE. J Mol Biol. 2009;390:791–804. doi: 10.1016/j.jmb.2009.04.083. [DOI] [PMC free article] [PubMed] [Google Scholar]
- 68.Smith SB, Cui Y, Bustamante C. Science. 1996;271:795–9. doi: 10.1126/science.271.5250.795. [DOI] [PubMed] [Google Scholar]
- 69.Owczarzy R, Moreira BG, You Y, Behlke MA, Walder JA. Biochemistry. 2008;47:5336–53. doi: 10.1021/bi702363u. [DOI] [PubMed] [Google Scholar]
- 70.Williams AP, Longfellow CE, Freier SM, Kierzek R, Turner DH. Biochemistry. 1989;28:4283–91. doi: 10.1021/bi00436a025. [DOI] [PubMed] [Google Scholar]
- 71.Anderson CF, Record MT., Jr Annu Rev Biophys Biophys Chem. 1990;19:423–65. doi: 10.1146/annurev.bb.19.060190.002231. [DOI] [PubMed] [Google Scholar]
- 72.Granot J, Kearns DR. Biopolymers. 1982;21:219–32. doi: 10.1002/bip.360210117. [DOI] [PubMed] [Google Scholar]
- 73.Grochowski P, Trylska J. Biopolymers. 2008;89:93–113. doi: 10.1002/bip.20877. [DOI] [PubMed] [Google Scholar]
- 74.Grosberg AY, Nguyen TT, Shklovskii BI. Reviews of Modern Physics. 2002;74:329–345. [Google Scholar]
- 75.Ni HH, Anderson CF, Record MT. Journal of Physical Chemistry B. 1999;103:3489–3504. [Google Scholar]
- 76.Pack GR, Wong L, Lamm G. Biopolymers. 1999;49:575–90. doi: 10.1002/(SICI)1097-0282(199906)49:7<575::AID-BIP4>3.0.CO;2-J. [DOI] [PubMed] [Google Scholar]
- 77.Shklovskii BI. Physical Review E. 1999;60:5802–5811. doi: 10.1103/physreve.60.5802. [DOI] [PubMed] [Google Scholar]
- 78.Tan ZJ, Chen SJ. Biophys J. 2008;95:738–52. doi: 10.1529/biophysj.108.131524. [DOI] [PMC free article] [PubMed] [Google Scholar]
- 79.Murphy MC, Rasnik I, Cheng W, Lohman TM, Ha TJ. Biophysical Journal. 2004;86:2530–2537. doi: 10.1016/S0006-3495(04)74308-8. [DOI] [PMC free article] [PubMed] [Google Scholar]
- 80.This calculation assumes WLC parameters of Dp = 0.6 nm/nt and Lp = 1-1.5 nm, and a width of 2.0 nm for the folded hairpin (Woodside et al. PNAS 2006). Any formation of secondary structure within the unfolded hairpin would only serve to lower Δx. Even at very low monovalent ion concentrations (~10 mM), which cause substantial stiffening of ssDNA (Lp ~ 3 nm; Murphy et al. Biophys. J. 2004), an average Δx of only ~13 nm is expected.
- 81.Zuker M. Nucleic Acids Res. 2003;31:3406–15. doi: 10.1093/nar/gkg595. [DOI] [PMC free article] [PubMed] [Google Scholar]
- 82.Wensel TG, Meares CF, Vlachy V, Matthew JB. Proc Natl Acad Sci U S A. 1986;83:3267–71. doi: 10.1073/pnas.83.10.3267. [DOI] [PMC free article] [PubMed] [Google Scholar]
- 83.Grilley D, Soto AM, Draper DE. Proc Natl Acad Sci U S A. 2006;103:14003–8. doi: 10.1073/pnas.0606409103. [DOI] [PMC free article] [PubMed] [Google Scholar]
- 84.Rialdi G, Levy J, Biltonen R. Biochemistry. 1972;11:2472–9. doi: 10.1021/bi00763a014. [DOI] [PubMed] [Google Scholar]
- 85.Record MT. Biopolymers. 1975;14:2137–2158. doi: 10.1002/bip.1975.360140212. [DOI] [PubMed] [Google Scholar]
- 86.Record MT, Lohman TM. Biopolymers. 1978;17:159–166. [Google Scholar]
- 87.Record MT, Jr, Woodbury CP, Lohman TM. Biopolymers. 1976;15:893–915. doi: 10.1002/bip.1976.360150507. [DOI] [PubMed] [Google Scholar]
- 88.Bokinsky G, Rueda D, Misra VK, Rhodes MM, Gordus A, Babcock HP, Walter NG, Zhuang X. Proc Natl Acad Sci U S A. 2003;100:9302–7. doi: 10.1073/pnas.1133280100. [DOI] [PMC free article] [PubMed] [Google Scholar]
- 89.Misra VK, Shiman R, Draper DE. Biopolymers. 2003;69:118–36. doi: 10.1002/bip.10353. [DOI] [PubMed] [Google Scholar]
- 90.Dove WF, Davidson N. Journal of Molecular Biology. 1962;5:467. [Google Scholar]
- 91.Privalov PL, Ptitsyn OB, Birshtei Tm. Biopolymers. 1969;8:559. [Google Scholar]
- 92.Chen AA, Marucho M, Baker NA, Pappu RV. Methods Enzymol. 2009;469:411–32. doi: 10.1016/S0076-6879(09)69020-0. [DOI] [PubMed] [Google Scholar]
Associated Data
This section collects any data citations, data availability statements, or supplementary materials included in this article.