Abstract
Carbonyl compounds are common byproducts of many metabolic processes. These volatile chemical entities are usually derivatized before mass spectrometric analysis to enhance the sensitivity of their detections. The classically used reagent for this purpose is 2,4-dinitrophenylhydrazine (DNPH) that forms the corresponding hydrazones. When DNPH is immobilized on specific cartridges it permits solvent-free collection and simultaneous derivatization of aldehydes and ketones from gaseous samples. The utility of this approach was tested by assembling a simple apparatus for the in vitro generation of trifluoroacetaldehyde (TFAA) and its subsequent capture on the attached DNPH cartridge. TFAA was generated via cytochrome P450-catalyzed dealkylation of flecainide, an antiarrhythmic agent, in pooled human liver microsomes. Stable-isotope dilution mass spectrometry coupled with GC and LC using negative chemical ionization (NCI) and electrospray ionization (ESI) was evaluated for quantitative analyses. To eliminate isotope effects observed with the use of deuterium-labeled DNPH, we selected its 15N4-labeled analog to synthesize the appropriate TFAA adduct, as internal standard. Quantitation by GC–NCI-MS using selected-ion monitoring outperformed LC–ESI-MS methods considering limits of detection and linearity of the assays. The microsomal metabolism of 1.5 μmol of flecainide for 1.5 h resulted in 2.6 ± 0.5 μg TFAA-DNPH, corresponding to 9.3 ± 1.7 nmol TFAA, captured by the cartridge.
Keywords: Volatile carbonyl metabolite; 2,4-Dinitrophenylhydrazine (DNPH) cartridge; 14N-labeled internal standard; GC–MS; LC–MS
1. Introduction
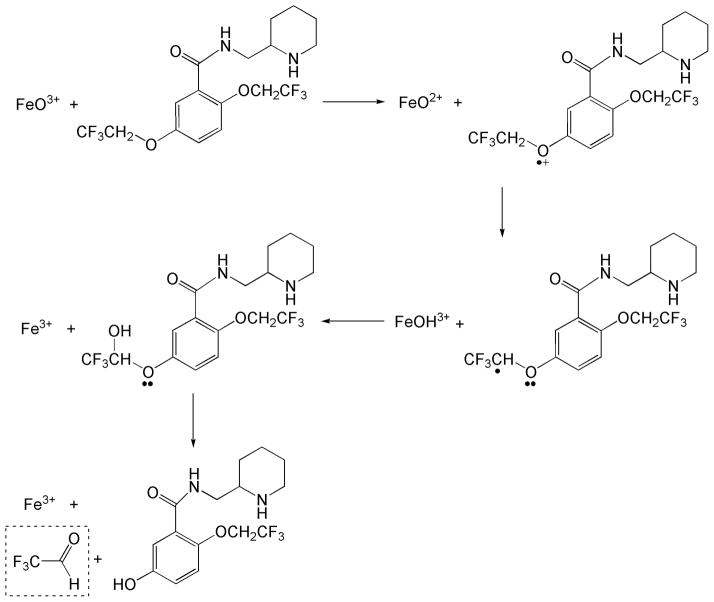
Several biochemical processes are accompanied by the formation of volatile carbonyl products. Identification and quantitation of these compounds from ambient air samples or exhaled breath have often been of interest. For example, measurement of acetaldehyde formed by the enzymatic oxidation of ethanol has been employed for metabolic flux analysis in fermentation experiments [1]. Analysis of the metabolome for volatile carbonyl compounds may also be informative for the physiological state of an individual, as well as for exposure to various drugs and environmental chemicals [2]. Notably, increased breath acetone levels are highly correlated with diabetes and have been successfully used for the non-invasive diagnosis/monitoring of diabetic patients [3]. In general, volatile carbonyls in the exhaled breath representing lipid peroxidation end-products have often been considered as potential biomarkers of oxidative stress and metabolic status [4,5]. Another important process that generates carbonyl compounds is dealkylation (heteroatom release) mediated by cytochrome P450 (CYP) during drug metabolism [6]. CYP enzymes represent the main drug metabolizing system in mammals and they also catalyze the oxidation of various endogenous (e.g., bile acids, steroids, and cholesterol) and exogenous (e.g., drugs, pollutants, and dietary components) chemicals. Since oxidative dealkylation of a drug containing an ether, thioether or alkylamino functional group produces the corresponding aldehyde in addition to the dealkylated drug (Fig. 1), measurement of an exhaled carbonyl compound may allow for non-invasive assessing of in vivo drug metabolism [7,8]. Due to their high volatility and reactive nature, determination of carbonyl metabolites is usually performed after derivatization to fix their concentration at a given time and/or to afford improved detection [9]. The classically used derivatization method to detect carbonyls has been the use of 2,4-dinitrophenylhydrazine (DNPH) to form the corresponding hydrazones.
Fig. 1.
Flecainide dealkylation by cytochrome P450 [6].
Sampling of aldehyde or ketone from vapors requires impingers or bubblers [10], and the usual sample preparation procedure involves extraction with large amount of organic solvent that needs to be removed before analysis [9]. To overcome these limitations, a method to capture volatile carbonyl compounds by DNPH-coated cartridges has been developed that allows solvent-free collections and simultaneous derivatization of the carbonyl compound(s) of interest [11]. Identification of the generated hydrazones is usually done by gas chromatography (GC) using flame ionization [12] or electron capture [13,14] and mass spectrometric (MS) detection [15]. With the latter, negative-ion detection has been found to be the most advantageous [9,16]. In particular, GC–MS with negative-chemical ionization (NCI) has been useful due to its high selectivity and sensitivity [17]. In addition, HPLC alone [18,19] or coupled with MS, or tandem MS (MS/MS) [9,16,20] have been utilized for carbonyl determination. In any case, an internal standard (IS) is required for accurate quantitative analysis of these volatile molecules. Although deuterium labeled hydrazones have been considered as ISs in the DNPH derivatization strategy [9], a typical obstacle is that the labeled analytes are not always available commercially or can be easily obtained by in-house synthesis. To overcome these limitations, deuterium labeled DNPH (d3-DNPH) has been used to synthesize the corresponding d3-labeled IS suitable for quantitation by isotope-dilution mass spectrometry [21]. An isotope effect resulting in shorter retention time for the deuterated hydrazones compared to that of corresponding unlabeled counterparts has, however, been observed upon LC or GC separation [22–24]. It has also been shown that such a deuterium isotope effect may be significant enough to change the analyte to IS peak area ratios and, therefore, to influence the accuracy of quantitations [23,25]. To eliminate possible isotope effects brought about by the use of deuterium labeled ISs, we chose 15N4-labeled DNPH for synthesizing appropriate ISs for quantitative measurements of carbonyl compounds. We have unequivocally by stable-isotope dilution MS coupled with chromatography.
The utility of this approach was tested by assembling a simple apparatus to generate and capture trifluoroacetaldehyde (TFAA) formed in vitro by CYP-catalyzed dealkylation of an antiarrhythmic agent, flecainide (N-(2-piperidylmethyl)-2,5-bis(2,2,2-trifluoroethoxy)benzamide monoacetate), in pooled human liver microsomes.
2. Experimental
2.1. Chemicals
Flecainide acetate was purchased from Tocris (Ellisville, MO). Pooled human liver microsomes and NADPH regenerating system were obtained from Gentest (Woburn, MA) and stored at −80°C. DNPH-coated LpDNPH S10 cartridges were purchased from Supelco (Bellefonte, PA). Microcentrifuge tubes (2 mL) and hypodermic needles (20 G × 1 ½ in.) were supplied by USA Scientific (Ocala, FL) and Air-Tite Products Co., Inc. (Virginia Beach, VA), respectively. Solvents were of analytical grade and obtained from Fisher Scientific (Atlanta, GA). All other chemicals were purchased from Sigma-Aldrich (St. Louis, MO). Preparative thin layer chromatography (TLC) plates (Silica Gel G 20×20 cm scored, UNIPLATE-T Taper Plate) were purchased from Analtech (Newark, DE).
2.2. Apparatus to generate and capture volatile carbonyl metabolites
Fig. 2 shows the volatile carbonyl-trapping apparatus we assembled in house and used in this study. An LpDNPH S10 cartridge (B) was connected to a 2-mL polypropylene microcentrifuge tube (A) by a hypodermic needle punctured through the closed top to collect the aldehyde released into the headspace (This hypodermic needle was carefully positioned, so that no solution from the incubated mixture could enter into the connected cartridge). A vacuum pump (KNF Neuberger Inc., Trenton, NJ) was connected to the open end of the cartridge to provide a continuous gentle suction. Another hypodermic needle (D) punctured through the top to reach the bottom of the closed centrifuge tube was used to aspirate the system, agitate the incubation mixture and purge out the generated volatile aldehyde from the solution phase via continuous bubbling. A two-way valve (C) was used to adjust the vacuum to obtain about 1 bubble per second at the end of the needle (D) submerging into the solution giving thereby an estimated purge flow rate of 0.7–0.8 mL/min.
Fig. 2.
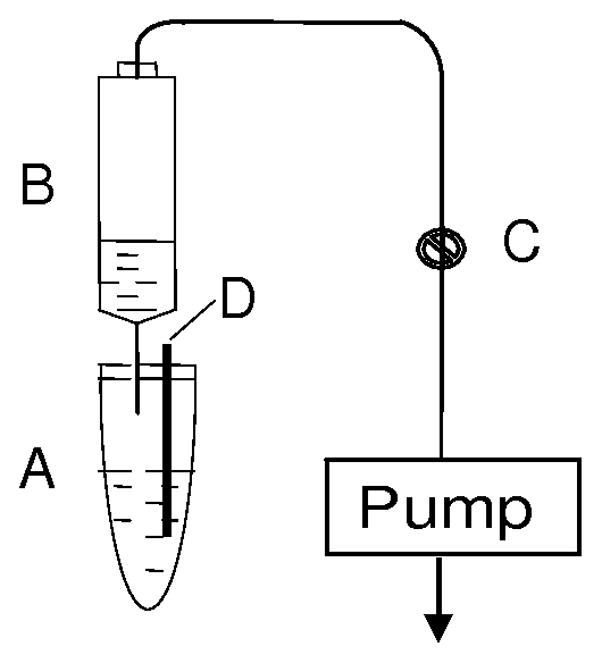
Schematic illustration of the aldehyde-generating and trapping apparatus. A: Microsomal incubation mixture; B: LpDNPH cartridge; C: Two-way valve; D: Hypodermic needle (for aspiration of the system and agitation of the mixture).
2.3. Synthesis of TFAA-DNPH and its labeled analogues as an internal standard for isotope-dilution mass spectrometry
The deuterium labeled DNPH (d3-DNPH) was synthesized as described before [21]. 15N4-DNPH was prepared from dinitro[15N2]-chlorobenzene and 15N2-hydrazine sulfate in a similar manner [26]. To obtain an authentic TFAA-DNPH synthetic standard, trifluoroacetaldehyde ethyl hemiacetal (310 μL) was dissolved in 15 mL toluene followed by addition of 480 mg DNPH and 15 mg p-toluenesulfonic acid. Molecular sieve 4A (1 g) was then added, and the mixture was stirred for 4 hours at 100 °C. After addition of 10 mL diethyl ether, the solution was extracted with 1% (w/v) sodium bicarbonate. The organic layer was then separated, washed with brine and dried over sodium sulfate. The solvent was evaporated under reduced pressure resulting in a yellow solid. The product was purified on preparative TLC using hexane:ethyl acetate = 6:1 (v/v), Rf = 0.63. Trifluoroacetaldehyde [15N4]-2,4-dinitrophenylhydrazone (TFAA-15N4-DNPH) as well as trifluoroacetaldehyde 2,4-dinitro-3,5,6-trideuterophenylhydrazone (TFAA-d3-DNPH) were obtained analogously using the corresponding labeled DNPHs.
2.4. In vitro generation of TFAA via microsomal incubation
A microsomal incubation was performed at 37 °C in a suspension containing 2 mg/mL human liver microsomes, an NADPH-generating system consisting of 5.2 mM NADP+, 13.2 mM glucose-6-phosphate, 1.6 U/mL glucose-6-phosphate dehydrogenase, 13.2 mM MgCl2 and 1 μmol/mL flecainide in 100 mM potassium phosphate buffer (pH 7.5). The total volume of the incubation mixture was 1.5 mL. The metabolically formed TFAA was collected for 1.5 h by the apparatus. After sample collection, 0.8 μg of TFAA-15N4-DNPH IS (40 μg/mL in acetonitrile) was added to the cartridge that was subsequently washed with 3 × 1 mL acetonitrile. The solvent was then removed from the collected solution at room temperature under a nitrogen stream, and the residue was dissolved in the appropriate solvent (100 μL) for analyses.
2.5. GC-NCI-MS analysis
A PolarisQ mass spectrometer system interfaced to a TRACE GC and controlled by Xcalibur 1.4 data system (all from Thermo Electron Corporation, Trace Chemical Analysis, Austin, TX) was used in the study. Separations were done on a 30 m × 0.25 mm i.d. Rtx-5MS (df =0.25 μm) fused silica column (Restec, Bellefonte, PA). The injector temperature was 220 °C. The carrier gas was helium at a flow rate of 1.0 mL/min. Column head pressure was 7.8 psi. All injections (1 μL volume) were carried out using splitless mode. The oven temperature was kept at 40 °C for 1 min, then increased to 300 °C at 25 °C/min and maintained at 300 °C for 3 min. Conditions for mass spectrometry were as follows: ion source temperature, 200 °C; interface temperature, 300°C; ionizing voltage, 70eV; NCI mode with methane as a reagent gas. TFAA-DNPH, TFAA-d3-DNPH, and TFAA-15N4-DNPH were detected at 182, 185, and 185 m/z, respectively.
2.6. LC-ESI-MS analysis
Online LC-MS analysis was performed using a LCQ 3D ion-trap instrument equipped with electrospray ionization (ESI) source operated in negative mode and coupled with a P-1000 HPLC pump controlled by Xcalibur 1.3 data system (Thermo Electron Corporation, Trace Chemical Analysis, Austin, TX). Separations were done on an Ascentis Express fused-core C18 column (5 cm × 2.1 mm i.d., 2.7 μm; Supelco, Bellefonte, PA). Isocratic elution was performed with 52% acetonitrile at a flow rate of 0.2 mL/min. Samples were dissolved in the mobile phase and the injection volume was 5 μL. The study was carried out at room temperature. ESI spray voltage and capillary temperature were maintained at 4.5 kV and 200 °C, respectively. Scans were performed in the range of m/z 275–283, the extracted ions of m/z 277, 280, and 281 were used for the quantitation of TFAA-DNPH, TFAA-d3-DNPH, and TFAA-15N4-DNPH, respectively. The same ions were monitored during selected ion monitoring (SIM) analysis. For MS/MS experiments collision-induced dissociation (CID) was performed using 1.0-u isolation width and 30% normalized collision energy with helium as the collision gas. The selected reaction monitoring (SRM) transition was 277 → 179 m/z for TFAA-DNPH.
2.7. Isotope effects using stable isotope labeled TFAA-DNPH adducts
The percentile single isotope effects (%IEs) of TFAA-d3-DNPH and TFAA-15N4-DNPH were calculated according to the equation given by Turowski et al. [27]. The samples containing both the IS and the analyte were dissolved in acetonitrile for GC-MS and in the mobile phase for LC-MS analysis, respectively. The GC and LC chromatographic parameters (oven temperature and mobile phase composition, respectively) were set to achieve similar k′ (retention factor) values for both chromatographic techniques. Accordingly, isothermal GC analyses (with 1:50 split injection) were performed at 158 °C, 173 °C, 190 °C, and 203 °C oven temperature, and LC elutions were done with 40%, 45%, 50%, and 55% acetonitrile, respectively. The injected quantity of analyte and IS were sufficiently small (1.0 ng and 5.0 ng) to approach infinite-dilution in the mobile phase. Other experimental parameters were identical to those described in sections 2.5 and 2.6 for GC- and LC-MS, respectively.
2.8. Assay validations
GC-MS and LC-MS methods were validated in accordance with the US Food and Drug Administration (FDA) Guidance [28]. Limit of detections (LODs) were calculated according to the International Conference on Harmonisation (ICH) guidelines [29], based on the standard deviation of the y-intercepts and the slope of regression lines. LOD confidence intervals were determined by the method of Beránek et al. [30]. Assay calibration was done by isotope dilution using six different analyte/IS molar ratios [31]. The quantity of IS was kept constant at 50 ng injected on column for both chromatographic methods. Calibration curves were obtained using linear regression with or without weighting resulting in coefficient of determination (R2) of higher than 0.99. The appropriate weighting scheme was selected according to the recommendations of Almeida et al. [32]. Accuracy, indicating the extent of agreement between measured (CM) and nominal concentrations (CQ) of the analyte (TFAA-DNPH) in the quality control (QC) samples was estimated at various analyte concentrations with 50 ng IS and using n=5 replicates. Percentage accuracy was calculated as [(CM−CQ)/CQ]·100 [31–34,34].
TFAA generated in vitro by CYP-mediated microsomal metabolism (Fig. 1) and captured by the apparatus shown in Fig. 2 was identified upon DNPH derivatization by comparing the corresponding retention time and NCI mass spectrum with those of the authentic synthetic reference compound. For quantitation, SIM using the most intense fragment ion of the analyte and 15N4-DNPH-derived IS (182 and 185 m/z, respectively) was employed. The amount of TFAA-DNPH captured by the cartridge was calculated using triplicate experiments by multiplying the ratio of the analyte to IS peak areas of the SIM chromatograms with the known quantity (0.8 μg) of the IS added onto the LpDNPH S10 cartridge [31,33,34]; data are given as mean ± SD.
3. Results and Discussion
3.1. A simple apparatus coupled with a DNPH-coated cartridge to capture in vitro formed TFAA
Volatile aldehydes and ketones are common end- and/or site-products of many biochemical processes and drug metabolisms. DNPH derivatization is perhaps the most generally utilized sample preparation method for their analyses [9]. A simplified measurement of these compounds can take advantage of the commercially available DNPH-coated cartridges to avoid cumbersome sample preparation before GC-MS or LC-MS analyses [11]. With these cartridges, volatile carbonyls are captured through their in situ conversion to the corresponding hydrazones that are subsequently eluted for analysis with small amount of an organic solvent, such as acetonitrile.
In the present study, the aldehyde (TFAA), formed metabolically upon microsomal incubation of flecainide (Fig. 1) was trapped by a DNPH cartridge from the headspace of a simple experimental apparatus assembled in-house (Fig. 2) for quantitative analysis. We believe that a similar device may also be considered to replace the separate vial containing DNPH solution introduced to capture acetaldehyde after diffusion through the gas headspace in metabolic flux analysis of fermentation experiments [1], or to perform metabolomic studies focusing on volatile carbonyl compounds [2]. No authentic standard gas sample is available or can be prepared to test the commercially available DNPH-coated LpDNPH S10 cartridges (Supelco) for TFAA. However, according to the manufacturer’s specification, the recoveries of formaldehyde and acetaldehyde are 103–106 and 120–135%, respectively. These values indicate that the overall efficiency of collection, derivatization and elution processes are essentially quantitative for volatile aldehydes and ketones using these cartridges.
3.2. Selection of isotope-labeled internal standard for quantitative determination of TFAA
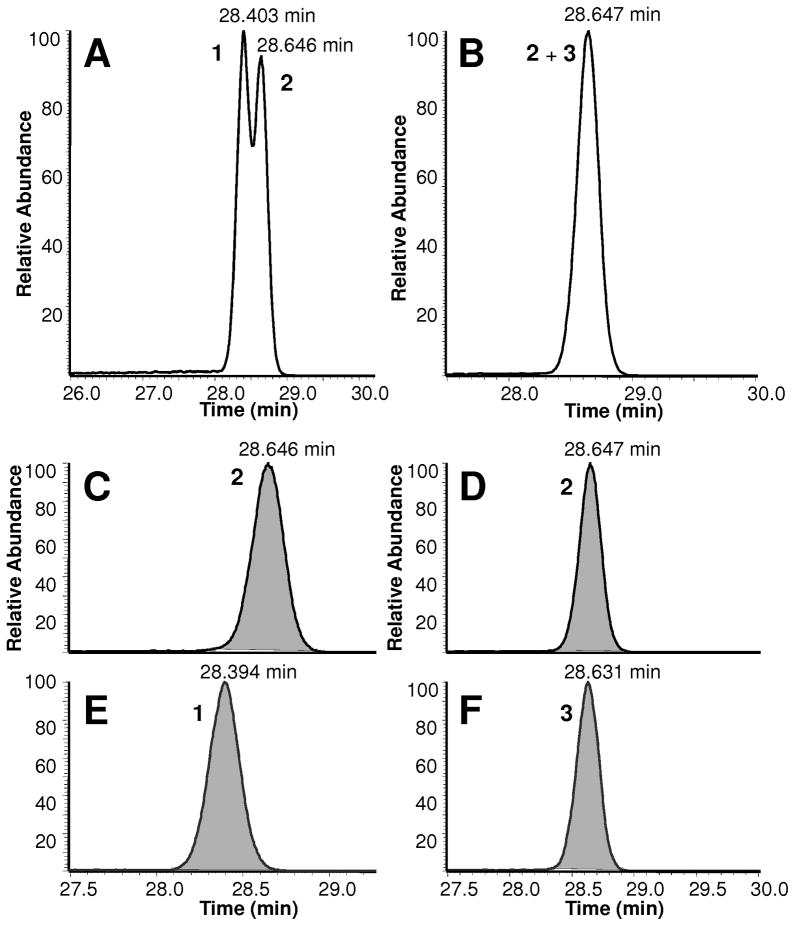
Due to the isotope effect brought about by the commonly used deuterated agents [25], in the present study the utility of nitrogen–labeled IS was investigated for the in vitro formation of TFAA. The %IEs of the labeled hydrazones plotted against log k′ are shown in Fig. 3 for LC and GC analyses. Regardless of the analyte’s concentration and the chromatographic technique applied, the %IEs of deuterium and heavy-nitrogen labeled isotopes were clearly different. Notably, %IE for the TFAA-15N4-DNPH was practically zero under all experimental conditions. On the other hand, and in agreement with a previous report on structurally related compounds [27], the deuterated counterpart showed significant isotope effect. While an increase in %IE with decreasing organic content of the mobile phase (methanol) has been reported [27], in the present study we could not observe statistically significant change in %IE (0.36±0.06), when the concentration of the acetonitrile was changed (from 40 to 55% changing k′ from 3.4 to 25) upon LC separation. On the other hand, we have obtained very tight GC data, which was apparently because of more reproducible control of the parameters affecting separation in GC (pressure, flow rate, temperature, etc.) than in the routine LC we employed, ranging from 0.26 to 0.32 in %IE, when the effect of increasing k′ was investigated by isothermal GC. Moreover, the fitted trend line indicated a slight but statistically significant effect of k′ on %IE (a positive slope of 0.075 ± 0.004 of the %IE versus log k′ plot) using GC. Due to the isotope effect combined with the high chromatographic resolution of the technique, GC peaks of deuterium labeled and non-labeled TFAA-DNPH were even partially resolved at 158 °C oven temperature (Fig. 4A, C, and E), while no separation was observed with the 15N–labeled compound implicating the advantage of heavy-nitrogen over deuterium labeling of the IS in quantitative analyses. For simple sample matrices, the impact of isotope effects associated with deuterium labeling may be minimized at the expense of chromatographic separation by rapid temperature program in GC, or by steep mobile phase gradient when LC is used. However, these measures could have detrimental consequences on quantitation from complex sample matrices [23,25].
Fig. 3.
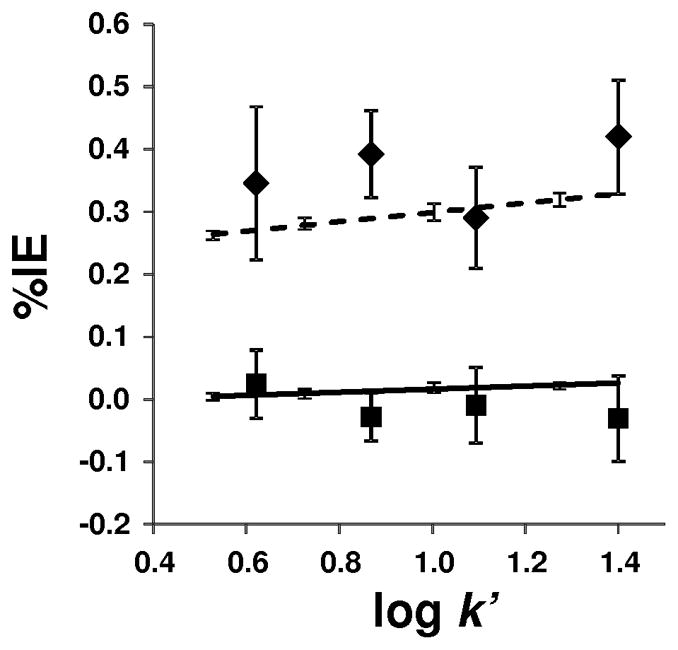
Percentile single isotope effects (%IEs) of deuterium- and 15N-labeled TFAA-DNPHs plotted against log k′. HPLC (◆) and GC (no symbol) data of TFAA-d3-DNPH; HPLC (■) and GC (no symbol) data of TFAA-15N4-DNPH. Solid line represents the linear regression fit of TFAA-15N4-DNPH GC data (R2 = 0.9641), dashed line shows the linear regression fit of TFAA-d3-DNPH GC data (R2 = 0.9946).
Fig. 4.
Total ion chromatograms of the partially resolved peaks of d3- and non-labeled TFAA-DNPH (A); and practical co-elution of 15N4- and non-labeled TFAA-DNPH (B), extracted ion chromatograms of the non-labeled TFAA-DNPH (C, D; m/z 182), the d3-labeled (E; m/z 185) and the 15N4-labeled TFAA-DNPH (F; m/z 185); 1 = TFAA-d3-DNPH, 2 = TFAA-DNPH, 3 = TFAA-15N4-DNPH; 50 ng/μL injection, split ratio 1:50, flow rate 1 mL/min, oven temperature 158 °C.
3.3. Performance parameters of TFAA-DNPH quantitation by GC–MS and LC–MS
As shown in Fig. 5, NCI-MS fragmentation between the two N atoms of the hydrazone moiety yielded the base peaks of the mass spectra of the analyte (m/z 182) and IS (m/z 185) and, therefore, their m/z values differed by 3 u. SIM-based quantitation was performed by using these two ions [17]. Fig. 6A shows the negative-ion ESI mass spectrum of TFAA-DNPH, and Fig. 6B depicts its CID-MS/MS with the origin of characteristic fragments indicated on the structure (The corresponding mass spectra of the isotope labeled compounds, TFAA-d3-DNPH and TFAA-15N4-DNPH, are presented in Supplemental Fig. S7 and Fig. S8 in the Supplementary Information online). An advantage of LC–MS would be the reliance on molecular ions ([M–H]−, Fig. 6A) instead of fragment ions (Fig. 5) for quantitative analyses.
Fig. 5.
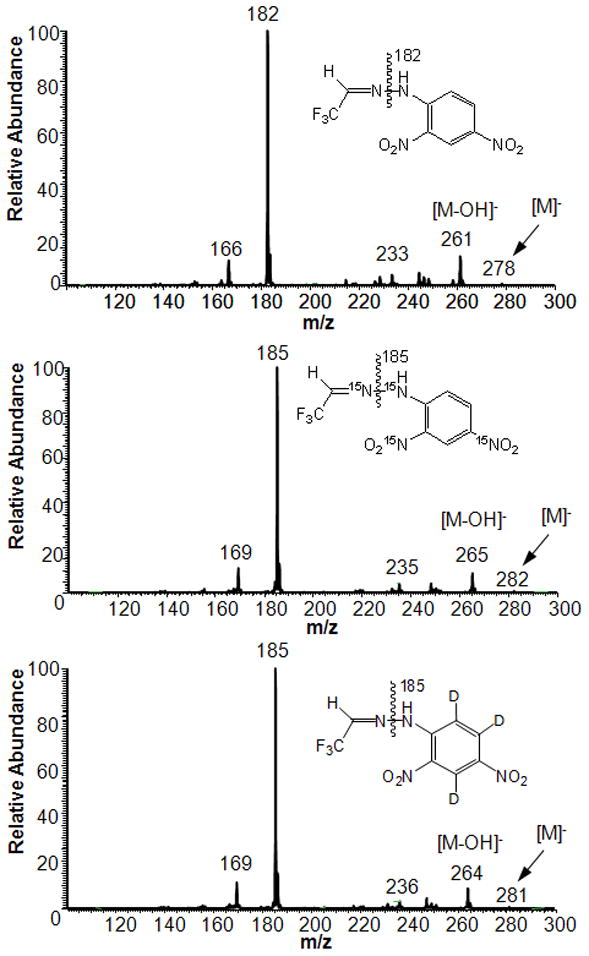
Full-scan GC-NCI-MS of TFAA-DNPH and its 15N4- and d3-labeled analogues.
Fig. 6.
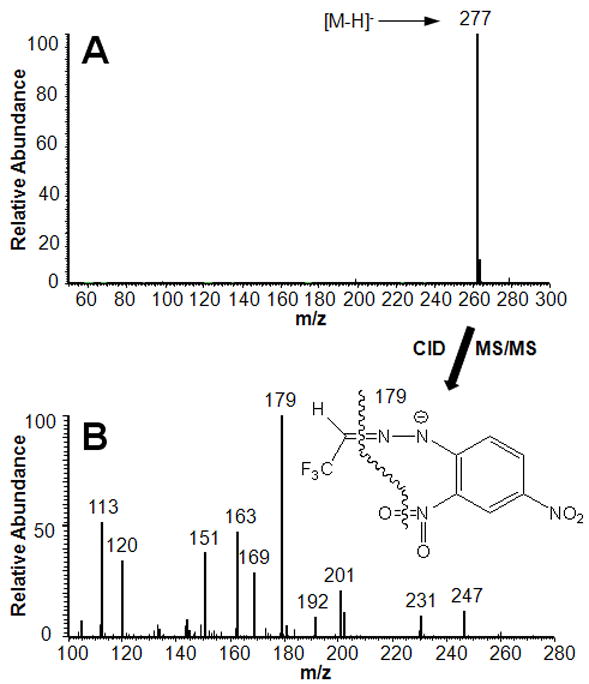
Full-scan LC-ESI-MS of TFAA-DNPH (A) and CID-MS/MS spectrum of the [M–H]− ion, m/z 277 (B).
For quantitation, GC–NCI-MS with SIM proved to be, however, more sensitive based on LODs than LC-ESI in any modes (SIM, narrow-range scans and SRM) of data acquisition using the default parameters for the quadrupole ion trap (LCQ) and software (XCalibur 1.3) specified in section 2.6. Specifically, we estimated 1.7± 0.6 ng/mL (as low as 0.6 ± 0.2 pg/injection) of LOD for GC–MS, while LODs using LC–MS were 16±4, 23±6 and 59±32 ng/mL for SIM, narrow-range scans and SRM, respectively. GC–MS also outperformed LC–MS regarding assay linearity. Therefore, we chose to focus on validating GC–NCI-SIM for quantitative analysis of TFAA (Table 1) generated from flecainide according to the experiment described in section 2.4. Nevertheless, LC–MS assays have also passed validation criteria (Supplementary Table 1).
Table 1.
Summary of the GC-NCI-MS method validation
| TFAA-DNPH (ng injected) | Repeatability
|
|||
|---|---|---|---|---|
| Area Ratio (RSD %)a |
Retention Time (RSD %)b |
|||
| Intra-dayc | Inter-dayd | Intra-dayc | Inter-dayd | |
| 5 | 1.1 | 5.5 | 0.02 | 0.02 |
| 10 | 6.5 | 7.1 | 0.01 | 0.01 |
| 100 | 2.1 | 3.2 | 0.02 | 0.80 |
| CQe (ng/μL) | Accuracy
|
||
|---|---|---|---|
| CMf ± SD (ng/μL) | Precision (RSD %) | Accuracy (%) | |
| 5 | 5.58 ± 0.03 | 0.5 | 11.6 |
| 50 | 50.6 ± 1.6 | 3.2 | 1.2 |
| 150 | 147 ± 3 | 2.1 | −2.1 |
Area Ratio (RSD %) denotes precision expressed in RSD % of analyte/IS area ratios.
Retention Time (RSD %) denotes precision expressed in RSD % of retention times.
n = 5.
n = 15.
CQ denotes the nominal concentration of TFAA-DNPH in QC samples.
CM denotes the measured concentration of TFAA-DNPH in QC samples.
Table 1 summarizes the method validation results of the GC-NCI-SIM technique. To examine intra-day and inter-day precision, QC samples were analyzed on three consecutive days at three concentration levels. The repeatability (expressed as percentage of the relative standard deviation, % RDS) of either the analyte-to-IS area ratios and retention times were within the acceptable range [28] at any of the selected TFAA-DNPH quantities injected on the GC- and LC-column, respectively. Accuracy, indicating the extent of agreement between the measured (CM) and nominal concentration (CQ) of the analyte, was also acceptable [28] in the concentration range estimated to match the quantity of TFAA formed metabolically in the test experiment (section 2.4). To demonstrate the stability of standard solutions, QC samples at two concentration levels (5 and 50 ng/μL) were stored at room temperature and reanalyzed after 48 h. The results confirmed that peak area ratios and retention times did not change significantly.
3.4. Quantitative determination of TFAA produced by microsomal metabolism of flecainide
While efficient carbonyl collection from gas samples can be achieved by employing DNPH cartridges [35], in the present study we also wished to investigate the role of 15N-labeled IS for allowing accurate quantitative analyses of the captured carbonyl derivatives by isotope-dilution mass spectrometry. We selected the in vitro formation of TFAA from the antiarrhythmic agent flecainide in human liver microsome as a model system for this endeavor (Fig. 1). First, for the unambiguous identification of TFAA-DNPH removed from the cartridge, an authentic synthetic sample was prepared.
Using the retention time and GC-NCI-MS spectrum of the synthetic standard, we have unequivocally 23identified the compound collected from the in vitro experiment as TFAA-DNPH (data not shown).
In order to accurately measures carbonyls after DNPH cartridges, it is important to probe the collection efficiency of the cartridge for the particular analyte. Although previous studies have shown that the cartridge’s performance in humid air affords essentially quantitative capture of volatile aldehydes and ketones [35], we have tested for a potential loss of the labeled hydrazone during sample elution through exchange with the unlabeled DNPH coated on the adsorbent of the cartridge. We concluded that such exchange was not detectable. Similar observation with d3-hydrazones has also been reported earlier [21].
Based on results described in sections 3.2 and 3.3, GC-NCI-MS analysis of our target compound with 15N-stable-isotope labeled IS was chosen to determine TFAA produced during in vitro microsomal metabolism of flecainide (Fig. 1). When 1.5 μmol of flecainide was incubated with liver microsomes under the experimental conditions specified in the present study (Fig. 2 and section 2.4), 2.57 ± 0.48 μg of TFAA-DNPH, corresponding to 9.3 ± 1.7 nmol of TFAA was captured from the headspace of the vial based on three independent experiments.
4. Conclusions
We have proposed a convenient method for the quantitative analysis of a volatile carbonyl metabolite trapped on commercially available DNPH cartridges. The application of 15N- labeled IS is more advantageous over deuterium labeling, because 15N-labeling did not induce chromatographic isotope effects, hence, it would not influence the accuracy of the quantitation in LC or GC analyses. The use of 15N4-DNPH to prepare the corresponding hydrazones, as ISs, permits quantitation of captured aldehydes and ketones of metabolic origin by stable-isotope dilution. Because the breath test is becoming one of the most desirable noninvasive procedures for clinical diagnostics [36], the analytical methods presented here may also be adopted for clinical diagnosis, disease state assessment, drug monitoring and evaluation of environmental exposure, when the underlying processes are manifested by the appearance or changes in the concentration of volatile carbonyl compounds in the expired air.
Supplementary Material
Highlights.
Trifluoroacetaldehyde was obtained via metabolism of flecainide in vitro
Capture and derivatization were done by 2,4-dinitrophenylhydrazine cartridges
GC-MS and LC-MS were evaluated for the assay of hydrazones
No chromatographic isotope effects for 15N-labeled dinitrophenylhydrazones
Acknowledgments
Contract/grant sponsor: National Institutes of Health, Robert A. Welch Foundation
Contract/grant number: AG025384, BK-0031
We thank Ms. Shastazia White for her excellent technical assistance with the synthesis and purification of internal standards. This work was supported in part by the National Institutes of Health (grant number AG025384) and the Robert A. Welch Foundation (endowment BK-0031).
APPENDIX A. SUPPLEMENTARY INFORMATION
Supplementary data associated with this article can be found in the online version available at doi: …
Footnotes
Publisher's Disclaimer: This is a PDF file of an unedited manuscript that has been accepted for publication. As a service to our customers we are providing this early version of the manuscript. The manuscript will undergo copyediting, typesetting, and review of the resulting proof before it is published in its final citable form. Please note that during the production process errors may be discovered which could affect the content, and all legal disclaimers that apply to the journal pertain.
References
- 1.Hollemeyer K, Velagapudiy VR, Wittmann C, Heinzle E. Rapid Commun Mass Spectrom. 2007;11:336. doi: 10.1002/rcm.2840. [DOI] [PubMed] [Google Scholar]
- 2.Zimmermann D, Hartmann M, Moyer MP, Nolte J, Baumbach JI. Metabolomics. 2007;3:13. [Google Scholar]
- 3.Deng C, Zhang J, Yu X, Zhang W, Zhang X. J Chromatogr B. 2004;810:269. doi: 10.1016/j.jchromb.2004.08.013. [DOI] [PubMed] [Google Scholar]
- 4.Pryor WA, Godber SS. Free Radic Biol Med. 1991;10:177. doi: 10.1016/0891-5849(91)90073-c. [DOI] [PubMed] [Google Scholar]
- 5.Lin Y, Ducker SR, Jones AD, Ebeler SE, Clifford AJ. Clin Chem. 1995;41:1028. [PubMed] [Google Scholar]
- 6.Guengerich FP. Chem Res Toxicol. 2001;14:611. doi: 10.1021/tx0002583. [DOI] [PubMed] [Google Scholar]
- 7.Manolis A. Clin Chem. 1983;29:5. [PubMed] [Google Scholar]; Zhang XJ, Thomas PE. Drug Metab Dispos. 1996;24:23. [PubMed] [Google Scholar]
- 8.Zhang XJ, Thomas PE. Drug Metab Dispos. 1996;24:23. [PubMed] [Google Scholar]
- 9.Nagy K, Pollreisz F, Takats Z, Vekey K. Rapid Commun Mass Spectrom. 2004;18:2473. doi: 10.1002/rcm.1648. [DOI] [PubMed] [Google Scholar]
- 10.Kuwata K, Uebori M, Yamazaki Y. J Chromatogr Sci. 1979;17:264. doi: 10.1093/chromsci/17.5.264. [DOI] [PubMed] [Google Scholar]
- 11.Kuwata K, Uebori M, Yamasaki H, Kuge Y. Anal Chem. 1983;55:2013. [Google Scholar]
- 12.Priego-Lopez E, Luque de Casto MD. J Chromatogr A. 2002;976:399. doi: 10.1016/s0021-9673(02)01146-9. [DOI] [PubMed] [Google Scholar]
- 13.Ohata H, Otsuka M, Ohmori S. J Chromatogr B. 1997;693:297. doi: 10.1016/s0378-4347(97)00065-0. [DOI] [PubMed] [Google Scholar]
- 14.Marsella AM, Purdham JT, Mabury SA. Int J Environ Anal Chem. 2000;76:241. [Google Scholar]
- 15.Osório VM, de Lourdes Cardeal Z. J Chromatogr A. 2011;1218:3332. doi: 10.1016/j.chroma.2010.11.068. [DOI] [PubMed] [Google Scholar]
- 16.Baños CE, Silva M. J Chromatogr A. 2009;1216:6554. doi: 10.1016/j.chroma.2009.08.004. [DOI] [PubMed] [Google Scholar]
- 17.Thomas MJ, Robinson TW, Samuel M, Forman HJ. Free Radic Biol Med. 1995;3:553. doi: 10.1016/0891-5849(94)e0121-x. [DOI] [PubMed] [Google Scholar]
- 18.Gonçalves LM, Magalhães PJ, Valente IM, Pacheco JG, Dostálek P, Sýkora D, Rodrigues JA, Barros AA. J Chromatogr A. 2011;1217:3717. doi: 10.1016/j.chroma.2010.04.002. [DOI] [PubMed] [Google Scholar]
- 19.Lin YL, Wang PY, Hsieh LL, Ku KH, Yeh YT, Wu CH. J Chromatogr A. 2009;1216:6377. doi: 10.1016/j.chroma.2009.07.018. [DOI] [PubMed] [Google Scholar]
- 20.Iwasaki Y, Nakano Y, Mochizuki K, Nomoto M, Takahashi Y, Ito R, Saito K, Nakazawa H. J Chromatogr B. 2011;879:1159. doi: 10.1016/j.jchromb.2011.02.008. [DOI] [PubMed] [Google Scholar]
- 21.Zurek G, Karst U. J Chromatogr A. 2000;869:251. doi: 10.1016/s0021-9673(99)01240-6. [DOI] [PubMed] [Google Scholar]
- 22.Trufelli H, Palma P, Famiglini G, Cappiello A. Mass Spectrom Rev. 2011;30:491. doi: 10.1002/mas.20298. [DOI] [PubMed] [Google Scholar]
- 23.Wang S, Cyronak M, Yang E. J Pharm Biomed Anal. 2007;43:701. doi: 10.1016/j.jpba.2006.08.010. [DOI] [PubMed] [Google Scholar]
- 24.Wade D. Chem Biol Interact. 1999;117:191. doi: 10.1016/s0009-2797(98)00097-0. [DOI] [PubMed] [Google Scholar]
- 25.Berg T, Strand DH. J Chromatogr A. 2011;1218:9366. doi: 10.1016/j.chroma.2011.10.081. [DOI] [PubMed] [Google Scholar]
- 26.Prokai L, Forster MJ. 60/614,951. US Patent Application. 2005
- 27.Turowski M, Yamakawa N, Meller J, Kimata K, Ikegami T, Hosoya K, Tanaka N, Thornton ER. J Am Chem Soc. 2003;125:13836. doi: 10.1021/ja036006g. [DOI] [PubMed] [Google Scholar]
- 28.US Department of Health and Human Services. FDA, CDER, CVM, Guidance for Industry: Bioanalytical Method Validation. 2001. [Google Scholar]
- 29.International Conference on Harmonisation of Technical Requirements for Registration of Pharmaceuticals for Human Use, ICH Harmonised Tripartite Guideline, Validation of Analytical Procedures: Text and Methodology Q2(R1), 2005.
- 30.Beránek J, Muggli DA, Kubátová A. J Am Soc Mass Spectrom. 2010;21:592. doi: 10.1016/j.jasms.2009.12.009. [DOI] [PubMed] [Google Scholar]
- 31.MacCoss MJ, Matthews DE. Anal Chem. 2005;77:295A. doi: 10.1021/ac053431e. [DOI] [PubMed] [Google Scholar]
- 32.Almeida AM, Castel-Branco MM, Falcão AC. J Chromatogr B. 2002;774:215. doi: 10.1016/s1570-0232(02)00244-1. [DOI] [PubMed] [Google Scholar]
- 33.Prokai-Tatrai K, Bonds D, Prokai L. Chromatographia. 2010;71:311. doi: 10.1365/s10337-009-1441-0. [DOI] [PMC free article] [PubMed] [Google Scholar]
- 34.Prokai L, Fryčák P, Stevens SM, Jr, Nguyen V. Chromatographia. 2008;68:S101. doi: 10.1365/s10337-008-0697-0. [DOI] [PMC free article] [PubMed] [Google Scholar]
- 35.Grosjean E, Grosjean D. Environ Sci Technol. 1996;30:859. [Google Scholar]
- 36.Cao WQ, Duan YX. Crit Rev Anal Chem. 2007;37:3. [Google Scholar]
Associated Data
This section collects any data citations, data availability statements, or supplementary materials included in this article.


