
Figure 2. Neuronal processes in the human and pig visualized using magnetic resonance microscopy.
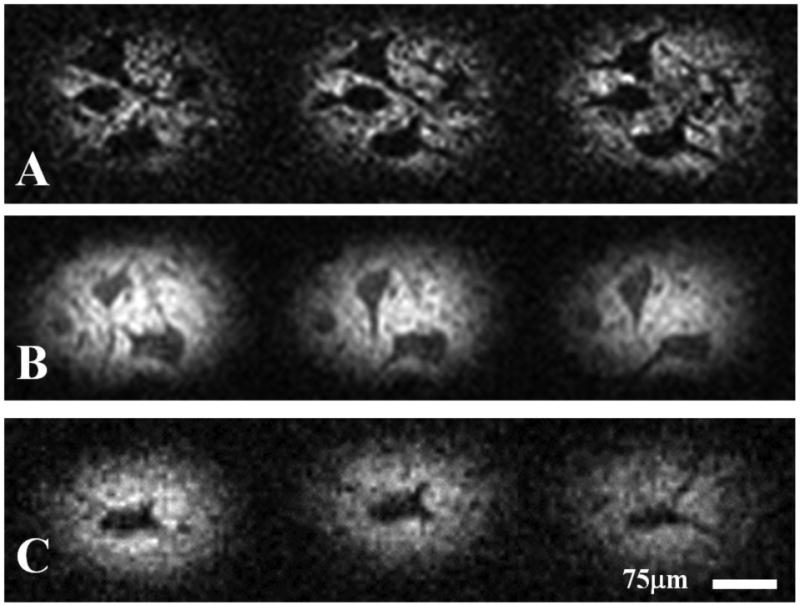
Representative MRM images (6.25μm isotropic resolution) taken from three-dimensional T2-weighted datasets (A & B: porcine; C: human) illustrating the hypointense projections emanating from cell bodies of α-motor neurons. These projections are continuous with the cells' perikarya and extend through multiple frames of the 3D datasets. Adjacent frames located in rows of the figure represent consecutive, voxel-thick sections of the tissue slice. SNR in tissue surrounding the α-motor neurons from top to bottom row: 7.85, 21.1 and 7.77. CNR (between α-motor neuron and surrounding tissues) from top to bottom row: 6.13, 11.0 and 5.01.