

Abstract
Objective
To examine dose–response associations between depressive symptoms and suicide and modification effects of sex, age and health status in older Chinese.
Methods
We used the Chinese version of the 15-item Geriatric Depression Scale (GDS) to measure depressive symptoms (GDS score ≥ 8) and Cox regression to examine association with suicide mortality in a population-based cohort of 55,946 individuals, aged 65 years or above, enrolled from July 1998 to December 2000 at one of 18 Elderly Health Centres of Hong Kong Department of Health. The cohort was followed up for suicide mortality till 31 March 2009 (mean follow-up 8.7 years).
Results
Depressive symptoms were associated with suicide in men [hazard ratio (HR) 2.03, 95% confidence interval (CI) 0.96–4.29] and women (HR = 2.36, 95% CI 1.31–4.24) after adjusting for age, education, monthly expenditure, smoking, alcohol drinking, physical activity, body mass index, health status, and self-rated health. There was no threshold for GDS score and suicide in either sex. Age, sex and health status did not modify the association.
Conclusions
Depressive symptoms predict higher suicide risk in older Chinese in a dose–response pattern. These associations were not attenuated by adjustment for health status, suggesting that depressive symptoms in older people are likely to be an independent causal factor for suicide. The GDS score showed no threshold in predicting suicide risk, suggesting that older people with low GDS scores deserve further attention and those with very high scores need urgent intervention.
Keywords: Depressive symptoms, Geriatric Depression Scale, Suicide
Introduction
Suicide is associated with many illnesses, especially with depression [1, 2]. A Hong Kong Chinese case–control study found that current major depressive disorders accounted for 27% of the population-attributable risk of completed suicide [3]. But the prevalence of depression in suicide cases may be under-estimated in older people because of stigma [4]. Yang et al. [5] suggested that prevention of suicide must focus on improving awareness of psychological problems. Early detection of depression and suicidal ideation is essential for the prevention of suicide in the community [6, 7]. However, many depressed people are not recognized or treated effectively [2].
Although several cross-sectional studies have examined the association between depression and suicide attempt/ideation [8–10], no prospective study on the association between depressive symptoms as assessed by the Geriatric Depression Scale (GDS), a scale specifically designed for older people [8], and suicide mortality was found to date. Moreover, most studies categorized depression as major, minor or none and no study has examined the dose–response association between suicide and severity of depressive symptoms as indicated by GDS score in older people.
Furthermore, most of the earlier studies did not examine the modification effect from other risk factors, such as sex, age and health status. Health status could be significantly different between suicide attempters and others [11]. Poor health status increases risk for suicide in older people [12] and could also cause depression. The role of health status in the relationship between depression and suicide in older people is unclear. To clarify the association of depression with suicide in older Chinese people, we examined the association between depressive symptoms, as assessed by GDS, and suicide in a large, community-based prospective cohort, taking into account the modification effect of sex, age and health status as well as multiple potential confounding factors and different duration of follow up. We hypothesized that (a) depressive symptoms are associated with suicide; (b) there is a dose–response relationship between GDS score and suicide with no threshold; and (c) these associations would be similar by sex, age and health status.
Methods
Details of the methods have been reported elsewhere [13, 14]. Briefly, starting in July 1998, 18 Elderly Health Centers (EHCs) were established by the Hong Kong Department of Health to deliver primary care for the elderly, including health assessment, counseling, curative services and health education. The Elderly Health Service aims to enhance primary health care for the elderly, improve their self-care ability, encourage healthy living and strengthen family and caretakers’ support so as to minimize illness and disability. All people aged 65 years or older are eligible to enroll as members of the EHCs, and all first enrolled from July 1998 to December 2000 were included in the present study, which constituted 8.9% of the older population in the territory. More women enrolled than men; otherwise the participants were similar to the general older population in age, socio-economic status, current smoking and hospital use [14].
Trained nurses and doctors provided health assessments using standardized structured interviews and comprehensive clinical examinations. A never smoker was defined as one who had never smoked as many as one cigarette a day or equivalent for the duration of 1 year. An ever-smoker was defined as one who had smoked at least one cigarette a day for at least 1 year. Passive smoking was defined as passive exposure to tobacco smoke within the same household. A regular drinker and a social drinker were defined as one who drank on 4 or more days per week and on 3 or less days per week, respectively. An ex-drinker referred to a regular or social drinker who had stopped drinking. A never drinker was defined as one who had never been a regular or social drinker. Self-rated health was assessed according to the following two questions: (1) compared with those of similar age, your health is “better”, “normal” or “worse”. (2) Compared to last year, your health this year is “better”, “normal” or “worse”. The health assessment covered functional status, falls, weight loss, use of medication, reported chronic illness (hypertension, diabetes, chronic obstructive pulmonary disease and/or asthma, heart disease and stroke), lifestyle habits (physical activity, smoking and use of alcohol) and socioeconomic status (education, housing and monthly expenditure). The participants were tested on: (1) functional ability on activity of daily living and five-item instrumental activity of daily living scales; (2) cognitive ability based on the Abbreviated Mental Test-Modified. Depressive symptoms were assessed based on the Chinese version of the 15 item GDS, which has been previously validated [15, 16]. The cut off point for “depression” was a score of 8 or more, which is the standard [8, 17] and was used in our previous study [13].
Health status
We assessed health status using a simple, but comprehensive, 11-item morbidity index as in our previous study [14] by counting chronic diseases (5 items), use of health services (2 items), frailty (3 items) and unintentional weight loss > 10 lb in the last 6 months (1 item). The 5 chronic diseases were heart disease, stroke, diabetes, chronic obstructive pulmonary disease/asthma and hypertension (reported or measured blood pressure ≥ 140/90 mmHg). The two items of health service use were regular use of medication and any hospital admission in the last year. The three measures of frailty were cognitive impairment (Abbreviated Mental Test < 8), functional impairment (activities of daily living/instrumental activities of daily living > 12) and two or more falls in the last 6 months. Health status was then categorized into 5 groups based on these 11 items, from a count of 0 (healthy) to 1, 2, 3, and 4 or more (unhealthy).
Follow-up and outcomes
Vital status was ascertained from death registration in Hong Kong by record linkage using the unique Hong Kong identity card number. The last date of follow-up or censor date was March 31, 2009. Causes of death were routinely coded by the Department of Health according to the International Classification of Disease (ICD)—9th Revision before 2001 and 10th Revision in and after 2001. Most Hong Kong residents die in hospital enabling accurate ascertainment of cause of death which we have used in previous studies [14, 18]. The outcome was suicide (ICD-9 E 950-959 or ICD-10 X60-84).
Statistical analysis
Chi-square tests were used to compare participants’ characteristics by presence of depressive symptoms. The Cox proportional hazards model was used to estimate hazard ratios (HRs) and 95% confidence intervals (CI) for mortality. Two sets of baseline potential confounders were adjusted for in the models. Model 1 adjusted for sex (in the pooled men and women analysis only), age, education, monthly expenditure, smoking, alcohol drinking, physical activity and body mass index. Model 2 additionally adjusted for health status and self-rated health. Potential confounders were categorized as in Table 1. The proportional hazards assumption was checked by visual inspection of plots of log (−log (S)) against time, where S was the estimated survival function (Appendix Fig. 1). We also considered whether the association of depressive symptoms with suicide varied with sex or age group from the significance of interaction terms. Participants who died of any other causes were regarded as censored at the date of death [19, 20].
Table 1.
Baseline prevalence of depressive symptoms by demographic and lifestyle characteristics of enrollees at all 18 EHCs in Hong Kong enrolled from 1998 to 2000 and follow up till March 2009
| Men (N = 18,669) | Women (N = 37,277) | |||||||
|---|---|---|---|---|---|---|---|---|
| GDS < 8 (n = 17,324) column % | GDS ≥ 8 (n = 1,345) column % | GDS ≥ 8 Prevalence % | χ 2 P value | GDS < 8 (n = 33,183) column % | GDS ≥ 8 (n = 4,094) column % | GDS ≥ 8 Prevalence % | χ 2 P value | |
| Age group (years) | ||||||||
| 65–69 | 39.1 | 37.6 | 7.0 | 40.3 | 33.3 | 9.2 | ||
| 70–74 | 32.3 | 30.2 | 6.8 | 30.5 | 29.2 | 10.6 | ||
| 75–79 | 18.5 | 18.7 | 7.3 | 18.2 | 21.7 | 12.8 | ||
| 80–84 | 7.6 | 9.9 | 9.3 | 7.7 | 11.1 | 15.2 | ||
| ≥85 | 2.6 | 3.6 | 9.7 | <0.001 | 3.4 | 4.7 | 15.4 | <0.001 |
| Education | ||||||||
| Post-secondary | 6.9 | 5.7 | 6.1 | 1.9 | 1.3 | 7.7 | ||
| Secondary | 24.0 | 16.6 | 5.1 | 8.2 | 5.2 | 7.2 | ||
| Primary | 51.7 | 52.7 | 7.4 | 29.7 | 24.2 | 9.1 | ||
| No formal education but literate | 10.0 | 14.1 | 9.8 | 20.2 | 19.3 | 10.6 | ||
| Illiterate | 7.4 | 11.0 | 10.4 | <0.001 | 39.9 | 50.0 | 13.6 | <0.001 |
| Housing | ||||||||
| Public or aided | 39.1 | 50.1 | 9.0 | 39.3 | 47.8 | 13.1 | ||
| Private housing (rent) | 5.6 | 7.2 | 9.2 | 4.7 | 6.2 | 14.1 | ||
| Private housing (self-owned flat) | 49.5 | 34.8 | 5.2 | 48.1 | 38.4 | 9.0 | ||
| Temporary housing | 0.9 | 1.3 | 11.5 | 1.0 | 0.8 | 9.1 | ||
| Institutions | 3.0 | 4.5 | 11.0 | 4.7 | 5.5 | 12.7 | ||
| Others | 2.0 | 2.0 | 7.4 | <0.001 | 2.0 | 1.3 | 7.6 | <0.001 |
| Monthly expenditure (US $1 = HK $ 7.80) | ||||||||
| <HK $ 1,000 | 11.8 | 14.7 | 8.9 | 16.7 | 19.8 | 12.8 | ||
| HK $ 1,000 to <2,000 | 36.6 | 33.6 | 6.7 | 39.7 | 35.8 | 10.1 | ||
| HK $ 2,000 to <3,000 | 31.6 | 30.9 | 7.1 | 29.4 | 29.8 | 11.1 | ||
| HK $ 3,000 to <6,000 | 17.0 | 18.2 | 7.7 | 12.6 | 13.5 | 11.6 | ||
| HK $ 6,000 to <10,000 | 2.2 | 2.2 | 7.4 | 1.2 | 0.9 | 9.0 | ||
| >HK $ 10,000 | 0.9 | 0.4 | 3.2 | <0.001 | 0.4 | 0.2 | 4.8 | <0.001 |
| Smoking status | ||||||||
| Never smoker | 40.4 | 29.0 | 5.3 | 88.9 | 84.4 | 10..5 | ||
| Current smoker | 40.6 | 43.8 | 7.7 | 7.6 | 10.5 | 14.8 | ||
| Ex-smoker | 19.0 | 27.2 | 10.0 | <0.001 | 3.6 | 5.1 | 15.1 | <0.001 |
| Alcohol use | ||||||||
| Never drinker | 50.8 | 48.2 | 6.9 | 85.5 | 85.4 | 11.0 | ||
| Ex-drinker | 17.8 | 24.9 | 9.8 | 5.4 | 6.9 | 13.8 | ||
| Social drinker | 22.0 | 18.4 | 6.1 | 8.2 | 6.8 | 9.3 | ||
| Regular drinker | 9.4 | 8.5 | 6.5 | <0.001 | 1.0 | 0.9 | 9.5 | <0.001 |
| Physical activity | ||||||||
| Never | 16.2 | 25.8 | 11.0 | 13.8 | 19.4 | 14.9 | ||
| <30 min per day | 33.5 | 34.9 | 7.1 | 35.7 | 39.5 | 11.3 | ||
| ≥30 min per day | 50.3 | 39.3 | 5.1 | <0.001 | 50.4 | 41.1 | 8.5 | <0.001 |
| Body mass index | ||||||||
| <18.5 | 33.3 | 36.2 | 10.5 | 30.5 | 33.6 | 17.2 | ||
| 18.5 to <23 | 5.7 | 8.5 | 7.8 | 4.9 | 8.1 | 12.1 | ||
| 23 to <25 | 24.0 | 22.6 | 6.8 | 22.0 | 18.8 | 9.5 | ||
| ≥25 | 37.1 | 32.7 | 6.4 | <0.001 | 42.6 | 39.5 | 10.2 | <0.001 |
| Self report health status compare with similar age | ||||||||
| Better | 30.6 | 22.0 | 5.3 | 21.9 | 12.3 | 6.5 | ||
| Normal | 65.1 | 59.0 | 6.6 | 71.1 | 62.4 | 9.8 | ||
| Worse | 4.4 | 19.0 | 25.4 | <0.001 | 6.9 | 25.3 | 31.0 | <0.001 |
| Health status | ||||||||
| 0 (healthy) | 5.1 | 2.7 | 3.9 | 11.3 | 7.6 | 7.6 | ||
| 1 | 19.7 | 12.9 | 4.8 | 25.6 | 17.5 | 7.8 | ||
| 2 | 29.2 | 20.5 | 5.2 | 29.3 | 21.2 | 9.6 | ||
| 3 | 23.6 | 25.3 | 7.7 | 20.3 | 22.8 | 12.2 | ||
| 4 and more (unhealthy) | 22.3 | 38.7 | 11.9 | <0.001 | 13.5 | 26.9 | 19.7 | <0.001 |
Fig. 1.
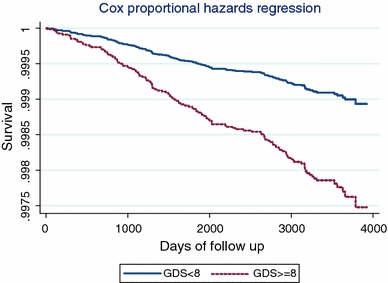
Cox proportion hazard of suicide mortality (crude analysis). GDS Geriatric Depression Scale
Ethics approval was obtained from the Ethics Committee of the Faculty of Medicine, the University of Hong Kong. The study complied with the Declaration of Helsinki.
Results
Of 56,088 participants, 142 were excluded because of missing information on potential confounders, and 55,946 (18,669 men and 37,277 women) were included in this analysis. At baseline, 5,439 (9.7%; 95% CI 9.4–9.9%) had depressive symptoms [1,345 men (7.2%; 95% CI 6.8–7.6%) and 4,094 women (11.0%; 95% CI 10.6–11.3%)]. Depressive symptoms were more common among those who were older, less educated, poorer, and underweight or in poorer health (Table 1).
After 486,474 person-years of follow-up till March 2009 (average 8.7 years; range 2 days–10.7 years), there were 131 suicide deaths (58 men and 73 women). The prevalence of depressive symptoms and mean GDS score were significantly higher in suicide than in non-suicide cases in both sexes (Table 2).
Table 2.
The prevalence of depressive symptoms (GDS score ≥ 8) and mean (95% CI) GDS score among suicide and non-suicide cases
| Men | Suicide (N = 58) | Non-suicide (N = 18,611) | P value |
|---|---|---|---|
| Depressive symptoms % (GDS score ≥ 8) | 15.5% | 7.2% | <0.05 |
| Mean of GDS score (95% CI) | 3.53 (2.61–4.45) | 2.63 (2.59–2.67) | <0.05 |
| Women | Suicide (N = 73) | Non-suicide (N = 37,204) | P value |
|---|---|---|---|
| Depressive symptoms % (GDS score ≥ 8) | 21.9% | 11.0% | <0.05 |
| Mean of GDS score (95% CI) | 4.98 (4.17–5.80) | 3.30 (3.27–3.33) | <0.05 |
Table 3 shows that up to March 2009, the crude suicide rate was 37.2 per 100,000 person-years in men and 22.1 per 100,000 person-years in women. The suicide rate was 86.9 per 100,000 person-years in depressed men and 45.6 per 100,000 person-years in depressed women, which were more than double the rates in non-depressed men and women (33.7 and 19.3 per 100,000 years, respectively). Depressive symptoms (GDS ≥ 8) were significantly associated with suicide in model 1, regardless of follow-up duration. Additional adjustment for health status and self-rated health in model 2 did not attenuate most of the associations. Until March 2009, in model 2, depressive symptoms were significantly associated with suicide in women (HR = 2.36, 95% CI 1.31–4.24), but the HR in men (HR = 2.03, 95% CI 0.96–4.29) became marginally non-significant, which was probably due to the small number of deaths (58 suicides in men versus 73 in women). However, there was no sex interaction (P = 0.95), which confirmed that the HRs were quite similar. The association did not vary with sex (P for interaction 0.54–0.95), regardless of follow-up duration. In general, the associations did not vary with age group or health status after stratifying by sex, regardless of follow-up duration.
Table 3.
Adjusted hazard ratios (95% CI) of suicide for depressive symptoms (dichotomous) by sex
| Follow up till | Death/death rate (100,000 person-years) | Crude | Model 1 | Model 2 | P value for interaction in model 2 by | ||
|---|---|---|---|---|---|---|---|
| HR 95% CI | HR 95% CI | HR 95% CI | Sex | Agea | Health statusb | ||
| 2003, December | |||||||
| Men | 18/24.6 | 3.81 (1.25–11.6)* | 3.99 (1.29–12.4)* | 4.34 (1.32–14.3)* | 0.62 | 0.43 | |
| Women | 34/22.6 | 2.95 (1.37–6.31)** | 2.43 (1.09–5.46)* | 2.30 (0.98–5.39) | 0.78 | 0.04 | |
| All | 52/23.2 | 3.18 (1.70–5.89)*** | 2.79 (1.44–5.40)** | 2.81 (1.40–5.63)** | 0.54 | 0.13 | 0.25 |
| 2005, December | |||||||
| Men | 33/30.5 | 3.03 (1.25–7.34)* | 2.79 (1.14–6.85)* | 2.87 (1.13–7.28)* | 0.31 | 0.66 | |
| Women | 48/21.3 | 2.46 (1.25–4.82)* | 2.30 (1.17–4.59)* | 2.31 (1.13–4.72)* | 0.32 | 0.23 | |
| All | 81/24.3 | 2.65 (1.54–4.52)* | 2.47 (1.13–4.27)*** | 2.51 (1.42–4.43)** | 0.65 | 0.24 | 0.33 |
| 2009, March | |||||||
| Men | 58/37.2 | 2.60 (1.27–5.30)** | 2.43 (1.18–5.00)* | 2.03 (0.96–4.29) | 0.67 | 0.11 | |
| Women | 73/22.1 | 2.36 (1.36–4.11)** | 2.28 (1.31–4.01)** | 2.36 (1.31–4.24)** | 0.16 | 0.49 | |
| All | 131/26.9 | 2.45 (1.58–3.80)*** | 2.33 (1.50–3.63)*** | 2.22 (1.39–3.52)*** | 0.95 | 0.98 | 0.40 |
Model 1 adjusted for age, education, monthly expenditure, smoking, alcohol drinking, physical activity, and body mass index
Model 2 adjusted for variables above and health status and self-rated health
Results for all were adjusted for sex: * P < 0.05, ** P < 0.01, and *** P < 0.001
aAge was categorized into five groups (65–69, 70–74, 75–79, 80–84, and 85 years or above)
bHealth status was categorized into 5 groups (0, 1, 2, 3, and 4 items or more)
Table 4 shows that when GDS score was analyzed as a continuous variable, it was significantly and linearly associated with suicide in both sexes after adjustment for potential confounders. The HR per GDS score in model 2 for follow-up till March 2009, in all subjects was 1.14 (1.08–1.20) after further adjusting for sex. Significant and positive linear trends were also found between depressive symptoms and suicide in both sexes in models 1 and 2 when GDS score was categorized into four groups, regardless of follow-up duration. The adjusted HRs for GDS score 1 versus zero in all subjects (men and women, adjusted for sex) were about 1.34–1.40 in models 1 and 2, which were insignificant, probably due to small numbers. No sex interaction was found.
Table 4.
Adjusted hazard ratios (95% CI) of suicide for depressive symptoms (GDS score as a continuous variable or categorical with 4 groups) by sex
| Continuous variable | P † | GDS (0–3) | GDS (4–7) | GDS (8–11) | GDS (12–15) | P for trend | P †† | GDS 1 (versus 0) | P ††† | |
|---|---|---|---|---|---|---|---|---|---|---|
| Model 1 | ||||||||||
| 2003, December | ||||||||||
| Men | 1.21 (1.06–1.37)** | 1.00 | 2.14 (0.71–6.47) | 4.33 (1.15–16.3)* | 9.81 (1.20–80.2)* | <0.01 | 4.06 (0.44–37.1) | |||
| Women | 1.19 (1.09–1.30)*** | 1.00 | 2.25 (1.02–4.98)* | 3.11 (1.17–8.29)* | 4.64 (1.03–20.8)* | <0.01 | 0.34 (0.02–3.94) | |||
| All | 1.19 (1.11–1.28)*** | 0.32 | 1.00 | 2.25 (1.18–4.27)* | 3.44 (1.56–7.57)** | 5.51 (1.62–18.8)* | <0.001 | 0.52 | 1.35 (0.32–5.60) | 0.14 |
| 2005, December | ||||||||||
| Men | 1.11 (1.00–1.23)* | 1.00 | 1.50 (0.65–3.44) | 3.03 (1.12–8.24)* | 3.28 (0.43–25.1) | <0.05 | 1.66 (0.48–5.70) | |||
| Women | 1.17 (1.08–1.26)*** | 1.00 | 2.14 (1.14–4.08)* | 2.76 (1.20–6.33)* | 4.56 (1.34–15.5)*** | <0.001 | 0.98 (0.48–6.03) | |||
| All | 1.15 (1.08–1.22)*** | 0.11 | 1.00 | 1.87 (1.13–3.12)* | 2.86 (1.51–5.42)*** | 4.15 (1.46–11.7)** | <0.001 | 0.50 | 1.34 (0.49–3.69) | 0.70 |
| 2009, March | ||||||||||
| Men | 1.11 (1.03–1.20)** | 1.00 | 1.36 (0.72–2.58) | 2.36 (1.04–5.36)* | 4.31 (1.02–18.2)* | <0.01 | 1.51 (0.95–1.14) | |||
| Women | 1.16 (1.09–1.23)*** | 1.00 | 2.27 (1.35–3.83)** | 3.11 (1.61-6.01)* | 3.39 (1.03–11.2)*** | <0.001 | 1.34 (0.36–5.86) | |||
| All | 1.14 (1.09–1.20)*** | 0.56 | 1.00 | 1.84 (1.24–2.74)** | 2.73 (1.64–4.54)** | 3.50 (1.39–8.77)** | <0.001 | 0.81 | 1.40 (0.67–2.94) | 0.96 |
| Model 2 | ||||||||||
| 2003, December | ||||||||||
| Men | 1.24 (1.08–1.43)*** | 1.00 | 2.50 (0.82–7.68) | 4.86 (1.21–19.4)* | 15.0 (1.67–135.2)* | <0.01 | 6.21 (0.54–71.3) | |||
| Women | 1.20 (1.09–1.32)*** | 1.00 | 2.21 (0.99–4.94) | 3.05 (1.10–8.46)* | 4.63 (0.96–22.2) | <0.01 | 0.54 (0.04–7.02) | |||
| All | 1.21 (1.12–1.31)*** | 0.15 | 1.00 | 2.31 (1.20–4.42)* | 3.61 (1.59–8.17)** | 6.26 (1.74–22.5)** | <0.001 | 0.93 | 1.37 (0.33–5.77) | 0.99 |
| 2005, December | ||||||||||
| Men | 1.13 (1.01–1.26)* | 1.00 | 1.60 (0.68–3.72) | 3.08 (1.09–8.17)* | 4.58 (0.56–36.9) | <0.05 | 1.57 (0.45–5.48) | |||
| Women | 1.19 (1.10–1.29)*** | 1.00 | 2.16 (1.11–4.19)* | 2.89 (1.22–6.88)* | 4.88 (1.35–17.6)* | <0.001 | 1.12 (0.17–7.25) | |||
| All | 1.17 (1.09–1.25)*** | 0.09 | 1.00 | 1.94 (1.16–3.25)* | 3.00 (1.55–5.82)*** | 4.74 (1.60–14.0) ** | <0.001 | 0.92 | 1.34 (0.49-3.71) | 0.99 |
| 2009, March | ||||||||||
| Men | 1.09 (1.00–1.19)* | 1.00 | 1.26 (0.66–2.41) | 1.99 (0.85–4.66) | 3.98 (0.89–17.7) | 0.03 | 1.41 (0.57–3.46) | |||
| Women | 1.17 (1.10–1.26)*** | 1.00 | 2.31 (1.36–3.94)** | 3.23 (1.63–6.42)*** | 3.70 (1.07–12.7)* | <0.001 | 1.34 (0.38–6.27) | |||
| All | 1.14(1.08–1.20)*** | 0.69 | 1.00 | 1.81 (1.21–2.72)** | 2.65 (1.57–4.51)** | 3.53 (1.36–9.16)** | <0.001 | 0.82 | 1.38 (0.66–2.92) | 0.99 |
Model 1 adjusted for age, education, monthly expenditure, smoking, alcohol drinking, physical activity, and body mass index
Model 2 adjusted for variables above and health status and self-rated health
† P for sex interaction of GDS score as a continuous variable; †† P for sex interaction of GDS score categorical with four groups; ††† P for sex interaction of GDS score 1 (versus 0)
* P < 0.05, ** P < 0.01, *** P < 0.001
Discussion
Although GDS has been used as a screening tool for depression and suicide ideation by a cross-sectional validation study in older Chinese [8], to the best of our knowledge, our study is the first long follow-up study (up to about 10 years) to date to examine suicide risk from depressive symptoms by GDS with different follow-up duration. In our sample, depressive symptoms significantly increased the risk of suicide, with a clear dose–response pattern, and the results were not modified by sex, age or health status. We also found no threshold effect of depressive symptoms on suicide, suggesting that earlier intervention should be considered in those with increased GDS score, even when they did not reach the diagnosis of depression (GDS ≥ 8).
Depressive symptoms and suicide in Chinese
A study by Yang et al. [5] found that most suicides in China were impulsive acts of deliberate self-harm following acute interpersonal crises. The authors suggested that one of the most important suicide prevention approaches in China should focus on improving mental health services. However, no prospective studies have been done on the association between depressive symptoms and suicide in Chinese or other Asian countries. Hence, our findings have provided important new information that depressive symptoms significantly predicted suicide. Chinese are less likely to report psychological symptoms than people in the West as depression has long been characterized as “maladies of the heart” which was not categorized as a disease in Chinese traditional culture [21]. This may lead to the underestimation of the prevalence of depressive symptoms in Chinese. Suicide ranks among the top 10 causes of death in Hong Kong [22]. Suicide rates in Hong Kong increased with age, and the highest suicide rates were observed in people aged 65 years or above [23], i.e. 37.8, 37.9, 43.4, 40.5 and 37.1 per 100,000 person-years in men and 24.7, 20.3, 26.7, 21.5 and 24.3 per 100,000 person-years in women, in 2000, 2002, 2004, 2006 and 2008, respectively [24]. Suicide rates appeared to be higher in men than women. On average, the male/female ratio from 2000 to 2008 was about 1.7. In our study, up to March 2009, the suicide rate was 39.9 and 24.6 per 100,000 person-years in men and women, respectively (male/female ratio = 1.6), after weighting by age distribution of the Hong Kong population in 2005, which appeared to be comparable with the general older population in Hong Kong.
Suicide in China was different from Europe and North America. Compared to these developed countries where suicide among men is predominant, China reports more suicides in women. China now faces many challenges such as poverty (especially in North China), rapid industrialization, low education and poor health services, which results in very limited resources on suicide prevention or research. Moreover, because of stigma and insufficient resources in establishing death registration and investigation systems, the suicide rates might be underestimated in older Chinese, especially for men. Lee et al. [25] found that Hong Kong people, in keeping with Chinese tradition, showed both tolerant and condemning attitudes toward suicide that varied with their socio-demographic characteristics. Suicide in Chinese traditional culture represents failure, especially for men, so it is possible that some deaths from injuries were deliberate, but were recorded as accidents to save ‘face’. Thus, misclassification bias from undefined or unreported suicide in our study cannot be ruled out, which might lead to underestimation of the HRs.
Dose–response relationship between depressive symptoms and suicide
Our results were in line with a case–control study by Phillips et al. [26] who found that there was a strong dose–response relationship between suicide risk and severity of depressive symptoms. However, the information on depression of the victims was obtained from the victim’s family members and close associates, which could not be validated and might lead to recall bias. Bradvik et al. [27] categorized depression levels as severe and moderate and reported significant association between depression and suicide with the long-term risk for suicide from severe depression being higher than that from moderate depression. Moreover, suicide is a major outcome of depression, although suicide alone cannot account for all the excess mortality of depression [28, 29]. However, the study by Bradvik et al. [27] in Sweden did not show a linear association between depression and suicide. No previous study on an Oriental population was found so we are the first one to find that suicide risk increased with GDS score as a continuous variable with no threshold.
We examined the threshold effect by several methods and consistently found no threshold of GDS scores. First of all, we used the GDS score as a continuous variable and found it was linearly and positively associated with suicide, with each per GDS score increase associated with 9 and 17% increase in suicide for men and women, respectively (P for sex interaction = 0.69). Secondly, we categorized the GDS scores into four groups (0–3, 4–7, 8–11 and 12–15) and we found significant linear trends between increased GDS scores and the suicide mortality in both men and women after different follow-up duration. Women with GDS scores of 4–7, which was below the usual cut-off score of 8, had significantly increased risk of suicide of about 80% compared with those with GDS of 0–3. Even though the HRs in men were not statistically significant, which was probably due to small number of suicide deaths, the risk for suicide increased linearly with increasing GDS score. Thirdly, we also examined the risk of suicide in those with a GDS score of 1 and found a non-significant increase of about 30–40% risk of suicide in this group. Furthermore, we also did sensitivity analysis using different cut-off scores of GDS to classify the subjects into different groups, such as 0–5, 6–10 and 10–15, but we also could not find any threshold in these groups (table not shown). Hence, no evidence of a threshold effect was found in the present study.
Effect of sex, age and health status
Our results showed that sex and age did not interact with the association between depressive symptoms and suicide, which was consistent with some but not all previous studies [9, 30]. Bolton et al. [30] found that depressed men and women in a nationally representative sample did not differ in the risk of suicide attempts. Gunnell et al. [31] found that the HR of suicide from depression was 6.78 (95% CI 1.36–33.71) in men and 1.66 (95% CI 0.43–6.45) in women, but the interaction between sex and depression was not statistically significant (P = 0.09). However, Simon and VonKorff [32] found that depressed men had a higher suicide rate than depressed women (P for sex interaction < 0.001). Several reasons can explain these inconsistent results. One explanation is that the sex difference in the association between suicide mortality and depression might be due to the difference in severity of depression between sexes. Ryan et al. [33] found that, compared with women, men had less depression but, if depressed, they were more seriously depressed than women. Ran et al. [34] found that depressed mood and hopelessness were the most important predictors of suicide attempts, which might be more common in men than women. Moreover, in our study, the non-significant results in men (HR = 2.03, 95% CI 0.96–4.29) might also be due to the relatively small number of deaths compared to women (58 vs. 73 suicides in men and women, respectively).
In our older Chinese subjects, depressive symptoms, defined by a cut-off of 8 in the GDS, were strongly associated with suicide after adjusting for sex, age, education, monthly expenditure, smoking, alcohol drinking, physical activity and body mass index (Model 1). The associations were slightly attenuated by adjustment for health status and potential attributes of depression such as self-rated health (Model 2). Poor health status is one of the important risk factors for suicide, although it has a complex relation with suicide [2]. Some diseases increase suicide risk, such as malignant neoplasm and HIV [35]. Depression is also associated with various somatic illnesses, such as disease of the circulatory system [36]. Hence, these associations might be bi-directional and complex, and further research is needed.
Study limitations
Our study had some limitations. Firstly, those who came to the health center were healthier which could result in some volunteer bias. However, the EHC participants were similar to the general older population in several characteristics [14], but they might not be similar for others, such as self-rated health. People with severe depression might be less likely to join the EHC, and some of them might be staying in nursing homes or hospitals. Our data showed that, standardized by Hong Kong age and sex-specific death rates by leading causes of death in 2005 [37], the standardized mortality ratios (SMRs and 95% CI) of the EHS cohort were lower than 100% for all-cause mortality [men 74.1% (72.1–76.2%); women 65.9% (64.3–67.6%)] and suicide rate [men 86.0% (66.5–111.2%); women 96.9% (76.9–122.0%)] in both sexes. The clients in the EHS cohort might be healthier than older people in the general population because EHC tends to attract older people who are ambulatory and more health conscious. Because we have no information on clinical depression, the HR of suicide from depressive symptoms might be under-estimated. Second, in older people, the median duration of a major depressive episode was 18.0 months (95% CI 12.8–23.1) [38]. Depression severity might vary during the follow up period but repeat measurement data was not available in the present study. However, depression can be prolonged without antidepressant treatment and very few depressed older people will take an antidepressant [39]. Moreover, the recurrence of depression is also a risk factor of suicide [40]. Third, potentially moderating effects of service utilization could not be assessed in the present study because such information was not available. Fourth, residual confounders, such as marital status, employment or occupation, might also partly affect the results. However, information on employment or occupation was not available in the present study, and the data on marital status was only available in 31,877 subjects (57%) as this question was added later. We compared results of models with and without marital status, and the results were similar. Hence, marital status showed no effect on the association between depressive symptoms and suicide. However, further studies taking into account these potential confounders are necessary. Finally, our study was performed in a homogeneous population. Future prospective studies, especially those focusing on older people from different populations with repeated measurement on depression and medications, are warranted.
Conclusions
Depressive symptoms predict higher suicide risk in older Chinese in a dose–response pattern. These associations were not attenuated by adjustment for health status, suggesting that depressive symptoms in older people are likely to be an independent causal factor of suicide. Moreover, sex, age and health status did not interact with the association between depressive symptoms and suicide, which suggest that general prevention program may be used for all groups. The GDS score showed no threshold in predicting suicide risk, suggesting that older people with low GDS scores deserve further attention and those with very high scores need urgent intervention.
Acknowledgments
This project was funded by grant S111016 from the Health Care & Promotion Fund Committee, Hong Kong. We declare that we have no conflict of interest in the present study.
Open Access
This article is distributed under the terms of the Creative Commons Attribution Noncommercial License which permits any noncommercial use, distribution, and reproduction in any medium, provided the original author(s) and source are credited.
Appendix
See Fig. 1.
References
- 1.Kasckow J, Liu N, Haas GL, Phillips MR. Case-control study of the relationship of depressive symptoms to suicide in a community-based sample of individuals with schizophrenia in China. Schizophr Res. 2010;122(1–3):226–231. doi: 10.1016/j.schres.2010.02.1056. [DOI] [PMC free article] [PubMed] [Google Scholar]
- 2.Maris RW. Suicide. Lancet. 2002;360(9329):319–326. doi: 10.1016/S0140-6736(02)09556-9. [DOI] [PubMed] [Google Scholar]
- 3.Chan SS, Chiu HF, Chen EY, et al. Population-attributable risk of suicide conferred by axis I psychiatric diagnoses in a Hong Kong Chinese population. Psychiatr Serv. 2009;60(8):1135–1138. doi: 10.1176/appi.ps.60.8.1135. [DOI] [PubMed] [Google Scholar]
- 4.Gallo JJ, Anthony JC, Muthen BO. Age differences in the symptoms of depression: a latent trait analysis. J Gerontol. 1994;49(6):P251–P264. doi: 10.1093/geronj/49.6.p251. [DOI] [PubMed] [Google Scholar]
- 5.Yang GH, Phillips MR, Zhou MG, et al. Understanding the unique characteristics of suicide in China: National Psychological Autopsy Study. Biomed Environ Sci. 2005;18(6):379–389. [PubMed] [Google Scholar]
- 6.Gaynes BN, West SL, Ford CA, et al. Screening for suicide risk in adults: a summary of the evidence for the U.S. Preventive Services Task Force. Ann Intern Med. 2004;140(10):822–835. doi: 10.7326/0003-4819-140-10-200405180-00015. [DOI] [PubMed] [Google Scholar]
- 7.IARC Monographs on the Evaluation of Carcinogenic Risks to Humans: Volume 44 Alcohol Drinking: Summary of Data Reported and Evaluation
- 8.Cheng ST, Yu EC, Lee SY, et al. The geriatric depression scale as a screening tool for depression and suicide ideation: a replication and extention. Am J Geriatr Psychiatry. 2010;18(3):256–265. doi: 10.1097/JGP.0b013e3181bf9edd. [DOI] [PubMed] [Google Scholar]
- 9.Sokero TP, Melartin TK, Rytsala HJ. Suicidal ideation and attempts among psychiatric patients with major depressive disorder. J Clin Psychiatry. 2003;64(9):1094–1100. doi: 10.4088/JCP.v64n0916. [DOI] [PubMed] [Google Scholar]
- 10.Vannoy SD, Duberstein P, Cukrowicz K. The relationship between suicide ideation and late-life depression. Am J Geriatr Psychiatry. 2007;15(12):1024–1033. doi: 10.1097/JGP.0b013e3180cc2bf1. [DOI] [PubMed] [Google Scholar]
- 11.Norlev J, Davidsen M, Kjoller M. Six year follow-up of health status changes in Danish adults with suicide tendency in 1994. Suicide Life Threat Behav. 2006;36(1):103–112. doi: 10.1521/suli.2006.36.1.103. [DOI] [PubMed] [Google Scholar]
- 12.Conwell Y, Duberstein PR, Hirsch JK. Health status and suicide in the second half of life. Int J Geriatr Psychiatry. 2010;25(4):371–379. doi: 10.1002/gps.2348. [DOI] [PMC free article] [PubMed] [Google Scholar]
- 13.Li ZB, Ho SY, Chan WM. Obesity and depressive symptoms in Chinese elderly. Int J Geriatr Psychiatry. 2004;19(1):68–74. doi: 10.1002/gps.1040. [DOI] [PubMed] [Google Scholar]
- 14.Schooling CM, Lam TH, Li ZB, et al. Obesity, physical activity, and mortality in a prospective chinese elderly cohort. Arch Intern Med. 2006;166(14):1498–1504. doi: 10.1001/archinte.166.14.1498. [DOI] [PubMed] [Google Scholar]
- 15.Cheng ST, Chan AC. Comparative performance of long and short forms of the Geriatric Depression Scale in mildly demented Chinese. Int J Geriatr Psychiatry. 2005;20(12):1131–1137. doi: 10.1002/gps.1405. [DOI] [PubMed] [Google Scholar]
- 16.Chan AC. Clinical validation of the Geriatric Depression Scale (GDS): Chinese version. J Aging Health. 1996;8(2):238–253. doi: 10.1177/089826439600800205. [DOI] [PubMed] [Google Scholar]
- 17.Lee H, HFK C, Kwok W. Chinese elderly and the GDS short form. Clin Gerontol. 1993;14:37–42. [Google Scholar]
- 18.Lam TH, Ho SY, Hedley AJ, et al. Mortality and smoking in Hong Kong: case-control study of all adult deaths in 1998. BMJ. 2001;323(7309):361. doi: 10.1136/bmj.323.7309.361. [DOI] [PMC free article] [PubMed] [Google Scholar]
- 19.Satagopan JM, Ben-Porat L, Berwick M, et al. A note on competing risks in survival data analysis. Br J Cancer. 2004;91(7):1229–1235. doi: 10.1038/sj.bjc.6602102. [DOI] [PMC free article] [PubMed] [Google Scholar]
- 20.Andersen PK, Abildstrom SZ, Rosthoj S. Competing risks as a multi-state model. Stat Methods Med Res. 2002;11(2):203–215. doi: 10.1191/0962280202sm281ra. [DOI] [PubMed] [Google Scholar]
- 21.Miller G. Mental health in developing countries. China: healing the metaphorical heart. Science. 2006;311(5760):462–463. doi: 10.1126/science.311.5760.462. [DOI] [PubMed] [Google Scholar]
- 22.Wong PW, Yeung AW, Chan WS, et al. Suicide notes in Hong Kong in 2000. Death Stud. 2009;33(4):372–381. doi: 10.1080/07481180802705791. [DOI] [PubMed] [Google Scholar]
- 23.Chi I, Yip PS, Yu GK, et al. A study of elderly suicides in Hong Kong. Crisis. 1998;19(1):35–46. doi: 10.1027/0227-5910.19.1.35. [DOI] [PubMed] [Google Scholar]
- 24.Martinsen EW. Physical activity in the prevention and treatment of anxiety and depression. Nord J Psychiatry. 2008;62(Suppl 47):25–29. doi: 10.1080/08039480802315640. [DOI] [PubMed] [Google Scholar]
- 25.Lee S, Tsang A, Li XY, et al. Attitudes toward suicide among Chinese people in Hong Kong. Suicide Life Threat Behav. 2007;37(5):565–575. doi: 10.1521/suli.2007.37.5.565. [DOI] [PubMed] [Google Scholar]
- 26.Phillips MR, Shen Q, Liu X, et al. Assessing depressive symptoms in persons who die of suicide in mainland China. J Affect Disord. 2007;98(1–2):73–82. doi: 10.1016/j.jad.2006.07.020. [DOI] [PubMed] [Google Scholar]
- 27.Bradvik L, Mattisson C, Bogren M, et al. Long-term suicide risk of depression in the Lundby cohort 1947–1997–severity and gender. Acta Psychiatr Scand. 2008;117(3):185–191. doi: 10.1111/j.1600-0447.2007.01136.x. [DOI] [PubMed] [Google Scholar]
- 28.Murphy E, Smith R, Lindesay J, et al. Increased mortality rates in late-life depression. Br J Psychiatry. 1988;152:347–353. doi: 10.1192/bjp.152.3.347. [DOI] [PubMed] [Google Scholar]
- 29.Penninx BW, Beekman AT, Honig A, et al. Depression and cardiac mortality: results from a community-based longitudinal study. Arch Gen Psychiatry. 2001;58(3):221–227. doi: 10.1001/archpsyc.58.3.221. [DOI] [PubMed] [Google Scholar]
- 30.Bolton JM, Belik SL, Enns MW, et al. Exploring the correlates of suicide attempts among individuals with major depressive disorder: findings from the national epidemiologic survey on alcohol and related conditions. J Clin Psychiatry. 2008;69(7):1139–1149. doi: 10.4088/JCP.v69n0714. [DOI] [PubMed] [Google Scholar]
- 31.Gunnell D, Rasul F, Stansfeld SA, et al. Gender differences in self-reported minor mental disorder and its association with suicide. A 20-year follow-up of the Renfrew and Paisley cohort. Soc Psychiatry Psychiatr Epidemiol. 2002;37(10):457–459. doi: 10.1007/s00127-002-0579-y. [DOI] [PubMed] [Google Scholar]
- 32.Simon GE, VonKorff M. Suicide mortality among patients treated for depression in an insured population. Am J Epidemiol. 1998;147(2):155–160. doi: 10.1093/oxfordjournals.aje.a009428. [DOI] [PubMed] [Google Scholar]
- 33.Ryan J, Carriere I, Ritchie K, et al. Late-life depression and mortality: influence of gender and antidepressant use. Br J Psychiatry. 2008;192(1):12–18. doi: 10.1192/bjp.bp.107.039164. [DOI] [PubMed] [Google Scholar]
- 34.Ran MS, Xiang MZ, Li J, et al. Correlates of lifetime suicide attempts among individuals with affective disorders in a Chinese rural community. Arch Suicide Res. 2007;11(1):119–127. doi: 10.1080/13811110600993090. [DOI] [PubMed] [Google Scholar]
- 35.Hughes D, Kleespies P. Suicide in the medically ill. Suicide Life Threat Behav. 2001;31(Suppl):48–59. doi: 10.1521/suli.31.1.5.48.24226. [DOI] [PubMed] [Google Scholar]
- 36.Hakko H, Manninen J, Karvonen K, et al. Association between physical illnesses and depressive symptoms requiring hospitalization in suicide victims. Psychiatry Res. 2008;160(3):271–277. doi: 10.1016/j.psychres.2007.07.025. [DOI] [PubMed] [Google Scholar]
- 37.Department of Health (2010) Age-standardised death rates by leading causes of death, 2001–2009. http://www.dh.gov.hk/english/pub_rec/pub_rec.html
- 38.Licht-Strunk E, Van Marwijk HW, Hoekstra T, et al. Outcome of depression in later life in primary care: longitudinal cohort study with three years’ follow-up. BMJ. 2009;338:a3079. doi: 10.1136/bmj.a3079. [DOI] [PMC free article] [PubMed] [Google Scholar]
- 39.Kuzuya M, Masuda Y, Hirakawa Y, et al. High prevalence rate of depression among community-dwelling frail elderly Japanese. Nippon Ronen Igakkai Zasshi. 2006;43(4):512–517. doi: 10.3143/geriatrics.43.512. [DOI] [PubMed] [Google Scholar]
- 40.Hantouche E, Angst J, Azorin JM. Explained factors of suicide attempts in major depression. J Affect Disord. 2010;127(1–3):305–308. doi: 10.1016/j.jad.2010.04.032. [DOI] [PubMed] [Google Scholar]