Abstract
This paper aims to instruct the reader in the assembly and operation of an infrared near-field microscope for imaging beyond the diffraction limit. The apertureless near-field microscope is a light scattering-type instrument that provides infrared spectra at circa 20 nm resolution. A complete list of components and a step-by-step protocol for use is provided. Common errors in assembly and instrument tuning are discussed. A representative data set that shows the secondary structure of an amyloid fibril is presented.
Keywords: Cellular Biology, Issue 33, nearfield imaging, infrared, amyloid, fibril, protein
Protocol
Background:
Apertureless probe near-field IR microscopy offers high spatial resolution imaging. It is a relatively new technique in which an incident infrared beam is scattered by a sharp atomic force microscopy (AFM) tip oscillating at the resonant frequency of the cantilever close to the sample. An IR detector collects the scattered light and is demodulated at this resonant frequency or its harmonics. In this way, the background scatter of the focused laser beam incident on the rest of the sample surface can be reduced and a spatial resolution far beyond the diffraction limit of light can be achieved to obtain infrared contrast with nanoscale spatial resolutioni,ii,iii. Since the apex of the AFM tip is much smaller than the focal area of the laser beam, the scattered light is weak. In order to enhance this scattered field, homodyne detection is used where a reference field is added to the collected scattered field and the relative phase of the fields is set such that maximum constructive interference occurs at the detector. The scattering intensity is then proportional to the magnitude of the reference electric field iv, v, vi. An important issue in near-field imaging is to avoid artifacts produced by the z-motion of the AFM tipvii, viii, ix, x, xi. This problem can be reduced with proper adjustment of the homodyne phase and excluding large topographical features, as previously demonstrated by Mueller et al. This technique is then reliably used to obtain the experimental scattering spectrum of materials with a spatial resolution of less than 30 nm15. The use of near-field microscopy for biological materials has been formerly demonstrated, particularly for macromolecules such as tobacco mosaic virusxii and E. Coli bacteriaxiii.
In this report, we illustrate the assembly of such an imaging device. We also present secondary structure information of amyloid fibrils formed from the #21-31 peptide fragment of β2-m obtained by apertureless near-field scanning infrared microscopy (ANSIM). Near-field images are collected concurrently with topography, enabling the detection and collection of the scattering spectrum of individual fibrils.
Our apertureless near-field scanning infrared microscope (ANSIM) measurements is a homemade device. The schematic of the experimental setup is shown in Scheme 1. An AFM microscope (Multimode, Veeco Instruments, Santa Barbara, CA) is used for measuring the topography of the sample as well as producing the near-field enhanced scattering modulated at the tip oscillation frequency. Tapping-mode, NSC14/Ti-Pt platinum-coated cantilevers (MicroMasch, Estonia) are used to enhance the scattering of the continuous, tunable IR laser (frequency range: 2000 cm-1 to 1600 cm-1, PL3 CO gas laser, Edinburgh Instruments, Great Britain) near the surface. A helium neon laser (Melles Griot, Albuquerque, NM) field is used as a guide for the invisible infrared radiation. The IR laser light is propagated towards a lens after passing a ZnSe partial reflector. It is then focused onto the apex of the oscillating AFM tip, with the polarization of the beam parallel to the long axis of the probe. The IR radiation collected by the lens is then added to a reference homodyne signal. A paraboloidal mirror is used to focus the IR radiation onto a mercury cadmium telluride (MCT) infrared detector (Graseby Infrared, Orlando, FL). A piezo driver (Thorlabs, Newton, NJ) is utilized to maximize the detected signal by correcting the phase of the homodyne light. Most of the optical components described above are firmly affixed on a platform and shifted in the X Y or Z positions using a translational stage. The AC fraction of the detected signal is transmitted to a lock-in amplifier (model SR844 RF, Stanford Research Systems, Sunnyvale, CA) which demodulates the signal at the tip oscillation frequency. The scattering intensity is observed as the AFM tip scans the sampled surface and the topography data is obtained concurrently. The software used for data and image collection is Nanoscope V5.31r1 (Veeco Instruments, Santa Barbara, CA).
Scheme1
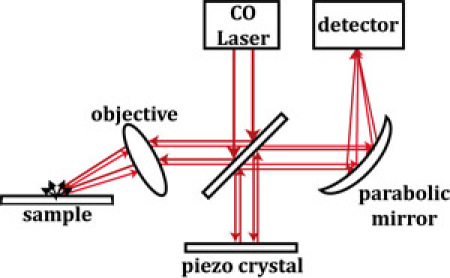
Figure 1 - shows the parts of the imaging system whose assembly and use we will describe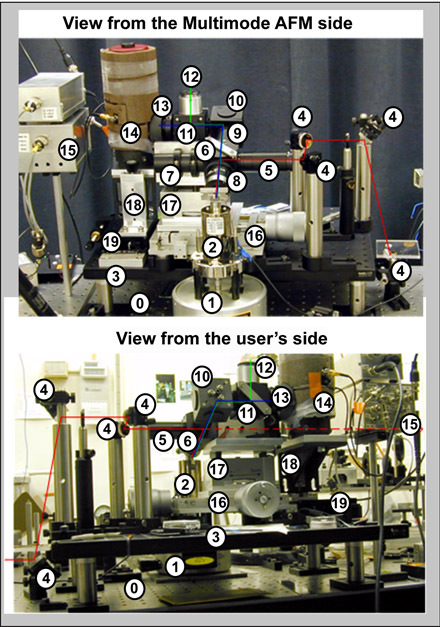
-
0
Optical table
-
1
Base of MM AFM
-
2
Scanner of MM AFM
-
3
Elevated optical breadboard(13" x 18" x 3/8", Thorlabs)
-
4
Guiding mirrors (gold coated, 1" dia.)
-
5
Optical tube with iris and center-block
-
6
Optical cube w/ ZnSe partial reflector
-
7
Optical tube used for securing setup on the elevating platform (17)
-
8
IR objective(FL 16 mm, NA 0.28, Ealing)
-
9
Optical tube for collected back-scattered light
-
10
Cube w/ off-axis paraboloidal mirror (90°, FL 5", Janos)
-
11
Cube to hold Ge plate @ 45°
-
12
Microscope eyepiece (x10)
-
13
XY-stage mounted pinhole (0.5 mm)
-
14
MCT IR detector (Graseby Infrared)
-
15
IR detector preamp (AC and DC)
-
16
XY stage to move beam position
-
17
Elevating table to focus the beam
-
18
Z-stage to position the IR detector
-
19
X-stage to position the IR detector
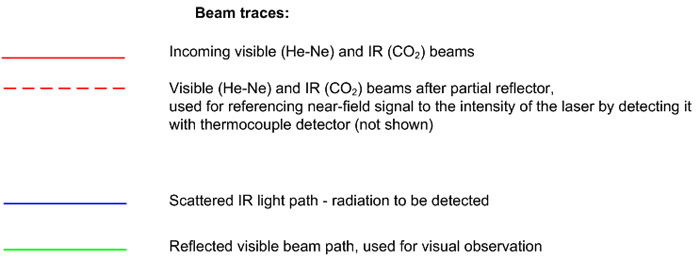
I. Initial Assembly of the optical setup
Assembly step I.1
Assemble the optical setup and with tuning mirrors and position the Helium-Neon (HeNe) beam parallel to the optical table (0) at approximately correct height (H) above the optical breadboard (3) and distance (D) from the center of the scanner (2).
This height H and distance D can be estimated from the height (H1) of the sample on top of the scanner (2) from the optical table, desired angle of incidence (α), height of the top of the breadboard above the optical table (h), geometrical sizes of the optical cube and IR objective (6 and 8 in Figure 1) and the working distance of IR objective (all together d, here d=1"+2"+2")
Figure 2
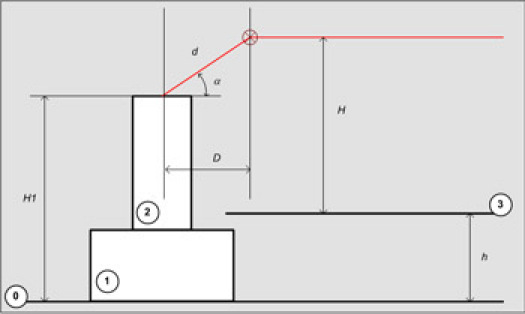
H=H1+d*sin(α)-h
D=d*cos(α)
Assembly step I.2
Figure 3
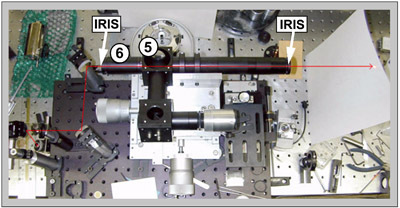
Figure 3: Without the beamsplitter in the cube (5) and with elongated optical tube at the other end of the cube (6) direct He-Ne beam through the irises attached at the ends of the tubes.
Assembly step I.3
Figure 4
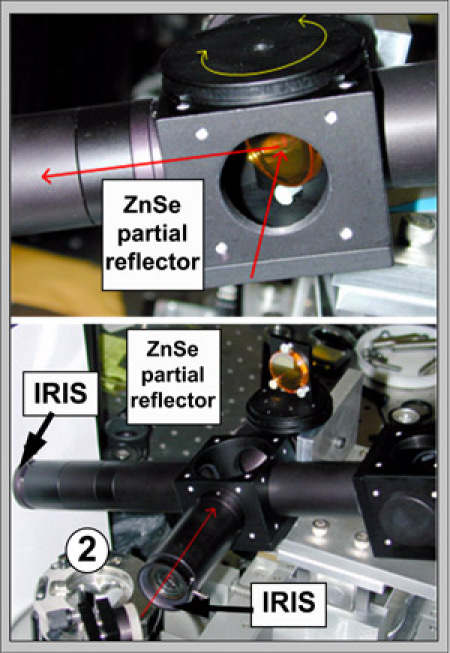
Figure 4: With the scanner (2) removed, attach the long optical tube with the iris at the end in place of the IR objective. Insert the ZnSe partial reflector to direct the beam toward the sample by traveling down the long optical tube. The ZnSe partial reflector should be mounted such that the HeNe beam hits the front surface of the reflector in the geometrical center of the optical cube holding the partial reflector.
Figure 5
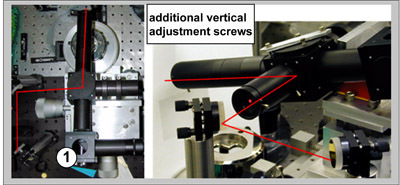
Figure 5: By rotating the partial reflector, direct the HeNe beam through the closed output iris. Since the mount of the partial reflector does not hold it exactly perpendicular, there are two home-installed adjustment screws, allowing for vertical motion of the beam. Use those if necessary.
Figure 6
Assembly step I.4
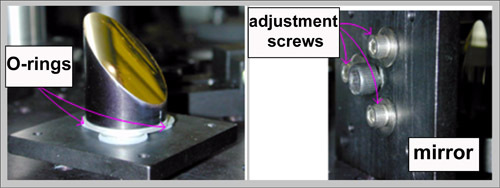
Figure 6. Mount the paraboloidal mirror with rubber O-rings in the optical cube (see 1, Figure 5). By tightening the screws, the O-rings compress, allowing for mirror adjustment.
Figure 7
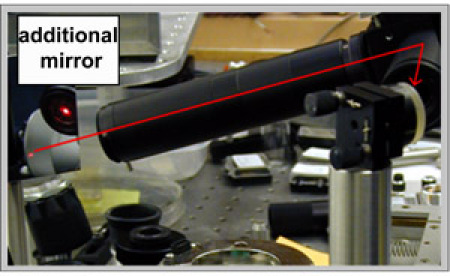
With additional mirrors (one is shown on Figure 7) direct the HeNe beam in the opposite direction, as illustrated on Figure 7. Adjust the beam to pass through the previously used irises. This beam will be used to adjust the paraboloidal mirror.
Figure 8

Figure 8: A paraboloidal mirror placed in the optical cube (10) reflects the light toward the position of detector. Adjustment screws direct the beam through the pinhole placed at the output of the cube (11), which will hold the germanium (Ge) window. After the beam is tuned through the pinhole, place the MCT detector close to the pinhole. Adjust the position of the IR detector such that He-Ne beam is on the sensing element of the detector. Move the detector down by ~2 mm (IR beam will be shifted down by the Ge window).
Assembly step I.5
Figure 9
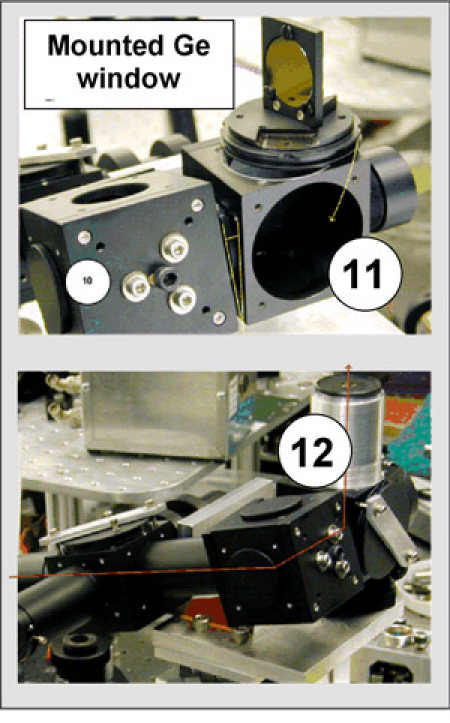
Figure 9: Insert the mount with Ge window into optical cube (11). The anti-reflection (AR) coated Ge window serves as an IR filter and permits visual observations of the cantilever and the sample. Attach the eyepiece (12). Twisting angle of the cube (11) with respect to cube (10) allows one to point the eyepiece in the desired direction. By rotating the mount of the Ge window, the HeNe beam is directed through the middle of the eyepiece.
Figure 10
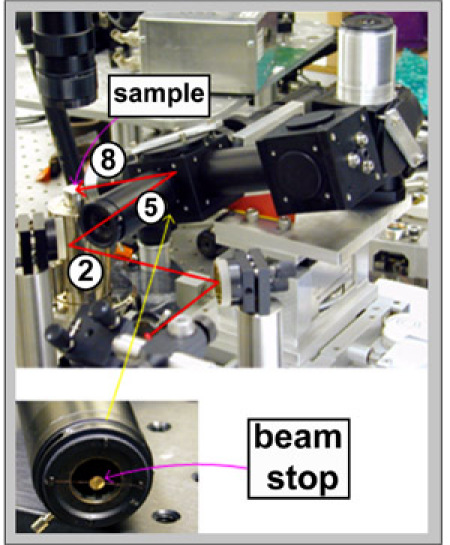
Figure 10: Connect IR objective (8) and AFM scanner (2). Attach the beamstop to the output end of the optical tube (5). Use a protective filter when viewing the HeNe beam through the eyepiece. Position a sample on the scanner and direct the HeNe beam through the input optical tube (5). Make sure the HeNe beam is wide enough to spill over the beamstop. The beamstop is used because of the Cassegrain objective, which only collects incoming light from the periphery of the beam. By adjusting the thread of the eyepiece a sharp image of the HeNe beam focused on the sample is obtained.
Assembly step I.6
A final adjustment of paraboloidal mirror is required. The output pinhole is replaced with the iris at the focal position of the paraboloidal mirror. Remove the Ge window and IR detector (mark position of IR detector!). Attach an additional lens after the iris at the approximate focal length of the lens from the iris. At this moment the engaged cantilever should be visible through the lens. Adjust the position of the paraboloidal mirror to center the end of the tip through the closed iris. Note that when the HeNe beam is correctly focused onto the tip, it makes a bright sparkle between the tip and it's reflection on the sample's surface. Re-attach the Ge window; adjust it for convenient visual observation of the cantilever. Replace the iris with the pinhole and remember that the pinhole used for IR detection should be shifted off-center due to the IR beam displacement by the Ge window. Place the IR detector at the previously marked position.
Lastly, direct the IR beam so that it travels together with the visible HeNe beam used for the tuning. Now everything should be ready for routine adjustment.
Routine Adjustment:
Adjustment step A.1:
Alignment with HeNe-Laser
It's easier to align with the visible HeNe (632nm) than with the invisible IR (around 6μm).
The path of the HeNe and of the IR beams come together at the tiltable mirror. If this mirror is tilted down the HeNe can pass, if the mirror is in position the IR beam propagates to the near-field setup. For alignment of one of the beams only, use the two mirrors not in common with the other path and are located before the tiltable mirror. If you have accidentally moved another mirror, first try to bring this mirror back to in its old position.
A.1.1. Coarse Alignment with two Mirrors
Use the two mirrors close to the HeNe laser to align the beam through all the irises along the path to the near-field stage. If you look at the beam in the homodyne arm, a corona-like beam profile should be observed (due to the beam blocker in the optical tube). This indicates that the beam passes straight through the tubes.
A1.2. Fine Alignment with Near-Field Stage
Attach the AFM head and engage the cantilever tip onto the sample. Focus the HeNe beam onto the end of the imaging cantilever. If doing so displaces the beam from the middle of the input optical tube (5) repeat tuning steps A.1. and A.1.2. until the beam is centered.
By moving the translational optical stage, the reflecting microscope objective is adjusted to focus the light on the apex of the cantilever tip, where it is scattered.
Rotate the Ge mirror below the eyepiece (located in the optical cube) and look through the eyepiece. The beam is focused at this point (or on the IR detector when the Ge mirror is pulled out of the cube) by the paraboloidal mirror. Move the stage backward or forward until a sharp image of the tip and its reflection on the sample surface is observed. Use the two other directions (up/down and right/left) to place the AFM tip approximately in the middle of the eyepiece.
Looking through a telescope, the AFM cantilever and its tip is observed. Again, remember to use a protective filter when viewing the HeNe beam. Without the HeNe beam, some red light is still observed which originates from the internal light of the AFM distance control. Move the translational stage in a right-left and/or up-down direction until a bright red sparkle is observed on the tip apex. If the alignment is fairly bad, move the stage to the left of the AFM and move to the right slowly. Watch for a red reflection moving across the reflective sample surface. If the red reflection is still not observed, translate the stage to the left again and move in an up-down fashion. Keep translating left-right, up-down until a red sparkle is observed as you focus the HeNe beam on the apex of the AFM tip.
A1.3. Overlapping the homodyne field with scattered light
Open the homodyne arm and look thorough the eyepiece. Three or more spots in a line with decreasing intensity is seen and these spots are a result of multiple reflections on front- and backsides of different optics. Move the mirror in the homodyne arm so that the second spot (from the bottom and in intensity) overlaps with the bright image of the tip, which is where the tip and its reflection are coming together.
A1.4. Position the detector
Remove the Ge mirror and the HeNe beam should go in the direction where the IR detector is located. Behind the optical tube, two ringlike spots are observed. The second spot (in intensity) is the spot that should go through the hole of the heat protection foil on the face of the IR detector. The spot with the highest intensity should be seen on the border of the hole.
A1.5. Changing from one sample to another
After changing the sample the AFM tip is no longer in the exact same position as before, but should not be too far off. Start with step A.1.2, since the difference is normally not very large.
Note: If the alignment is off, check to see if the HeNe beam still goes through all the irises and creates a bright red sparkle on the AFM tip. Sometimes you do not notice that you have touched and therefore moved a mirror from its original position. If the alignment is still bad, unfortunately the whole alignment procedure has to be completed again.
Adjustment step 2: Alignment of IR Beam
Use a CO laser line with a high intensity / power (at least 100 mW) as this will make the alignment easier. Fill the detector with liquid nitrogen and let it equilibrate for at least 30 minutes.
2.1. Coarse Alignment with two Mirrors
Place a power meter behind the first iris to monitor the power of the incoming IR beam. Next, adjust the mirror which is located before the tiltable mirror to obtain the highest power reading. Take the power meter and hold it behind the iris which is the closest to the near-field stage and adjust the tiltable mirror until a maximum power reading is obtained. Repeat this step a few times for optimal adjustment.
2.2. Watching the 1f Signal
The reference of the lock-in amplifier must be set to the isolate the frequency of the tip oscillation frequency by setting it to 1F (ext.), which is the AFM oscillation frequency. Set the scan size in force plot mode in the Nanoscope software to 3 μm. After coarse adjustment in 2.1., look for the right shape of the 1F signal. Next, tune the phase between the scattered light collected from the tip and the homodyned light from the homodyne arm by adjusting the piezo driver. This drives the mirror in the homodyne arm By changing the voltage of the piezo so that the first minimum of the 1F signal is around 500 nm starting from zero. Because every change in the alignment will change the length of both paths of light and therefore their relative phases, the phase needs to be corrected with the piezo.
| What will you see (1f signal)? | |
| Bad Alignment: | Two bumps on the 3 μm z scan size will be observed. |
| Medium Alignment: | The curvature of the first bump looks a little bit more concave than convex and the second bump is smaller than the first one. |
| (Nearly) Good Alignment: | Two bumps will be observed. The first bump is higher than the second bump, and the curvature on the right side of the first bump will be negative (concave). |
| What to do for alignment? | |
| Bad alignment: | Repeat the alignment procedure in step 2.1 as required. Because the IR beam diameter is large, most of the beam will pass the irises even if it is not perfectly aligned. Even if two bumps are still observed, the amount of the 1F signal can be increased by tuning one or both of the alignment mirrors. Watch for slight changes in the curvature of the first bump. Most of all, be patient since this is the most difficult part of the alignment. |
| Medium Alignment: | Try to adjust one or both of the alignment mirrors to obtain a nearly good alignment. Try moving the XYZ translational stage as well, BUT adjusting it by very small increments. |
| (Nearly) Good Alignment: | Adjust the mirrors and try to increase the maximum of the first bump. 1F signals are usually around 8 to 16 V, for low input powers it is less. Change the phase by changing the voltage using the piezo driver so that the first minimum comes closer to zero. If there is a significant 1F signal, switch the reference of the lock-in amplifier to isolate the 2F signal. Some of the signal should be observed and try to improve it a little bit more by very slightly tuning the mirrors and changing the phase. |
2.3. Changing from one sample to another
Execute Step A.1.5 under the alignment of the HeNe beam. Engage the AFM tip and propagate the IR beam through the microscope. Watch the 1F signal. If a 1F signal is still observed, adjust the tiltable mirror and adjust the phase. A good IF signal and therefore a good 2F signal may still be observed. If not, finely align the beam using step 2.2.
Representative Results:
Sample Preparation The #21-31 peptide was synthesized at the Center for Biotechnology and Bioengineering at the University of Pittsburgh and purified (>95%) by HPLC. To synthesize the amyloid fibrils, 0.8 mg of TMAO (Sigma-Aldrich) was added to a solution of 1 mM #21-31 peptide in 18 MΩ water, similar to a procedure executed by Yang et al.xiv
Ultraflat gold substratesxv were made. 40 μL of the one-month old solution (room temperature incubation, pH 5.5) was deposited for several minutes onto fresh ultraflat gold substrates. They were briefly rinsed with a stream of 18 MΩ water, dried with flowing N2 gas and positioned in the ANSIM instrument.
Figure 11 shows topography and near-field images collected for the #21-31 peptide fibrils. A) Topography image obtained simultaneously with its corresponding near-field image. The labels represent individual fibrils and are used to feature the type of secondary conformation each fibril has. B and C) Corresponding near-field images collected at two different wavenumbers: 1631 and 1691 cm-1. The area of each image is 1 x 1 μm2. Left scale represents height, right scale is the scattered field from the lock-in amplifier.
Figure 11

Acknowledgments
We gratefully acknowledge NSF, NSERC, NIH, and ONR.
References
- Mueller K, Yang X, Paulite M, Fakhraai Z, Gunari N, Walker GC. Chemical imaging of the surface of self-assembled polystyrene-b-poly(methyl methacrylate) diblock copolymer films using apertureless near-field IR microscopy. Langmuir. 2008;24:6946–6951. doi: 10.1021/la703406d. [DOI] [PubMed] [Google Scholar]
- Lahrech A, Bachelot R, Gleyzes P, Boccara AC. Infrared-reflection-mode near-field microscopy using an apertureless probe with a resolution of lambda/600. Opt. Lett. 1996;21:1315–1317. doi: 10.1364/ol.21.001315. [DOI] [PubMed] [Google Scholar]
- Taubner T, Hillenbrand R, Keilmann F. Performance of visible and mid-infrared scattering-type near-field optical microscopes. J. Microsc. 2003;210:311–314. doi: 10.1046/j.1365-2818.2003.01164.x. [DOI] [PubMed] [Google Scholar]
- Kim ZH, Leone SR. Polarization-selective mapping of near-field intensity and phase around gold nanoparticles using apertureless near-field microscopy. Optics Express. 2008;16:1733–1741. doi: 10.1364/oe.16.001733. [DOI] [PubMed] [Google Scholar]
- Bridger PM, McGill TC. Observation of nanometer-scale optical property discrimination by use of a near-field scanning apertureless microscope. Opt. Lett. 1999;24:1005–1007. doi: 10.1364/ol.24.001005. [DOI] [PubMed] [Google Scholar]
- Stebounova L, Akhremitchev BB, Walker GC. Enhancement of the weak scattered signal in apertureless near-field scanning infrared microscopy. Rev. Sci. Instrum. 2003;74:3670–3674. [Google Scholar]
- Akhremitchev BB, Pollack S, Walker GC. Apertureless Scanning Near-Field Infrared Microscopy of a Rough Polymeric Surface. Langmuir. 2001;17:2774–2781. [Google Scholar]
- Hecht B, Bielefeldt H, Inouye Y, Pohl DW, Novotny L. Facts and Artifacts in Scanning Near-Field Optical Microscopy. J. Appl. Phys. 1997;81:2492–2498. [Google Scholar]
- Labardi M, Patane S, Allegrini M. Artifact-free near-field optical imaging by apertureless microscopy. Appl. Phys. Lett. 2000;77:621–623. [Google Scholar]
- Palanker DV, Simanovskii DM, Huie P, Smith TI. On Contrast Parameters and Topographic Artifacts in Near-Field Infrared Microscopy. J. Appl. Phys. 2000;88:6808–6814. [Google Scholar]
- Akhremitchev BB, Sun Y, Stebounova L, Walker GC. Monolayer-Sensitive Infrared Imaging of DNA Stripes Using Apertureless Near-Field Microscopy.Langmuir. 2002;18:5325–5328. [Google Scholar]
- Brehm M, Taubner T, Hillenbrand R, Keilmann F. Infrared Spectroscopic Mapping of Single Nanoparticles and Viruses at Nanoscale Resolution. Nano Lett. 2006;7:1307–1310. doi: 10.1021/nl0610836. [DOI] [PubMed] [Google Scholar]
- Dazzi A, Prazeres R, Glotin F, Ortega JM. Analysis of nano-chemical mapping performed by an AFM-based ("AFMIR") acousto-optic technique. Ultramicroscopy. 2007;107:1194–1200. doi: 10.1016/j.ultramic.2007.01.018. [DOI] [PubMed] [Google Scholar]
- Yang DS, Yip CM, Huang THJ, Chakrabartty A, Fraser PE. Manipulating the Amyloid-β Aggregation Pathway with Chemical Chaperones. J. Biol. Chem. 1999;274:32970–32974. doi: 10.1074/jbc.274.46.32970. [DOI] [PubMed] [Google Scholar]
- Meadows PY, Walker GC. Force Microscopy Studies of Fibronectin Adsorption and Subsequent Cellular Adhesion to Substrates with Well-Defined Surface Chemistries. Langmuir. 2005;21:4096–4107. doi: 10.1021/la047241v. [DOI] [PubMed] [Google Scholar]


