

Abstract
Low 25 hydroxyvitamin D (25(OH)D) levels have been linked to hip fracture in White women. To study the association of 25(OH)D to risk of fracture in multiethnic women, we performed a nested case control study within the prospective Women’s Health Initiative Observational Study. Incident fractures were identified in 381 Black, 192 Hispanic, 113 Asian and 46 American Indian women over an average of 8.6 years. A random sample of 400 White women who fractured was chosen. One control was selected per case and matched on age, race/ethnicity and blood draw date. 25(OH)D, parathyroid hormone and vitamin D binding protein (DBP) were measured in fasting baseline serum. Conditional logistic regression models were used to calculate the odds ratio (OR) and 95% Confidence Intervals (95% CI). In multivariable models, higher 25(OH)D levels as compared with levels <20ng/mL were associated with a lower risk of fracture in White women: (20-<30 ng/mL), OR=0.82; (0.59, 1.16) and (≥30.0 ng/mL), OR=0.55; (0.34, 0.89), p trend=0.02. In contrast, higher 25(OH)D (≥20 ng/mL) as compared with levels <20ng/mL were associated with a higher risk of fracture in Black women, OR=1.45; (1.06, 1.98), p trend=0.043. Higher 25(OH)D (≥30.0 ng/mL) was associated with higher fracture risk in Asian women after adjusting for DBP, OR=2.78; (0.99, 7.88), (p trend=0.04). There was no association between 25(OH)D and fracture in Hispanic or American Indian women. Our results suggest divergent associations between 25(OH)D and fracture by race/ethnicity. The optimal level of 25(OH)D for skeletal health may differ in White and Black women.
Keywords: Fractures, serum vitamin D, race/ethnicity, osteoporosis, 25 hydroxyvitamin D
Introduction
Low serum Vitamin D concentrations (<20 ng/mL) have been linked to hip fractures, at least in White women 1. There is little known about the relationship between circulating vitamin D and fracture in other race/ethnic groups. The prevalence of vitamin D levels <20 ng/mL has been reported to be 3 times higher in Blacks than in Whites 2-3. Other racial groups including Hispanics and Asians have lower levels of circulating 25(OH)D 4-5. The higher parathyroid hormone (PTH) levels observed in Blacks might contribute to accelerated bone loss with aging but small experimental studies suggest that Blacks may have skeletal resistance to the bone resorbing effects of PTH 6-7.
Vitamin D binding protein (DBP) or group specific component (Gc) binds to and transports vitamin D to target tissues to maintain calcium homeostasis 8. DBP has a high plasma concentration compared to 25(OH)D with little variability observed by season 9. To our knowledge, little is known about ethnic difference in DBP and the association between DBP and fractures. One study showed that the genetic effect of the DBP gene on fracture risk depended on other environmental risk factors e.g., calcium intake 10 .
The objective of the current analysis was to examine the association between circulating 25(OH)D, PTH and DBP to fracture in White, Black, Hispanic, Asian and American Indian women enrolled in the Women’s Health Initiative Observational Study (WHI-OS).
Methods
Study Population
The study population comes from the WHI-OS, a prospective cohort study that enrolled 93,676 women ages 50–79 years from 1994–1998 at 40 US clinical centers. Study methods have been described in detail elsewhere 11. Briefly, women were eligible if they were postmenopausal, unlikely to move or die within three years, not enrolled in the WHI Clinical Trials and not currently participating in any other clinical trial. The study was approved by Human Subjects Review Committees at each participating institution. All participants provided written informed consent.
Information on race or ethnicity was obtained by self-report and included “whites” (not of Hispanic origin); “blacks” (not of Hispanic origin); “Hispanics/Latinos” (Mexican, Cuban, Puerto Rican, Central American, or South American); “Asians or Pacific Islanders” (Chinese, Indo-Chinese, Korean, Japanese, Pacific Islander, Vietnamese); “American Indian” (including Alaskan Native), or “other.” All covariates were ascertained at baseline.
Outcome Ascertainment
Women were sent questionnaires annually to report any hospitalization and other specific outcomes including fractures. We collected information on all fractures that occurred after study entry except those of the fingers, toes, face, skull, and sternum. Hip fractures were verified by review of medical records and confirmed by blinded central adjudicators 12. Information on other clinical fractures was obtained by self-report. In the WHI, 80% of self-reported non-hip fractures were confirmed by physician review of medical records, suggesting that the self-report of such fractures is reasonably accurate 13. For this analysis, we excluded patients with hip fractures due to cancer and women reporting clinical spine or coccyx fractures because of poor reliability 12 .
Nested Case-Control Design
The present study is a case-control study nested within the prospective design of WHI-OS. All self-reported cases of fracture in WHI-OS as of August 2006 (the last date of original follow-up) were selected as potential cases. We excluded women reporting “other” or “unknown” race/ethnicity, current hormone therapy at baseline and use of bisphosphonates, selective estrogen receptor modulators (SERMs), or tamoxifen. We also excluded women with missing important covariates such as weight, height and history of fracture, and less than 2 vials of unthawed serum or less than 0.25mL of EDTA plasma. A total of 7,116 possible cases and 37,713 controls were eligible after these exclusions. We chose all fracture cases among non-Whites, including 381 Black, 192 Hispanic, 113 Asian and 46 American Indian women. A random sample of 400 fracture cases was chosen from a total of 6384 fractures among the White participants.
One control was selected for each case from the risk set corresponding to the time of the case’s event. All participants (cases included) were part of the risk set until they had an event or until their last recorded visit (censored if lost to follow-up). Controls were matched to cases by age at screening (+/− 1 year), race/ethnicity (White, Black, Hispanic, Asian, American Indian), and blood draw date (+/− 90 days). All matching factors were weighted equally during the selection. Controls were chosen to have a fracture free follow-up time at least as long as the cases event time. Seventeen unmatched cases during the first match attempt were subsequently matched by age at screening (+/− 2 year), race/ethnicity, and draw date (+/− 365 days).
In summary, there were 1132 cases and 1132 controls for a total of 2,246 women. The average follow-up time from enrollment to the last follow-up date as of August 31, 2006 was 8.60 (SD = 1.61), among cases and 8.65 (SD = 1.61) years among controls.
Laboratory Procedures
Ancillary grant funding was obtained in 2008 to measure the biochemical measures. A 12 hour fasting blood sample was obtained at the baseline visit, processed and stored at − 80° C according to strict quality control procedures 14. Previously unthawed serum samples were sent to have 25(OH)D concentrations, PTH and DBP measured at the Reproductive Endocrine Research Laboratory at the University of Southern California. For 25(OH)D, a radioimmunoassay was used with DiaSorin reagents (Stillwater, MN). The sensitivity of the assay was 3.75 nM. The inter-assay coefficients of variation were 11.7%, 10.5%, 8.6% and 12.5% at 14.0, 56.8, 82.5 and 122.5 nM, respectively.
Plasma PTH measured using the Scantibodies (Santee, CA) whole PTH (1-84) specific assay kit, designed for the quantitative determination of whole PTH without cross-reaction to PTH (7-84) fragments. This is an immunoradiometric (IRMA) assay utilizing polyclonal 1-84 PTH antibodies; one that tends to bind in the N terminal regions (Label antibody) and one in the C terminal region (Capture Antibody) of 1-84 PTH, respectively. The use of these antibodies guarantees that only whole PTH is detected using this whole PTH assay, values > 39 are considered indicative of hyperparathyroidism. The inter-assay coefficients of variation (CV %) were 2.3% and 1.30% for the low (39 pg/mL) and high (359 pg/mL) quality control samples, respectively. The sensitivity of the assay was 2 pg/mL.
DBP was measured with a sandwich-type enzyme-linked immunosorbent assay (ELISA), using reagents from a commercial kit (ALPCO, Salem, NH). The assay is intended for the quantitative determination of free and not actin-bound DBP. It utilizes a polyclonal DBP antibody that is coated on microtiter plate wells and a polyclonal peroxidase-labeled DBP antibody that is added after addition of different concentrations of the standard and aliquots of serum samples. The inter-assay coefficients of variation were 8.8% and assay sensitivity, 1.2 ng/mL.
Participants were excluded if their vitamin D, PTH or DBP was >3 standard deviation (SD) above the mean. The final sample included 390 White cases and controls; 379 Black cases and controls; 191 Hispanic cases and controls; 112 Asian cases and controls and 44 American Indian cases and controls.
Other Measurements
All covariates were ascertained at baseline and included education, living arrangements, personal history of fracture, parental history of fracture after age 40, reproductive and medical history, alcohol intake, cigarette smoking, physical activity, general health status, diet and falls. Current use of prescription medications was recorded by clinic interviewers by direct inspection of medicine containers. Prescription names were entered into the WHI database and assigned drug codes using Medispan software. Dietary intakes of calcium and vitamin D were assessed using a semi-quantitative food frequency questionnaire 15. We also collected information on the use of calcium and vitamin D supplements, the amount and frequency of intake.
Physical activity was classified on the basis of frequency and duration of walking and mild, moderate and strenuous activities in the prior week. Kilocalories of energy expended in a week was calculated (metabolic equivalent (MET), score=kcal hours/week/kg) 16. Physical function was measured using the 10-item RAND-36 physical function scale 17. We compared women with a score >90 versus ≤ 90; this cutoff corresponded to the median score. Weight was measured on a balance beam scale and height using a stadiometer. Body mass index was calculated as weight (kg)/height (m2).
Statistical Analysis
We used chi-square and t tests to compare baseline characteristics between cases and matched control participants. For continuous measures that were skewed (e.g., PTH) Wilcoxon Rank sum tests were used. Separate analyses were carried out within each race/ethnicity. To further assess confounding, we compared baseline characteristics across categories of 25(OH)D (<20 ng/mL, 20-<30 ng/mL and ≥30 ng/mL) 18 in the combined cohort of cases and controls. For normally distributed variables, a test of linear trend was performed by treating vitamin D clinical cutoffs as category integer valued steps. For non-normally distributed or skewed variables, the Jonckheere-Terpstra test of trend was performed. The Cochran-Armitage test for trend was used for dichotomous variables.
We assessed the association between serum 25(OH)D, PTH and DBP concentrations and incident fracture in conditional logistic regression models, models appropriate for the matched case-control design. We calculated odds ratios (OR) and 95% confidence interval (CI) from the conditional logistics models across categories of 25(OH)D (<20 ng/mL; 20-<30 ng/mL; ≥30.0 ng/mL) and across quartiles of PTH, DBP and ratio 25(OH)D/DBP. Quartile cutoffs were determined from the distribution among the controls. We defined the lowest category as the referent group.
For 25(OH)D, we first examined the unadjusted association. For the multivariable adjusted model, weight, height, physical activity, total calcium intake and personal history of fracture were forced into the model. Backwards elimination was used and the following variables were removed from the model: alcohol, education, smoking, health status, diabetes, past hormone therapy use, glucocorticoid use and parental history of fracture. The final multivariable model included weight, height, physical activity, calcium intake and history of fracture. Based on examination of lowess smoothers fracture rates versus 25(OH)D curves, threshold effects were evaluated by identifying potential inflection points using a single change-point linear spline model. We performed a test of equality versus difference of slopes to determine the 25(OH)D concentration where the slopes above and below the cut point were significantly different and most different. If more than one cutoff was identified (p<0.05) we chose the 25(OH)D value with the lowest p-value as the threshold. Waist circumference was added to the multivariable model to test whether the effect of 25(OH)D on fracture is mediated by body fat. For PTH, DBP and 25(OH()D/DBP multivariable models, we also used backwards elimination to identify covariates and forced inclusion of covariates weight, height, physical activity, total calcium intake and personal history of fracture. To explore whether the results are modified by other calcitropic hormones, we subsequently adjusted the 25(OH)D models for PTH and DBP; PTH models for 25(OH)D and DBP and the DBP models for 25(OH)D and PTH.
Results
The average age of the subjects varied across race/ethnic groups and ranged from 62.6 years among Black women to 66.2 years among White women, Table 1. Among White women, fractures cases were more likely to report diabetes, a positive personal and parental fracture history and a higher waist circumference. Among Black women, fracture cases were more likely to report ever smoking, diabetes, and a positive personal fracture history. Hispanic cases were more likely to report a previous fracture and have a higher waist circumference than controls. Among Asian women, women with a fracture were more likely to report fair to poor health status, although the difference did not reach statistical significance (p=0.06). There were no significant differences between cases and controls among American Indian women except a borderline significant lower history of past hormone therapy among the cases.
Table 1.
Baseline Characteristics of Fracture Cases and Controls by Ethnicity
| White | Black | Hispanic | Asian | American Indian | |||||||||||
|---|---|---|---|---|---|---|---|---|---|---|---|---|---|---|---|
| Control (n=390) |
Case (n=390) |
p- value |
Control (n=379) |
Case (n=379) |
p- value |
Control (n=191) |
Case (n=191) |
p-value | Control (n=112) |
Case (n=112) |
p- value |
Control (n=44) |
Case (n=44) |
p-value | |
| Age, mean (SD), yrs | 66.2 ± 7.4 | 66.2 ± 7.4 | 0.94 | 62.6 ± 7.7 | 62.6 ± 7.6 | 0.99 | 62.8 ± 7.4 | 62.9 ± 7.5 | 0.97 | 65.1 ± 7.6 | 65.1 ± 7.6 | 0.99 | 63.6 ± 7.3 | 63.6 ± 7.4 | 0.99 |
| Education, <high school, % | 1.6 | 1.3 | 0.75 | 3.7 | 4.5 | 0.58 | 18.2 | 24.9 | 0.13 | 1.8 | 3.7 | 0.41 | 11.6 | 11.6 | 0.99 |
| Smoking status, % | 0.45 | 0.04 | 0.71 | 0.65 | 0.77 | ||||||||||
| Past | 43.8 | 39.3 | 33.9 | 43.1 | 29.0 | 26.7 | 14.8 | 18.5 | 34.9 | 34.1 | |||||
| Current | 5.7 | 6.0 | 11.7 | 10.6 | 9.1 | 7.4 | 5.6 | 3.7 | 11.6 | 17.1 | |||||
| Alcohol, ≥7 drinks/wk, % | 12.5 | 10.7 | 0.48 | 4.5 | 4.0 | 0.62 | 7.3 | 5.1 | 0.59 | 5.5 | 7.3 | 0.89 | 9.3 | 4.7 | 0.57 |
| Health status, fair to poor , % | 5.7 | 7.8 | 0.16 | 22.1 | 24.3 | 0.70 | 25.6 | 29.7 | 0.67 | 8.3 | 15.6 | 0.06 | 23.8 | 14.6 | 0.57 |
| RAND 36-Physical Functioning Score >90, % |
39.7 | 33.3 | 0.07 | 28.8 | 28.0 | 0.82 | 34.5 | 30.8 | 0.49 | 47.6 | 38.9 | 0.20 | 27.5 | 25.0 | 0.80 |
| Physical activity, median (IQR), METs/wk |
8.8 (2.9-20.9) |
8.5 (2.5-18.2) |
0.38 | 6.3 (1.3-15.3) |
5.0 (1.1-15.3) |
0.31 | 6.4 (2.0-17.5) |
6.9 (1.5-16.5) |
0.89 | 10.8 (3.8-25.8) |
10.5 (2.5-19.3) |
0.24 | 7.5 (1.9-15.2) |
6.2 (1.3-14.3) |
0.67 |
| Total calcium intake*, median (IQR), mg/day |
760.1 (524-1078) |
733.6 (524-1078) |
0.42 | 498.2 (305-753) |
515.5 (326-847) |
0.24 | 596.6 (405-913) |
655 (428-910) |
0.71 | 510.8 (326-747) |
480.8 (298-742) |
0.79 | 667.0 (385-1041) |
658.4 (402-908) |
0.75 |
| Treated diabetes mellitus, % | 2.9 | 6.0 | 0.04 | 11.1 | 16.2 | 0.05 | 7.7 | 12.1 | 0.16 | 2.8 | 7.3 | 0.12 | 11.6 | 23.3 | 0.16 |
| Broke bone, ever, % | 35.1 | 55.4 | <0.001 | 21.1 | 30.3 | 0.004 | 21.5 | 36.1 | 0.002 | 19.6 | 25.9 | 0.26 | 34.1 | 50.0 | 0.13 |
| Parental history of fracture, % yes | 38.2 | 46.2 | 0.025 | 18.7 | 20.8 | 0.466 | 30.9 | 33.0 | 0.661 | 29.5 | 31.3 | 0.772 | 27.3 | 40.9 | 0.177 |
| Hormone therapy use, past, % | 26.4 | 27.5 | 0.75 | 19.7 | 17.8 | 0.50 | 20.9 | 19.8 | 0.79 | 34.9 | 27.5 | 0.24 | 37.2 | 20.9 | 0.10 |
| Oral glucocorticoid use, daily,% | 0.8 | 2.1 | 0.13 | 1.7 | 3.3 | 0.15 | 1.7 | 3.9 | 0.20 | 1.8 | 0.0 | 0.50 | 3.0 | 2.3 | 0.31 |
| Falls, past 12 months, % | 0.606 | 0.39 | 0.49 | 0.32 | 0.30 | ||||||||||
| 1 | 18.7 | 20.9 | 17.1 | 20.1 | 23.3 | 24.3 | 11.9 | 19.3 | 23.3 | 25.6 | |||||
| ≥2 | 13.2 | 14.4 | 13.1 | 14.9 | 16.9 | 21.4 | 11.0 | 9.2 | 11.6 | 23.3 | |||||
| BMI, mean (SD), kg/m2 | 27.3 ± 5.7 | 27.7 ± 5.6 | 0.34 | 30.4 ± 6.7 | 30.5 ± 6.4 | 0.94 | 28.4 ± 6.7 | 29.5 ± 6.5 | 0.12 | 24.5 ± 6.2 | 24.8 ± 5.1 | 0.72 | 29.6 ± 7.0 | 29.3 ± 6.7 | 0.81 |
| Waist circumference, cm | 84.6 ± 12.8 | 86.7 ± 13.1 | 0.02 | 90.9 ± 14.4 | 91.5 ± 13.6 | 0.57 | 85.4 ± 12.5 | 89.3 ± 13.1 | 0.003 | 25.8 ± 5.8 | 26.5 ± 9.5 | 0.44 | 88.7 ± 14.6 | 90.8± 15.6 | 0.53 |
| 25(OH)D level, % | 0.052 | 0.121 | 0.913 | 0.684 | 0.683 | ||||||||||
| <20 ng/mL | 30.7 | 38.5 | 70.5 | 63.6 | 48.7 | 46.6 | 38.4 | 33.0 | 59.1 | 65.9 | |||||
| ≥20-<30 ng/mL | 42.3 | 40.0 | 22.4 | 28.5 | 36.1 | 37.2 | 35.7 | 40.2 | 20.5 | 20.5 | |||||
| 30-65.1 ng/mL | 26.9 | 21.5 | 7.1 | 7.9 | 15.2 | 16.2 | 25.9 | 26.8 | 20.5 | 13.6 | |||||
| 25(OH)D level, median (IQR), ng/mL | 24.2 (18.3-30.5) |
22.6 (17.4-28.5) |
0.02 | 15.8 (11.2-21.5) |
15.9 (11.0-22.8) |
0.45 | 20.3 (16.4-26.3) |
20.3 (14.1-26.9) |
0.67 | 23.6 (16.8-30.4) |
23.9 (18.6-31.6) |
0.66 | 17.5 (12.9-29.1) |
16.3 (12.7-24.5) |
0.65 |
| 25(OH)D level, mean (SD), ng/mL | 25.1 ± 9.7 | 23.6 ± 9.5 | 0.04 | 17.2 ± 8.2 | 17.8 ± 8.9 | 0.33 | 21.5 ± 8.5 | 21.0 ± 8.3 | 0.58 | 24.8 ± 10.0 | 25.1 ± 9.5 | 0.79 | 20.7 ± 10.3 | 19.4 ± 10.1 | 0.55 |
| PTH level, median (IQR), pg/ml | 18.0 (14.0-23.9) |
18.2 (13.5-23.6) |
0.98 | 21.2 (15.2-28.6) |
21.1 (14.2-28.8) |
0.59 | 18.6 (14.5-25.0) |
19.2 (13.9-24.4) |
0.79 | 15.5 (12.2-21.5) |
16.4 (12.6-24.1) |
0.52 | 19.4 (12.7-27.2) |
20.8 (13.3-24.0) |
0.99 |
| PTH level, mean (SD), pg/ml | 19.7 ± 8.9 | 20.1 ± 11.6 | 0.57 | 23.9 ± 14.1 | 23.3 ± 13.0 | 0.53 | 20.8 ± 9.5 | 20.4 ± 8.4 | 0.61 | 18.2 ± 9.2 | 18.9 ± 9.6 | 0.72 | 21.7 ± 12.5 | 23.1 ± 21.8 | 0.71 |
| DBP, mg/dl | 26.0 ± 8.6 | 26.0± 6.2 | 0.92 | 25.7 ± 5.8 | 25.0 ± 8.1 | 0.20 | 25.8 ± 5.8 | 26.5 ± 9.5 | 0.44 | 25.4 ± 6.8 | 24.4 ± 5.5 | 0.23 | 26.1 ±5.2 | 26.2 ± 5.5 | 0.94 |
| 25(OH)D/DBP | 1.06 ± 0.9 | 1.00 ± 0.5 | 0.19 | 0.73 ± 0.4 | 0.74 ± 0.4 | 0.76 | 0.87 ± 0.4 | 0.84 ± 0.4 | 0.52 | 1.02 ± 0.56 | 1.10 ± 0.5 | 0.69 | 0.81± 0.4 | 0.77 ± 0.4 | 0.43 |
Abbreviations: IQR, interquartile range; DBP, vitamin D binding protein.
Characteristics across Categories of 25(OH)D
Among White women, the percentage of those with fair or poor health status was lower with increasing serum concentrations of 25(OH)D, Table 2. Physical function, physical activity, past use of hormone therapy, and calcium intake were higher with increasing concentrations of 25(OH)D while the average body mass index (BMI) and waist circumference were lower. Both the mean and median PTH was lower among women with 25(OH)D ≥30 ng/mL. There was a modest relationship with DBP: women with 25(OH)D D ≥30 ng/mL had about a 6% higher DBP than women in the deficient range 25(OH)D <20 ng/mL.
Table 2.
Baseline Characteristics Across Categories of 25(OH)D Within Each Ethnic Group b
| White | Black | Hispanic | ||||||||||
|---|---|---|---|---|---|---|---|---|---|---|---|---|
| (<20 ng/mL) (n=270) |
(20-<30 ng/mL) (n=321) |
(30-65.1 ng/mL) (n=189) |
P-trend b | (<20 ng/mL) (n=508) |
(≤20-<30 ng/mL) (n=193) |
(30-65.1 ng/mL) (n=57) |
P-trend b | (<20 ng/mL) (n=182) |
(20-<30 ng/mL) (n=140) |
(30-65.1 ng/mL) (n=60) |
P-trend b | |
| Age, mean (SD), yrs | 66.5 ± 7.1 | 66.2 ± 7.4 | 65.8 ± 7.7 | 0.310 | 62.4 ± 7.6 | 63.5 ± 8.0 | 62.0 ± 8.1 | 0.51 | 63.5 ± 7.5 | 62.1 ± 7.3 | 62.5 ± 7.3 | 0.16 |
| Health status, Fair to poor, % | 10.6 | 5.1 | 4.3 | <0.001 | 24.2 | 21.9 | 19.2 | 0.99 | 25.9 | 31.3 | 24.5 | 0.47 |
| Parental history of fracture, % yes | 43.0 | 42.1 | 41.3 | 0.714 | 18.7 | 22.3 | 21.1 | 0.307 | 36.8 | 29.3 | 23.3 | 0.035 |
| RAND 36 – Physical Functioning Score >90, % |
30.4 | 38.4 | 42.1 | 0.009 | 28.1 | 26.3 | 38.5 | 0.37 | 31.3 | 32.0 | 38.8 | 0.40 |
| Physical activity, median (range), METs/wk |
6.5 (1.5-17.0) |
9.4 (3.5-18.4) |
10.6 (4.8-23.3) |
<0.001 | 5.0 (1.3-13.3) |
7.3 (1.3-16.5) |
7.6 (1.0-21.0) |
0.04 | 5.4 (1.0-12.4) |
10.0 (2.5-18.3) |
10.5 (2.3-22.3) |
0.001 |
| Hormone therapy use, past, % | 22.8 | 26.0 | 34.6 | 0.007 | 18.8 | 18.4 | 20.0 | 0.92 | 19.1 | 23.5 | 16.0 | 0.99 |
| BMI, mean (SD), kg/m2 | 29.1 ± 6.5 | 27.2 ± 5.2 | 25.6 ± 4.3 | <0.001 | 30.9 ± 6.8 | 29.6 ± 5.6 | 29.6 ± 6.7 | 0.03 | 29.4 ± 6.6 | 28.5 ± 7.1 | 28.7 ± 5.2 | 0.29 |
| Waist circumference, cm | 89.4 ± 14.1 | 84.9 ± 12.3 | 81.5 ± 11.0 | <0.001 | 92.1 ± 14.3 | 90.2 ± 13.2 | 86.7 ± 13.3 | 0.003 | 88.7 ± 13.0 | 85.7 ± 12.5 | 86.7 ± 13.5 | 0.12 |
| Total calcium intake a, median (IQR), mg/day |
697.4 (479-1025) |
784.9 (563 -1107) |
757.6 (522-1071) |
0.097 | 482.4 (300-777) |
550.2 (363-813) |
637.9 (293-1166) |
0.02 | 615.8 (397-863) |
645.6 (443-985) |
597.5 (388-909) |
0.51 |
| PTH, median (IQR), pg/ml | 20.6 (15.4-26.5) |
17.3 (13.5-23.3) |
16.4 (12.8-20.7) |
<0.001 | 22.1 (15.8-30.3) |
20.1 (13.9-26.4) |
15.9 (12.3-24.4) |
<0.001 | 20.1 (15.3-25.4) |
18.1 (13.2-24.1) |
18.8 (12.6-24.4) |
0.06 |
| PTH, mean (SD), pg/ml | 22.2 ± 10.0 | 19.1 ± 11.2 | 18.0 ± 8.5 | <0.001 | 25.0 ± 12.4 | 21.1 ± 10.4 | 20.1 ± 14.0 | <0.001 | 21.4 ± 8.6 | 19.9 ± 9.3 | 19.8 ± 9.1 | 0.13 |
| DBP, mg/dl | 25.3 ± 7.7 | 26.3 ± 7.9 | 26.8 ± 6.4 | 0.029 | 24.9 ± 5.7 | 26.1 ± 9.8 | 26.8 ± 6.5 | 0.001 | 25.0 ± 5.3 | 27.2 ± 10.8 | 27.2± 5.6 | 0.02 |
Abbreviations: IQR, interquartile range; DBP, vitamin D binding protein.
mean ± SD or %
median values reported
statistical tests for linear trend across category of 25(OH)D
Among Black women, the patterns were generally the same, although the associations were not consistently statistically significant. Physical activity and calcium intake were higher with increasing 25(OH)D while BMI and waist circumference were lower. The mean and median PTH decreased and DBP increased, with increasing 25(OH)D.
We saw similar patterns of higher 25(OH)D with higher physical activity among Hispanic women. Of note, there was little evidence of an association between BMI and 25(OH)D in Hispanic women although the average waist circumference tended to be lower with higher 25(OH)D, p=0.12. A higher proportion of Hispanic women with 25(OH)D levels < 20 ng/ml reported a parental history of fracture. PTH tended to decrease with increasing 25(OH)D although it was borderline significant; DBP increased with increasing 25(OH)D.
For Asian women, the patterns were similar for physical activity, past use of hormone therapy, BMI, waist circumference, PTH and DBP. Among American Indian women, the patterns were similar although they were not consistently significant.
25(OH)D and Fracture Risks
Among Whites, the mean and median 25(OH)D was lower among women with a fracture compared to controls, Table 1. About 39% of fracture cases had vitamin D levels <20 ng/mL compared to 31% of controls. Among the other race/ethnic groups, the mean, median or distribution of 25(OH)D did not differ between cases and controls, Table 1. The proportion of women with vitamin D levels <20 ng/mL was greatest among Blacks and American Indians; approximately 60% of these women had 25(OH)D levels <20 ng/mL. The mean or median PTH did not differ by case control status in any ethnic group, Table 1. Black women tended to have the highest PTH levels and Asian women, the lowest. There was also no difference in DBP by case/control status in any ethnic group and levels were similar across ethnicity. Of interest, the ratio of 25(OH)D to DBP differed significantly across ethnic group (p<0.001). The ratio was approximately 1.0 in White and Asian women but was much lower in Blacks, Hispanics and American Indians. Within ethnic group, there was no difference in this ratio by case and control status.
The association between 25(OH)D and fractures is summarized in Table 3. White women with higher 25(OH)D (≥30.0 ng/mL) had a reduced risk of fracture (p trend=0.008). In multivariable adjusted models, women with 25(OH)D, (≥30.0-65.1 ng/mL) had 44% lower risk of fracture (OR=0.56; 95% CI, 0.35-0.90) compared to women with vitamin D levels <20 ng/mL. Further adjustment for waist circumference, PTH or DBP had little effect on these results.
Table 3.
Odd Ratio (95% confidence interval) of Fracture across Categories of 25(OH)D within Each Ethnic Group
| Categories of Vitamin D | ||||
|---|---|---|---|---|
| <20 ng/mL | 20<30 ng/mL | ≥30 ng/mL | P trend | |
| Whites | ||||
| Cases (n) | 150 | 156 | 84 | |
| Controls (n) | 120 | 165 | 105 | |
| Models: OR (95% CI) | ||||
| Unadjusted | 1.00 | 0.74 (0.54, 1.02) | 0.57 (0.38, 0.88) | 0.008 |
| MV Adjusted a | 1.00 | 0.82 (0.58, 1.16) | 0.56 (0.35, 0.90) | 0.020 |
| MV + Waist circumference | 1.00 | 0.85 ( 0.60, 1.21) | 0.59 (0.36, 0.95) | 0.038 |
| MV + PTH | 1.00 | 0.81 (0.56, 1.15) | 0.55 (0.34, 0.89) | 0.017 |
| MV + DBP | 1.00 | 0.82 (0.58, 1.16) | 0.55 (0.34, 0.89) | 0.018 |
| Blacks | ||||
| Cases (n) | 241 | 108 | 30 | |
| Controls (n) | 267 | 85 | 27 | |
| Models: OR (95% CI) | ||||
| Unadjusted | 1.00 | 1.37 (0.99, 1.90) | 1.21 (0.69, 2.14) | 0.098 |
| MV Adjusted a | 1.00 | 1.48 (1.05, 2.10) | 1.33 (0.73, 2.43) | 0.043 |
| MV + Waist circumference | 1.00 | 1.49 (1.05, 1.92) | 1.24 (0.70, 2.22) | 0.040 |
| MV + PTH | 1.00 | 1.46 (1.04, 2.10) | 1.34 (0.73, 2.46) | 0.049 |
| MV + DBP | 1.00 | 1.47 (1.04, 2.08) | 1.28 (0.70, 2.34) | 0.059 |
| Hispanics | ||||
| Cases (n) | 89 | 71 | 31 | |
| Controls (n) | 93 | 69 | 29 | |
| Models: OR (95% CI) | ||||
| Unadjusted | 1.00 | 1.08 (0.70, 1.65) | 1.16 (0.59, 2.28) | 0.64 |
| MV Adjusted a | 1.00 | 1.02 (0.69, 1.79) | 1.09 (0.50, 2.37) | 0.72 |
| MV + Waist circumference | 1.00 | 1.14 (0.70, 1.86) | 1.19 (0.54, 2.60) | 0.57 |
| MV + PTH | 1.00 | 1.10 (0.68, 1.79) | 1.08 (0.50, 2.34) | 0.74 |
| MV + DBP | 1.00 | 1.08 (0.66, 1.75) | 1.05 (0.48, 2.30) | 0.82 |
| Asians | ||||
| Cases (n) | 37 | 45 | 30 | |
| Controls (n) | 43 | 40 | 29 | |
| Models: OR (95% CI) | ||||
| Unadjusted | 1.00 | 1.33 (0.71, 2.50) | 1.28 (0.58, 2.82) | 0.49 |
| MV Adjusted a | 1.00 | 1.49 (0.76, 2.93) | 1.66 (0.68, 4.02) | 0.22 |
| MV + Waist circumference | 1.00 | 1.41 (0.71, 2.79) | 1.58 (0.65, 3.86) | 0.28 |
| MV + PTH | 1.00 | 1.58 (0.79, 3.150 | 1.81 (0.72, 4.53) | 0.17 |
| MV + DBP | 1.00 | 1.77 (0.88, 3.60) | 2.78 (0.99, 7.80) | 0.04 |
| American Indians | ||||
| Cases (n) | 29 | 9 | 6 | |
| Controls (n) | 26 | 9 | 9 | |
| Models: OR (95% CI) | ||||
| Unadjusted | 1.00 | 0.79 (0.23, 2.76) | 0.57 (0.17, 1.94) | 0.37 |
| MV Adjusted a | 1.00 | 0.64 (0.15, 2.79) | 0.43 (0.09, 2.08) | 0.29 |
| MV + Waist circumference | 1.00 | 0.67 (0.15, 3.11) | 0.45 (0.09, 2.23) | 0.33 |
| MV + PTH | 1.00 | 0.61 (0.14, 2.65) | 0.32 (0.06, 1.81) | 0.20 |
| MV + DBP | 1.00 | 0.65 (0.15, 2.79) | 0.43 (0.09, 2.08) | 0.29 |
MV, multivariable model: weight, height physical activity, total calcium intake and history of fracture. Cases and controls matched on age, race/ethnicity and date of blood draw.
In contrast, Black women with higher 25(OH)D levels had a higher risk of fracture (p trend= 0.043). In the multivariable models, the OR of fracture was 1.48 (95% CI, 1.05, 2.10) and 1.33 (95% CI, 0.73-2.43) in women with 25(OH)D (20-<30 ng/mL) and (≥30 ng/mL), respectively, compared to women with 25(OH)D (<20 ng/mL). Black women with a 25(OH)D level ≥20 ng/mL, compared to Black women with circulating 25(OH)D level <20 ng/mL had a statistically significant 45% increased risk of fracture (OR=1.45; 95% CI, 1.06, 1.98). Further adjustment for waist circumference and PTH had little effect on these results. The addition of DBP attenuated the association slightly (p trend=0.059).
There was no association between 25(OH)D and fracture in Hispanic women. American Indian women with 25(OH)D (>20 ng/mL) had a lower risk of fracture than women with 25(OH)D (<20 ng/mL) but this association was not significant.
The risk of fracture tended to increase with increasing 25(OH)D in Asian women, but the results were not significant in multivariable models or after adjusting for waist circumference or PTH. However, adjustment for DBP markedly increased the OR: Asian women with 25(OH)D, (≥30.0 ng/mL) had a 2.78 odds of fracture (95% CI, 0.99-7.80) compared to women with 25(OH)D, (<20 ng/mL). The trend of increasing fracture risk with increasing 25(OH)D was statistically significant in models including DBP.
In the spline analysis, there was no evidence of a threshold in White women, Figure 1. The association was linear across the range of 25(OH)D in this study. For Black women, there was a significant threshold around 17 ng/mL, where the risk of fractures above this level increased with increasing 25(OH)D.
Figure 1.
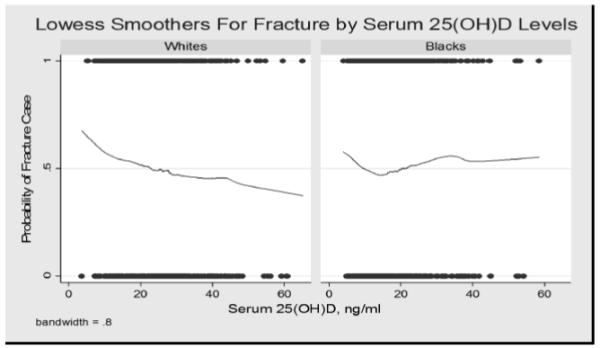
Lowess smoothers for fracture by serum 25(OH)D levels.
PTH
There was no association between PTH and fracture in any ethnic group, Table 4. Further adjustment for 25(OH)D or DBP had no effect on these results.
Table 4.
The association between PTH quartiles and fracture in different ethnic groups*.
| 0.19-14.01 pg/ml (N=574) |
14.02-19.00 pg/ml (N=546) |
19.01-28.85 pg/ml (N=570) |
25.86-141.65 pg/ml (N=542) |
P for Trend |
|
|---|---|---|---|---|---|
| Whites | |||||
| Unadjusted (N=780) | 1.00 | 0.91 (0.62-1.33) | 1.04 (0.70-1.53) | 0.85 (0.56-1.29) | 0.643 |
| MV (N=748)* | 1.00 | 0.89 (0.59-1.33) | 1.04 (0.68-1.59) | 0.75 (0.47-1.19) | 0.393 |
| MV + DBP (N=748) | 1.00 | 0.88 (0.59-1.32) | 1.04 (0.68-1.59) | 0.75 (0.47-1.19) | 0.387 |
| MV + 25(OH)D (N=748) | 1.00 | 0.83 (0.55-1.25) | 0.94 (0.61-1.46) | 0.68 (0.42-1.09) | 0.197 |
| Blacks | |||||
| Models: OR (95% CI) | |||||
| Unadjusted (N=758) | 1.00 | 0.85 (0.55-1.33) | 0.71 (0.46-1.08) | 0.87 (0.58, 1.31) | 0.467 |
| MV (N=700)* | 1.00 | 0.87 (0.54-1.39) | 0.81 (0.51-1.28) | 0.93 (0.60-1.44) | 0.732 |
| MV + DBP (N=698) | 1.00 | 0.85 (0.53-1.37) | 0.80 (0.50-1.26) | 0.94 (0.60-1.46) | 0.785 |
| MV + 25(OH)D (N=700) | 1.00 | 0.89 (0.55-1.43) | 0.84 (0.53-1.32) | 0.98 (0.62-1.53) | 0.924 |
| Hispanics | |||||
| Models: OR (95% CI) | |||||
| Unadjusted (N=382) | 1.00 | 0.84 (0.46-1.54) | 1.05 (0.61-1.82) | 0.83 (0.45-1.56) | 0.888 |
| MV (N=334)* | 1.00 | 0.63 (0.32-1.24) | 0.87 (0.46-1.62) | 0.62 (0.29-1.30) | 0.468 |
| MV + DBP (N=334) | 1.00 | 0.64 (0.33-1.26) | 0.88 (0.47-1.66) | 0.62 (0.30-1.32) | 0.491 |
| MV + 25(OH)D (N=334) | 1.00 | 0.63 (0.32-1.23) | 0.88 (0.47-1.64) | 0.61 (0.29-1.30) | 0.477 |
| Asians | |||||
| Models: OR (95% CI) | |||||
| Unadjusted (N=224) | 1.00 | 0.97 (0.49-1.94) | 1.40 (0.64-3.05) | 1.11 (0.52-2.35) | 0.555 |
| MV (N=218)* | 1.00 | 0.89 (0.43-1.85) | 1.58 (0.69-3.62) | 1.10 (0.50-2.42) | 0.494 |
| MV + DBP N=218) | 1.00 | 0.86 (0.41-1.80) | 1.63 (0.71-3.77) | 1.04 (0.46-2.38) | 0.531 |
| MV + 25(OH)D (N=216) | 1.00 | 0.89 (0.43-1.85) | 1.56 (0.68-3.59) | 1.17 (0.52-2.67) | 0.407 |
| Native Americans | |||||
| Models: OR (95% CI) | |||||
| Unadjusted (N=88) | 1.00 | 0.37 (0.06-2.35) | 2.68 (0.79-9.13) | 0.41 (0.10-1.72) | 0.999 |
| MV (N=86)* | 1.00 | 0.48 (0.60-3.85) | 3.69 (0.87-15.65) | 0.55 (0.12-2.49) | 0.789 |
| MV + DBP (N=86) | 1.00 | 0.51 (0.06-4.52) | 4.15 (0.96-17.95) | 0.55 (0.12-2.48) | 0.769 |
| MV + 25(OH)D (N=86) | 1.00 | 0.41 (0.05-3.52) | 3.36 (0.78-14.45) | 0.48 (0.10-2.35) | 0.867 |
Quartile cutoffs were based on the distribution in the controls. Cases and controls matched on age, race/ethnicity and date of blood draw.
Adjusted for weight, height, physical activity, calcium, and history of fracture which were forced into the model.
DBP
White women with the higher DBP tended to have a lower risk of fracture but the trend was not significant, Table 5. On the other hand, Black women with higher DBP tended to have an increased risk of fracture, in multivariable adjusted models, p trend=0.047. Asian women with higher DBP tended to have a reduced risk of fracture but results were not significant. There was no association between DBP and fracture in Hispanic or American Indian women. There was also no consistent pattern between the ratio of 25(OH)D to DBP and fracture in any group (data not shown).
Table 5.
The association between vitamin D binding protein quartiles and fracture in different ethnic groups*.
| 2.48-21.53 mg/dl (N=560) |
21.54-25.17 mg/dl (N=561) |
25.18-28.99 mg/dl (N=547) |
29.0-54.40 mg/dl (N=564) |
P for Trend |
|
|---|---|---|---|---|---|
| Whites Unadjusted (N=780) MV (N=748)* MV + PTH (N=748) MV + 25(OH)D (N=748) |
1.00 1.00 1.00 1.00 |
1.13 (0.73-1.75) 1.07 (0.63-1.71) 1.07 (0.66-1.72) 1.09 (0.67-1.77) |
0.83 (0.53-1.30) 0.88 (0.50-1.32) 0.81 (0.50-1.32) 0.87 (0.53-1.43) |
0.84 (0.52-1.33) 0.75 (0.45-1.21) 0.75 (0.45-1.25) 0.57 (0.46-1.29) |
0.256 0.159 0.160 0.210 |
| Blacks Unadjusted (N=758) MV (N=700)* MV + PTH (N=698) MV + 25(OH)D (N=700) |
1.00 1.00 1.00 1.00 |
1.14 (0.77-1.17) 1.17 (0.77-1.78) 1.21 (0.79-1.86) 1.17 (0.77-1.79) |
1.05 (0.69-1.61) 1.18 (0.75-1.86) 1.21 (0.77-1.90) 1.17 (0.74-1.83) |
1.50 (0.96-2.35) 1.69 (1.04-2.74) 1.72 (1.05-2.80) 1.67 (1.02-2.68) |
0.119 0.047 0.045 0.062 |
| Hispanics Unadjusted (N=382) MV (N=334)* MV + PTH (N=334) MV + 25(OH)D (N=334) |
1.00 1.00 1.00 1.00 |
0.99 (0.53-1.82) 1.03 (0.51-2.07) 1.03 (0.51-3.30) 1.04 (0.51-2.09) |
1.27 (0.64-2.54) 1.61 (0.72-3.61) 1.57 (0.69-3.56) 1.66 (0.73-3.75) |
1.10 (0.57-2.14) 1.09 (0.52-2.32) 1.10 (0.52-2.32) 1.17 (0.52-2.38) |
0.599 0.580 0.596 0.544 |
| Asians Unadjusted (N=224) MV (N=218)* MV + PTH (N=218) MV + 25(OH)D (N=216) |
1.00 1.00 1.00 1.00 |
0.56 (0.25-1.25) 0.55 (0.24-1.26) 0.55 (0.24-1.22) 0.55 (0.24-1.25) |
0.73 (0.33-1.62) 0.81 (0.35-1.85) 0.81 (0.35-1.85) 0.74 (0.32-1.73) |
0.43 (0.17-1.23) 0.46 (0.18-1.16) 0.45 (0.18-1.85) 0.39 (0.15-1.31) |
0.124 0.185 0.184 0.111 |
| Native Americans Unadjusted (N=88) MV (N=86)* MV + PTH (N=86) MV + 25(OH)D (N=86) |
1.00 1.00 1.00 1.00 |
1.17 (0.30-4.60) 1.46 (0.28-7.57) 1.52 (0.29-8.10) 1.62 (0.31-8.64) |
0.74 (0.20-2.68) 0.85 (0.17-4.29) 0.82 (0.16-4.23) 0.96 (0.18-5.06) |
1.34 (0.29-6.08) 1.97 (0.32-12.02) 1.96 (0.32-11.95) 2.18 (0.34-13.86) |
0.999 0.663 0.685 0.586 |
Quartile cutoffs were based on the distribution in the controls. Cases and controls matched on age, race/ethnicity and date of blood draw.
Adjusted for weight, height, physical activity, calcium, and history of fracture which were forced into the model.
DISCUSSION
In our prospective nested case-control study, we found that White women with 25(OH)D levels between 30.0 - 65.1 ng/mL at study entry had a significantly reduced risk for fracture during the next 8 years compared to women with the lowest 25(OH)D levels (<20 ng/mL). The overall trend between increasing 25(OH)D and lower risk of fracture was statistically significant with no evidence of threshold. This association was independent of many factors including body weight, total calcium intake, waist circumference, parental history of hip fracture, PTH and DBP.
In contrast, among Black women, those with higher 25(OH)D (≥ 20 ng/mL) had an increased risk of fracture. The overall trend between 25(OH)D and increasing fracture was statistically significant in multivariable models adjusting for important covariates identified above. Our spline analyses suggested a significant threshold for Black women at 17 ng/mL, where women with a 25(OH)D above this threshold had a significantly increased risk of fracture.
There was no association between 25(OH)D and fracture among Hispanic women. Results in Asian women were similar to the results among Black women where higher values of 25(OH)D were associated with an increased risk of fracture but these results were not statistically significant until we adjusted for DBP.
For American Indian women, higher levels of 25(OH)D were associated with a lower risk of fracture but these results were not significant, probably reflecting low power since we were limited to 44 fracture cases and controls and only about one-third of both cases and controls had a 25(OH)D level above 20 ng/mL.
Our results in White women are consistent with our previous study of 25(OH)D and hip fracture in the WHI where low levels of 25(OH)D were associated with an increased risk of hip fracture 1. In the current analysis, we were unable to examine hip fracture because there were few hip fractures among the ethnic minority groups (Blacks, n=16; Hispanics, n=4; Asians, n=4; and American Indians, n=3). Nevertheless, our findings extend the protective association of 25(OH)D to include not only hip fractures but all non-spine fractures at least in White women. In the Osteoporotic Fractures in Older Men study, we found a protective association between 25(OH)D and hip fracture but there was no association between 25(OH)D and all non-spine fractures in men 20. To our knowledge, only one previous study examined the association between 25(OH)D and all fractures and found no association 21. However, they did not stratify by gender and hence, it’s possible that the association been 25(OH)D and non-hip fractures may differ in men and women.
The target range for 25(OH)D has been proposed to be at 30 ng/mL or higher 22 by some experts although the recent Institute of Medicine (IOM) report noted that a level ≥20 ng/mL is needed for bone health in most individuals 23. Our findings, consistent with our previous reports on hip fracture in predominately White women 1 and men 20, suggest that it is only individuals with 25(OH)D < 20 ng/mL who have an increased risk of fracture. Thus, our findings, at least in White women, are consistent with the current recommendations by the IOM.
The results in Black women are divergent from those in White women and need replication in other cohorts of Black women. If our results are confirmed, then it suggests that “optimal” 25(OH)D levels may differ by race/ethnic group. Previously, it was thought that the lower risk of osteoporotic fracture among Blacks despite their lower serum 25(OH)D was a paradox 24. Our results suggest this may indeed not be a paradox but a rather a contributing factor for their lower risk of fractures. The threshold for optimal 25(OH)D among Blacks may be lower than in Whites. If true, then clinical interventions to correct 25(OH)D in Blacks for fracture prevention may not be appropriate and may even be counterproductive. It is also interesting to note that other investigators found a different relationship between 25(OH)D and diabetes in Blacks 4. Finally, lower (<20 ng/ml) and higher (≥ 30 ng/ml) levels of 25(OH)D among older White women were both associated with higher odds of frailty 25. It is possible that race/ethnic differences in frailty could have contributed to our differential findings in Whites and Blacks. However, although physical functioning score was lower in Blacks than Whites, there was no evidence that it differed by case/control status or across 25(OH)D levels in Blacks. Further adjustment for physical function had no effect on our results.
On the other hand, if our results are not confirmed, what else might account for our findings in Black women? We considered selection bias: Black women in WHI with higher 25(OH)D have different characteristics than Black women with low 25(OH)D. For example, Black women with 25(OH)D ≥30 ng/mL reported higher physical activity levels, weighed on average 4 kg lower and reported a total daily calcium intake 160 mg higher than Black women with 25(OH)D <20 ng/mL. However, we adjusted for all of these factors in our models. But, inherent to observational studies such as ours, unmeasured factors may have caused residual confounding and could have contributed to our findings.
We relied primarily on self-report of fractures and Black race was previously shown to be a predictor of unconfirmed self-reported fractures 13. It’s possible that there may have been under ascertainment of fractures in women with lower 25(OH)D levels. But there is no evidence to suggest that ascertainment differed across 25(OH)D levels. We found the expected associations between self-reported fractures with established risk factors for fracture including history of smoking, diabetes and personal history of fracture suggesting that self-report of fracture is reasonably accurate in Black women.
Estimates of European ancestry in African Americans range from 20-25% 26,27. Significant associations have been reported between the proportion of European ancestry and bone mineral density (BMD) 26. Blacks with a higher proportion of European ancestry have lower BMD. Thus, it’s possible that the Black women in our study with higher 25(OH)D levels have a greater degree of European admixture which account for both for their higher 25(OH)D and their higher risk of fracture. There could also be other genetic factors that contribute to this finding.
Results among Asian women were similar to the Black women where Asian women with higher 25(OH)D levels had a higher risk of fracture but this association was not statistically significant until we adjusted for DBP. This is a bit surprising since we found no difference in DBP by case control status in any ethnic group. Furthermore, the 25(OH)D/DBP ratio was about 1.0 in Asians, similar to the ratio among White women suggesting no excess of DBP among these women groups.
We found no associations between PTH and fracture in any ethnic group. This result is consistent with a recent meta-analysis of 905 hip fractures cases and 924 controls from population-based case-control studies 28. In our study, PTH levels were within the normal range and there may be no association with fracture within this normal range. Only 5% of women had clinically elevated levels of PTH limiting our power to see an association among these women.
Our study has several limitations. Although we matched each case to a control whose blood draw date was within 90 days, seasonal variability in 25(OH)D concentrations may have confounded our results. We could not test whether the association between low 25(OH)D and fracture was independent of bone mineral density because only 3 WHI clinics measured BMD. Our study included few women with 25(OH)D concentrations greater than 30 ng/mL, so we could not test whether even higher concentrations influences fracture risk. Finally, although we included all clinical fracture cases in the minority groups, we had limited power in Asians, Hispanics and American Indians.
There are also a number of strengths to our study. Most previous studies of ethnic differences compared a single ethnic/race group with Whites. We studied a large, racially diverse sample of well characterized women from 5 different race/ethnic groups. We matched on age, race/ethnicity and blood draw date. We adjusted for a comprehensive set of risk factors including clinical factors found to be associated with fractures and 25(OH)D in each ethnic group 20. We also adjusted for PTH and DBP.
In conclusion, our results suggest divergent relationships between 25(OH)D and fracture by race/ethnicity. Higher levels of 25(OH)D were associated with a reduced risk of fracture among White women but an increased risk among Black women. Further research to confirm and elucidate the basis of these findings could enhance our understanding of ethnic differences in fracture. Our results suggest that the optimal level of 25(OH)D for skeletal health may differ in White and Black women.
Acknowledgments
The WHI program is funded by the National Heart, Lung and Blood Institute, National Institutes of Health, US Department of Health and Human Services, through, through contracts N01WH22110, 24152, 32100-2, 32105-6, 32108-9, 32111-13, 32115, 32118-32119, 32122, 42107-26, 42129-32, and 44221. The sponsor played a role in the design and analysis of the WHI. Additional funds were obtained for these assays and analysis under contract N01-WHI-7-4318.
Footnotes
Conflict of interest:
Dr. Cauley has received research support and consulting fees from Novartis Pharmaceuticals.
Dr. Bauer has received research support from Novartis, Amgen, and Merck.
Dr. JoAnn E. Manson and colleagues at Brigham and Women’s Hospital, Harvard Medical School, are recipients of funding from the National Institutes of Health to conduct the VITamin D and OmegA-3 TriaL (VITAL), a large-scale randomized trial of vitamin D and omega-3s in the prevention of cancer and cardiovascular disease.
Drs. Danielson, Boudreau, Barbour, Horwitz, Ensrud, Jackson, Shikany and Wactawski-Wende have no conflicts to report.
References
- 1.Cauley JA, Lacroix AZ, Wu L, et al. Serum 25-hydroxyvitamin D concentrations and risk for hip fractures. Ann Intern Med. 2008;149:242–50. doi: 10.7326/0003-4819-149-4-200808190-00005. [DOI] [PMC free article] [PubMed] [Google Scholar]
- 2.Nesby-O’Dell S, Scanlon KS, Cogswell ME, et al. Hypovitaminosis D prevalence and determinants among African American and white women of reproductive age: third National Health and Nutrition Examination Survey, 1988-1994. Am J Clin Nutr. 2002;76:187–92. doi: 10.1093/ajcn/76.1.187. [DOI] [PubMed] [Google Scholar]
- 3.Holick MF, Siris ES, Binkley N, et al. Prevalence of Vitamin D inadequacy among postmenopausal North American women receiving osteoporosis therapy. J Clin Endocrinol Metab. 2005;90:3215–24. doi: 10.1210/jc.2004-2364. [DOI] [PubMed] [Google Scholar]
- 4.Scragg R, Sowers M, Bell C. Serum 25-hydroxyvitamin D, diabetes, and ethnicity in the Third National Health and Nutrition Examination Survey. Diabetes Care. 2004;27:2813–8. doi: 10.2337/diacare.27.12.2813. [DOI] [PubMed] [Google Scholar]
- 5.Gordon CM, DePeter KC, Feldman HA, Grace E, Emans SJ. Prevalence of vitamin D deficiency among healthy adolescents. Arch Pediatr Adolesc Med. 2004;158:531–7. doi: 10.1001/archpedi.158.6.531. [DOI] [PubMed] [Google Scholar]
- 6.Fuleihan GE, Gundberg CM, Gleason R, et al. Racial differences in parathyroid hormone dynamics. J Clin Endocrinol Metab. 1994;79:1642–7. doi: 10.1210/jcem.79.6.7989469. [DOI] [PubMed] [Google Scholar]
- 7.Cosman F, Morgan D, Nieves J, et al. Resistance to bone resorbing effects of PTH in black women. J Bone Miner Res. 1997;12:958–66. doi: 10.1359/jbmr.1997.12.6.958. [DOI] [PubMed] [Google Scholar]
- 8.White P, Cooke N. The multifunctional properties and characteristics of vitamin D-binding protein. Trends Endocrinol Metab. 2000;11:320–7. doi: 10.1016/s1043-2760(00)00317-9. [DOI] [PubMed] [Google Scholar]
- 9.Bouillon R, Van Assche FA, Van Baelen H, Heyns W, De Moor P. Influence of the vitamin D-binding protein on the serum concentration of 1,25-dihydroxyvitamin D3. Significance of the free 1,25-dihydroxyvitamin D3 concentration. J Clin Invest. 1981;67:589–96. doi: 10.1172/JCI110072. [DOI] [PMC free article] [PubMed] [Google Scholar]
- 10.Fang Y, van Meurs JB, Arp P, et al. Vitamin D binding protein genotype and osteoporosis. Calcif Tissue Int. 2009;85:85–93. doi: 10.1007/s00223-009-9251-9. [DOI] [PMC free article] [PubMed] [Google Scholar]
- 11.Hays J, Hunt JR, Hubbell FA, et al. The Women’s Health Initiative recruitment methods and results. Ann Epidemiol. 2003;13:S18–77. doi: 10.1016/s1047-2797(03)00042-5. [DOI] [PubMed] [Google Scholar]
- 12.Curb JD, McTiernan A, Heckbert SR, et al. Outcomes ascertainment and adjudication methods in the Women’s Health Initiative. Ann Epidemiol. 2003;13:S122–8. doi: 10.1016/s1047-2797(03)00048-6. [DOI] [PubMed] [Google Scholar]
- 13.Chen Z, Kooperberg C, Pettinger MB, et al. Validity of self-report for fractures among a multiethnic cohort of postmenopausal women: results from the Women’s Health Initiative observational study and clinical trials. Menopause. 2004;11:264–74. doi: 10.1097/01.gme.0000094210.15096.fd. [DOI] [PubMed] [Google Scholar]
- 14.Anderson GL, Manson J, Wallace R, et al. Implementation of the Women’s Health Initiative study design. Ann Epidemiol. 2003;13:S5–17. doi: 10.1016/s1047-2797(03)00043-7. [DOI] [PubMed] [Google Scholar]
- 15.Patterson RE, Kristal AR, Tinker LF, Carter RA, Bolton MP, Agurs-Collins T. Measurement characteristics of the Women’s Health Initiative food frequency questionnaire. Ann Epidemiol. 1999;9:178–87. doi: 10.1016/s1047-2797(98)00055-6. [DOI] [PubMed] [Google Scholar]
- 16.Manson JE, Greenland P, LaCroix AZ, et al. Walking compared with vigorous exercise for the prevention of cardiovascular events in women. N Engl J Med. 2002;347:716–25. doi: 10.1056/NEJMoa021067. [DOI] [PubMed] [Google Scholar]
- 17.Hays RD, Sherbourne CD, Mazel RM. The RAND 36-Item Health Survey 1.0. Health Econ. 1993;2:217–27. doi: 10.1002/hec.4730020305. [DOI] [PubMed] [Google Scholar]
- 18.Holick MF. Vitamin D deficiency. N Engl J Med. 2007;357:266–81. doi: 10.1056/NEJMra070553. [DOI] [PubMed] [Google Scholar]
- 19.Scantibodies- Laboratory Inc. Scantibodies Insert SK1086 Vs 08. 2007. Whole PTH (1-84) Specific Assay Package Insert. [Google Scholar]
- 20.Cauley JA, Wu L, Wampler NS, et al. Clinical risk factors for fractures in multi-ethnic women: The Women’s Health Initiative. J Bone Miner Res. 2007;22:1816–26. doi: 10.1359/jbmr.070713. [DOI] [PubMed] [Google Scholar]
- 21.Roddam AW, Neale R, Appleby P, Allen NE, Tipper S, Key TJ. Association between plasma 25-hydroxyvitamin D levels and fracture risk: the EPIC-Oxford study. Am J Epidemiol. 2007;166:1327–36. doi: 10.1093/aje/kwm210. [DOI] [PubMed] [Google Scholar]
- 22.Dawson-Hughes B, Mithal A, Bonjour JP, et al. IOF position statement: vitamin D recommendations for older adults. Osteoporos Int. 2010;21:1151–4. doi: 10.1007/s00198-010-1285-3. [DOI] [PubMed] [Google Scholar]
- 23.Institute of Medicine (US) Dietary Reference Intakes for Calcium and Vitamin D Consensus Report. National Academy Press; Washington DC: [Accessed 1/10/2011; 2010]. 2010. Standing Committee on the Scientific Evaluation of Dietary Reference Intakes. http://www.iom.edu/Reports/2010/Dietary-Reference-Intakes-for-Calcium-and-Vitamin-D.aspx. [Google Scholar]
- 24.Aloia JF. African Americans, 25-hydroxyvitamin D, and osteoporosis: a paradox. Am J Clin Nutr. 2008;88:545S–50S. doi: 10.1093/ajcn/88.2.545S. [DOI] [PMC free article] [PubMed] [Google Scholar]
- 25.Ensrud KE, Ewing SK, Fredman L, et al. Circulating 25-hydroxyvitamin D levels and frailty status in older women. J Clin Endocrinol Metab. 2010;95:5266–73. doi: 10.1210/jc.2010-2317. [DOI] [PMC free article] [PubMed] [Google Scholar]
- 26.Shaffer JR, Kammerer CM, Reich D, et al. Genetic markers for ancestry are correlated with body composition traits in older African Americans. Osteoporos Int. 2007;18:733–41. doi: 10.1007/s00198-006-0316-6. [DOI] [PubMed] [Google Scholar]
- 27.Reiner AP, Ziv E, Lind DL, et al. Population structure, admixture, and aging-related phenotypes in African American adults: the Cardiovascular Health Study. Am J Hum Genet. 2005;76:463–77. doi: 10.1086/428654. [DOI] [PMC free article] [PubMed] [Google Scholar]
- 28.Lai JK, Lucas RM, Clements MS, Roddam AW, Banks E. Hip fracture risk in relation to vitamin D supplementation and serum 25-hydroxyvitamin D levels: a systematic review and meta-analysis of randomised controlled trials and observational studies. BMC Public Health. 2010;10:331. doi: 10.1186/1471-2458-10-331. [DOI] [PMC free article] [PubMed] [Google Scholar]