

Abstract
Chronic kidney disease (CKD) is associated with increased fracture risk and skeletal deformities. The impact of CKD on volumetric bone mineral density (BMD) and cortical dimensions during growth is unknown. Tibia quantitative computed tomography scans were obtained in 156 children with CKD [69 stage 2–3, 51 stage 4–5, and 36 stage 5D (dialysis)] and 831 healthy participants, ages 5–21 years. Sex-, race-, and age- or tibia length-specific Z-scores were generated for trabecular BMD (TrabBMD), cortical BMD (CortBMD), cortical area (CortArea) and endosteal circumference (EndoC). Greater CKD severity was associated with higher TrabBMD-Z in younger participants (p < 0.001), compared with healthy children; this association was attenuated in older participants (interaction p < 0.001). Mean CortArea-Z was lower (p < 0.01) in CKD 4–5 [−0.49 (95% C.I. −0.80, −0.18)] and 5D [−0.49 (−0.83, −0.15)], compared with healthy children. Among CKD participants, parathyroid hormone (PTH) levels were positively associated with TrabBMD-Z (p < 0.01), and this association was significantly attenuated in older participants (interaction p < 0.05). Higher levels of PTH and biomarkers of bone formation (bone-specific alkaline phosphatase) and resorption (β-CTX) were associated with lower CortBMD-Z and CortArea-Z, and greater EndoC-Z (r = 0.18–0.36; all p ≤ 0.02). CortBMD-Z was significantly lower in CKD participants with PTH levels above vs. below the upper limit of the KDOQI CKD stage-specific target range: −0.46 ± 1.29 vs. 0.12 ± 1.14, p < 0.01. In summary, childhood CKD and secondary hyperparathyroidism were associated with significant reductions in cortical area and CortBMD, and greater TrabBMD in younger children. Future studies are needed to establish the fracture implications of these alterations and to determine if cortical and trabecular abnormalities are reversible.
Keywords: pediatrics, bone quantitative computed tomography, parathyroid hormone, chronic kidney disease
INTRODUCTION
During childhood and adolescence, skeletal development is characterized by sex- and maturation-specific increases in trabecular and cortical bone mineral density (BMD) and cortical dimensions.(1,2) Children with chronic kidney disease (CKD) have numerous risk factors for impaired bone acquisition, including growth failure, delayed puberty, metabolic acidosis, vitamin D deficiency, muscle deficits, and secondary hyperparathyroidism. In adults, CKD has been associated with higher and lower trabecular BMD, lower cortical BMD, smaller cortical thickness, and higher risk of fractures.(3–7) However, the impact of CKD on trabecular and cortical BMD and cortical dimensions during growth and development has not been established.
The majority of prior pediatric studies of BMD in CKD relied on dual energy x-ray absorptiometry (DXA). DXA is a projection technique that summarizes total bone mass within the projected bone area, resulting in two important limitations in childhood CKD. First, trabecular and cortical bone mineral content (BMC) are superimposed, potentially concealing the opposing effects of elevated parathyroid hormone (PTH) levels to increase and decrease trabecular and cortical BMC, respectively.(8) Second, DXA provides a two-dimensional measure of areal BMD (g/cm2) that systematically underestimates volumetric BMD (g/cm3) in children with poor growth.(9) This effect was illustrated in a study of pediatric renal transplant recipients: areal BMD Z-scores relative to chronological age were one to two standard deviations lower than areal BMD Z-scores relative to height age.(10) Accordingly, prior DXA studies in children with CKD yielded variable and inconsistent results, reporting decreased,(11–16) normal,(17–20) or increased(15,20–22) areal BMD, compared with controls.
Peripheral quantitative computed tomography (pQCT) is a three-dimensional technique that distinguishes between cortical and trabecular bone, measures volumetric BMD and cortical bone dimensions, and estimates bone strength. Among adults on hemodialysis, pQCT measures of cortical volumetric BMD and thickness provided significantly greater fracture discrimination compared with DXA measures of hip or spine areal BMD.(23) Prior pediatric pQCT studies in CKD were limited by small sample sizes, heterogeneous samples (including transplant recipients), and insufficient reference data to adjust for differences in age, sex, and body size.(24–29) Most reported increased trabecular volumetric BMD in CKD, few assessed cortical BMD, and the two studies of cortical dimensions were limited to prevalent transplant recipients.(24,27)
We hypothesized that secondary hyperparathyroidism in CKD would be associated with greater trabecular BMD, lower cortical BMD and smaller cortical bone area. We also hypothesized that muscle deficits would be associated with smaller cortical bone area. Therefore, the objectives of this study were (1) to assess trabecular and cortical volumetric BMD and cortical dimensions using pQCT in children and adolescents with mild to severe CKD, compared with a reference sample of healthy children and adolescents, and (2) to identify correlates of bone deficits in CKD, including PTH levels, biomarkers of bone turnover, and muscle deficits.
MATERIALS AND METHODS
Study Participants
The study population included 156 children and adolescents ages 5 to 21 years with CKD; 104 were enrolled at the Children’s Hospital of Philadelphia (CHOP) and 52 at Cincinnati Children’s Hospital Medical Center (CCHMC). Participants were eligible if they had an estimated glomerular filtration rate (eGFR)less than 90 ml/min/1.73 m2. Subjects were excluded for a history of diseases known to affect bone health, including neuromuscular disease, inflammatory bowel disease, malignancy, or prior renal, cardiac or liver transplantation. We recently reported that greater CKD severity was associated with significantly greater muscle deficits (as measured by whole body DXA and tibia pQCT) in these participants, compared with the healthy reference sample.(30)
Participants with CKD were compared to a reference group of 831 healthy children and adolescents (762 at CHOP, 69 at CCHMC). The reference group was recruited from general pediatrics practices in the greater Philadelphia and Cincinnati areas, and through advertisements. Reference participants were ineligible if they had a history of illnesses or medications that may affect growth, nutritional status, pubertal development, or bone accrual. Race, sex, and pubertal differences in pQCT measures of cortical BMD, cortical dimensions, and muscle area were recently reported in the CHOP reference participants.(1)
The study protocol was approved by the Institutional Review Boards at CHOP and CCHMC. Informed consent was obtained directly from study participants older than 18 years, and assent along with parental consent from participants less than 18 years of age.
Anthropometry, Physical Maturity, and Race
Height was measured with a stadiometer (Holtain Ltd.) and weight with a digital scale (Scale Tronix, Inc.). Tibia length was measured with a segmometer from the distal margin of the medial malleolus to the proximal border of the medial tibia condyle. Pubertal development stage was determined using a validated self-assessment questionnaire and classified according to the method of Tanner.(31,32) Study participants and their parents were asked to categorize the participant’s race according to the National Institute of Health categories.
CKD Disease Characteristics and Medications
Medical charts were reviewed for underlying renal disease, date of CKD diagnosis, current and prior medications, fracture history, and dialysis duration and modality. Participants and parents were interviewed at the study visit to review the medical history and obtain additional details regarding any fracture events. The underlying renal disease was categorized as congenital anomalies of the kidney and urinary tract (CAKUT), including aplasia/hypoplasia/dysplasia, obstructive uropathy, and reflux nephropathy; focal segmental glomerulosclerosis (FSGS); systemic inflammatory disease (systemic lupus erythematosis and Wegener’s granulomatosis); and other (cystinosis, renal ischemia, hemolytic uremic syndrome, tubulointerstitial nephritis, membranoproliferative glomerulonephritis Type I – III, idiopathic crescentic glomerulonephritis, membranous nephropathy, Alports syndrome, and IgA nephropathy).
Peripheral Quantitative Computed Tomography
Bone, muscle and fat measures in the left tibia were obtained by pQCT (Stratec XCT2000 12-detector unit, Orthometrix, Inc.) with a voxel size of 0.4 mm, slice thickness of 2.3 mm, and scan speed of 25 mm/sec. All scans were analyzed with Stratec software version 5.50 at CHOP. A scout view was obtained to place the reference line at the proximal border of the distal tibia growth plate in participants with open growth plates and at the proximal border of the distal endplate in participants with fused growth plates. The bone measurements were obtained at 3% and 38% of tibia length proximal to the reference line. At the 3% metaphyseal site, scans were analyzed for trabecular volumetric BMD (mg/cm3). At the 38% diaphyseal site, scans were analyzed for cortical volumetric BMD (mg/cm3), periosteal circumference (mm), endosteal circumference (mm), and cortical cross-sectional area (mm2). Muscle and fat area (mm3) were assessed at a site 66% proximal to the distal physis. The manufacturer’s hydroxyapatite phantom was scanned daily for quality assurance. In our laboratory, the coefficient of variation (CV) for short-term precision ranged from 0.5 to 1.6% for pQCT outcomes in children and adolescents.
Partial volume effects may result in an underestimate of cortical volumetric BMD in bones with a thin cortex, such as in children or disorders characterized by cortical thinning. The 38% tibia site was used in this study, as opposed to the radius or a more distal tibia site, to minimize these effects, as the cortex is thicker at this site. A prior study based on phantom measurements suggested that accurate results for cortical volumetric BMD can be obtained at cortical thickness greater than 2 mm.(33) None of the CKD or reference participants reported in this manuscript had a cortical thickness less than 2 mm.
A single European Forearm Phantom was scanned on the pQCT devices at CHOP and CCHMC. Only cortical BMD differed significantly between devices: cortical BMD was 0.06% greater at CHOP. A correction based on linear regression was applied to the CCHMC cortical BMD results to adjust for site differences.
Laboratory Studies
Non-fasting blood samples were collected during the study visit in CKD participants and the healthy reference group. The timing of specimen collection was not standardized. Serum creatinine and bicarbonate were measured in CKD participants only. Serum creatinine (mg/dl) was measured by spectrophotometric enzymatic assay (Vitros, Johnson & Johnson Co.) with a CV of 1–5%. Estimated GFR (eGFR, ml/min/1.73 m2) was calculated from height and serum creatinine using the pediatric estimating equations recently reported by the Prospective Cohort Study of Kidney Disease in Children.(34) Participants were categorized into CKD stages according to the National Kidney Foundation definitions:(35) CKD stage 2 = eGFR 60 to 89 (n = 15); CKD stage 3 = eGFR 30 to 59 (n = 54); CKD stage 4 = eGFR 15 to 29 (n = 31); CKD stage 5 = eGFR < 15 (n = 20); and CKD 5D = maintenance dialysis (n = 36). Serum bicarbonate (mmol/L) was measured by reflectance spectrophotometry with a CV of 3–8%.
Plasma PTH was quantified by radioimmunoassay with 125I-labeled antibody (Scantibodies Clinical Laboratory). This assay generates measures of intact PTH (iPTH) and the bioactive 1–84 PTH molecule. The intra-assay CV for iPTH was 3–5%, and for 1–84 PTH was 3–10%.(36) Bone biomarkers were measured at Quest Diagnostics Laboratory: serum bone specific alkaline phosphatase (BSAP, μg/L) was measured as a marker of bone formation using a two-site immunoradiometric assay (CV 8%). Serum C-terminal telopeptide of type I collagen (β-CTX, pg/mL) was measured as a marker of bone resorption using the Roche Cobas E170 electrochemiluminescent assay (CV 5%). The following assays were performed using the same methods in a subset of the CHOP and CCHMC healthy reference participants based on the availability of serum and their inclusion in other concurrent studies of nutrition and bone health. BSAP was performed in all 470 healthy participants that agreed to phlebotomy. Serum β-CTX and PTH levels were available in 250 and 116 healthy participants, respectively.
Statistical Analysis
Stata 11.0 (Stata Corp., College Station, TX) was used for all statistical analyses. A p-value of < 0.05 was considered statistically significant, and two-sided tests of hypotheses were used throughout. Group differences were assessed using Student’s t-test, or the Wilcoxon Rank Sum test if the data were not normally distributed. Correlations between continuous variables were assessed by Pearson product moment correlations or Spearman rank correlations, where appropriate. Differences in proportions were assessed using the chi-square test.
The CKD categories for these analyses were defined as CKD 2–3 (n = 69), CKD 4–5 (n = 51), and CKD 5D (n = 36). Age- and sex-specific height and BMI Z-scores (standard deviation scores) were calculated using National Center for Health Statistics 2000 Center for Disease Control growth data.(37) The pQCT outcomes were converted to Z-scores using the LMS method, as previously described.(38,39) This method accounts for the non-linearity, heteroscedasticity and skew of bone data in growing children.(40) All of the pQCT Z-scores were sex- and race-specific (black versus all others) and were generated using the LMS Chartmaker Program version 2.3 in the healthy reference group from CHOP.(41) The pQCT density outcomes (trabecular and cortical BMD) were assessed relative to age. The pQCT cortical geometry and muscle and fat outcomes were highly correlated with tibia length [cortical area r = 0.88, periosteal circumference r = 0.91, endosteal circumference r = 0.70, muscle area r = 0.83, and fat area r = 0.38; all p < 0.0001]; therefore, the Z-scores for these parameters were generated relative to tibia length. The LMS method does not allow for simultaneous adjustment for age and tibia length. Therefore, the Z-scores generated relative to tibia length were subsequently adjusted for both age and tibia length using linear regression in order to capture the differences in the joint distributions of age and tibia length in children with CKD compared with the reference group.
In order to determine if the associations between cortical volumetric BMD, CKD severity, and PTH levels were confounded by partial volume effects, the cortical BMD models were repeated with adjustment for cortical thickness and in models limited to participants with cortical thickness greater than 3 mm. Cortical thickness was not significant in any of these models and the results were unchanged in these additional analyses (data not shown).
Initial multivariable regression models examined pQCT outcomes in CKD using a dummy variable for the three CKD categories, compared with the reference group. The variability in pQCT BMD Z-score and laboratory outcomes was significantly greater in CKD, compared with the reference group (all p < 0.01). Therefore, the linear regression models included the heteroscedasticity-consistent correction to account for the unequal variances.(42)
A prior pQCT study reported an inverse association between trabecular BMD and age in children on dialysis.(26) To determine if the associations between CKD severity and trabecular BMD Z-scores depended on age, an age-by-CKD stage interaction term was assessed in the regression models. The lincom procedure in Stata was used to estimate the expected difference in trabecular BMD-Z between each CKD stage versus the reference group, for children at several ages. Similar methods were used to determine if associations between trabecular BMD Z-scores and PTH levels differed according to age.
Serum PTH and biomarkers of bone turnover (BSAP and β-CTX) were natural log transformed to achieve normal distributions. Analyses of PTH effects examined both the iPTH and bioactive 1–84 PTH level. Linear regression models were used to compare the PTH and bone turnover biomarker levels in the three CKD groups, compared with the reference group. The analyses of bone biomarker levels and CKD stage were adjusted for age, sex, Tanner stage and a sex by Tanner interaction, as previously described.(43) Advanced CKD may be associated with progressive skeletal resistance to PTH, and the associations between bone Z-scores and PTH levels may not be linear. Therefore, bone Z-scores were compared between participants with iPTH levels above vs. below the upper limits of the Pediatric Kidney Disease Outcome Quality Initiative (KDOQI) CKD stage-specific target ranges:70 pg/mL for CKD stages 2–3, 110 pg/mL for CKD stage 4, and 300 pg/mL for CKD stage 5 and 5D.(44)
Secondary analyses were limited to the 96 CKD participants with CAKUT, compared with the reference group in order to examine the effects of CKD independent of underlying inflammation and immunosuppressive therapies.
RESULTS
Participant and Disease Characteristics
Characteristics of CKD and reference group participants are summarized in Table 1. Overall, pubertal maturation was delayed in CKD: within Tanner stages 2, 3 and 4, CKD participants were significantly older (p < 0.001) than the reference group, adjusted for sex and race. Compared with the reference group, height Z-scores were significantly lower in all CKD groups (all p < 0.0001). The CKD 5D participants had lower BMI Z-scores compared to the reference group (p < 0.05), as previously described.(30)
Table 1.
Characteristics of CKD Participants and the Healthy Reference Group
| Variable | Healthy Reference Group | CKD Stage 2–3 | CKD Stage 4–5 | CKD Stage 5D |
|---|---|---|---|---|
| N | 831 | 69 | 51 | 36 |
| Age, years | 11.9 | 13.2 | 14.1 | 14.9 |
| Median (range) | (5.0 to 21.9) | (5.5 to 20.8) | (5.7 to 20.7) | (6.5 to 20.8) |
| Sex, n (%) Male | 393 (47) | 39 (57) | 36 (71) | 21 (58) |
| Race, n (%) | ||||
| White | 395 (48) | 52 (75) | 36 (71) | 24 (67) |
| Black | 347 (42) | 14 (20) | 13 (25) | 11 (30) |
| Asian | 20 (2) | 0 (0) | 1 (2) | 1 (3) |
| Other | 69 (8) | 3 (4) | 1 (2) | 0 (0) |
| Tanner, n (%) Stage 1–2 | 375 (50) | 28 (41) | 18 (35) | 11 (31) |
| Height Z-score (Range) | 0.29 ± 0.91 (−2.33 to 3.26) | −0.29 ± 1.26 (−3.73 to 2.57) | −1.19 ± 1.34 (−4.87 to 1.54) | −0.97 ± 1.32 (−3.2 to 1.66) |
| BMI Z-score (Range) | 0.37 ± 1.00 (−2.17 to 2.99) | 0.34 ± 1.11 (−2.30 to 2.64) | 0.29 ± 1.26 (−2.36 to 2.56) | 0.02 ± 1.36 (−3.37 to 2.17) |
All values are means ± SD, unless otherwise noted.
CKD characteristics are summarized in Table 2. The interval since CKD diagnosis did not differ significantly across groups. CAKUT accounted for the majority of cases, and FSGS was the second leading cause. The distributions of the underlying renal disease varied across CKD groups. The greater history of glucocorticoid use among the CKD 5D participants was due to the greater proportions with FSGS, systemic inflammatory disease, and primary glomerulonephritis. Current and previous calcitriol use was significantly greater in more advanced CKD.
Table 2.
Disease and Treatment Characteristics of the CKD Participants
| Variable | CKD Stage 2–3 | CKD Stage 4–5 | CKD Stage 5D |
|---|---|---|---|
| Age at Diagnosis, years Median (IQR) | 4.1 (0 to 10.0) | 2.4 (0 to 10.5) | 9.8 (1.2 to 14.1) |
| Interval Since Diagnosis, years Median (IQR) | 7.1 (5.1 to 11.9) | 7.4 (3.0 to 12.3) | 3.0 (1.6 to 11.4) |
| Estimated GFR, ml/min/1.73 m2 Median (IQR) | 47 (39 to 57) | 19 (13 to 26) | |
| On Medication at Visit, n (%) | |||
| Glucocorticoids | 5 (7) | 2 (4) | 5 (14) |
| Recombinant Growth Hormone | 4 (6) | 3 (6) | 5 (14) |
| Calcitriol | 16 (23) | 36 (71) | 29 (81) |
| On Medication Ever, n (%) | |||
| Glucocorticoids | 12 (17) | 9 (18) | 18 (53) |
| Recombinant Growth Hormone | 6 (9) | 15 (29) | 8 (22) |
| Calcitriol | 18 (26) | 39 (76) | 36 (100) |
| Underlying Renal Disease, n (%) | |||
| CAKUT | 49 (71) | 35 (69) | 12 (30) |
| FSGS | 4 (6) | 9 (18) | 15 (38) |
| Systemic Inflammatory | 5 (7) | 1 (2) | 5 (13) |
| Other | 11 (16) | 6 (12) | 8 (20) |
| Duration of Dialysis, months Median (IQR) | ----- | ----- | 5.9 (1.9 to 13.6) |
| Hemodialysis, n (%), vs Peritoneal Dialysis | ----- | ----- | 24 (67) |
IQR: interquartile range
GFR: Glomerular filtration rate
CAKUT: Congenital anomalies of the kidney and urinary tract
FSGS: Focal segmental glomerulosclerosis
Overall, 39 of the 156 CKD participants reported a prior fracture. Of these, 3 reported three fractures, 12 reported two fractures and 24 reported one fracture. Radius and clavicle fractures were most common, accounting for 38 and 15% of fractures, respectively. The majority of the fractures were remote. The median interval since the most recent fracture was 2.9 years, and only 6 of the 39 subjects reported a fracture within the 12 months prior to the study visit. Furthermore, the most recent fracture preceded the diagnosis of CKD in 14 of the 39 participants.
Laboratory Results
Laboratory data are shown in Table 3. Intact PTH, 1–84 PTH, and β-CTX levels were positively associated with greater CKD severity (all p < 0.001); serum BSAP levels were not. Within CKD participants, serum iPTH levels were significantly and positively associated with β-CTX (r = 0.58; p < 0.0001) and BSAP (r = 0.17; p < 0.02) levels. The correlation between iPTH and β-CTX levels was significantly greater (p < 0.0001) than the correlation between iPTH and BSAP levels. The same relations were observed using 1–84 PTH rather than iPTH. Within CKD participants, lower serum bicarbonate levels were associated with greater β-CTX levels (r =−0.23; p < 0.01) but not BSAP levels (r =−0.09; p = 0.27). The significant associations between serum bicarbonate, bone biomarker and PTH levels persisted (all p < 0.01) after adjustment for CKD severity.
Table 3.
Serum Laboratory Results in the Reference Group and CKD Participants
| Healthy Reference Group | CKD Stage 2–3 | CKD Stage 4–5 | CKD Stage 5D | Test for Trend p-value | |
|---|---|---|---|---|---|
| Intact PTH (pg/mL) | 26 (9 to 61) | 42 (2 to 521) | 140 (8 to 770) | 267 (10 to 1139) | < 0.001 |
| 1–84 PTH (pg/mL) | 16 (5 to 35) | 25 (1 to 315) | 77 (4 to 535) | 163 (4 to 587) | < 0.001 |
| β-CTX (pg/mL) | 882 (75 to 3015) | 1690 (382 to 4776) | 3153 (881 to 6001) | 4326 (974 to 6001) | < 0.001* |
| BSAP (μg/L) | 68.3 (2 to 245) | 67.3 (8.6 to 231.2) | 70.7 (15.9 to 264) | 45.9 (11 to 375.2) | 0.76* |
| Bicarbonate (mmol/L)s | ----- | 24 (17 to 30) | 23 (17 to 31) | 24 (17 to 32) | 0.26 |
Data are presented as median (range).
β-CTX: C-terminal telopeptide of type I collagen
BSAP: Bone specific alkaline phosphatase
The analyses for β–CTX and BSAP were adjusted for sex, Tanner stage, and a sex by Tanner stage interaction term. The p-values represent the adjusted analysis while the point estimates are the raw medians.
Trabecular Volumetric BMD Z-Scores
Within the CKD participants, trabecular BMD Z-scores were inversely associated with age overall (r = −0.33, p < 0.001); however, this relation varied according to CKD severity (Figure 1). The inverse association between trabecular BMD Z-score and age was significantly more pronounced among participants with greater CKD severity (test for interaction: p < 0.001). For example, the mean (95% C.I.) trabecular BMD Z-scores in 6, 12 and 18 year old participants in CKD stage 5D (estimated from linear combinations of estimators) were 2.53 (1.60, 3.46), 1.03 (0.56, 1.49), and −0.47 (−0.97, 0.03), respectively. Within CKD stages 4–5 the results were 1.56 (0.86, 2.26), 0.84 (0.50, 1.19), and 0.13 (−0.38, 0.63), respectively. And, within CKD stages 2–3, the results were 0.56 (0.00, .1.12), 0.03 (−0.26, 0.33), and −0.49 (−0.92, −0.06), respectively. Adjustment for Tanner stage did not attenuate CKD effects. When the analyses were limited to CKD participants with CAKUT (i.e. excluding participants with underlying inflammation or glucocorticoid therapy for CKD), the same interactions between age and CKD severity were observed. In the subset of older participants (age > 13 years) with CKD secondary to CAKUT, trabecular BMD Z-scores did not differ compared with the reference group.
Figure 1. Trabecular BMD Z-scores Relative to Age, According to CKD Category.

Trabecular volumetric BMD Z-scores were inversely associated with age in the CKD participants and this relation varied according to CKD category. The inverse association was significantly more pronounced among participants with greater CKD severity (test for interaction: p < 0.001). A: CKD Stage 2–3; B: CKD Stage 4–5; and C: CKD Stage 5D.
In univariate analyses, trabecular BMD Z-scores were not associated with iPTH levels. However, adjustment for age revealed that iPTH levels above the KDOQI target range were associated with significantly greater trabecular BMD Z-scores, compared with iPTH levels below the upper limit (p < 0.01), and this positive association was attenuated in older participants (test for interaction: p < 0.05). For example, the predicted mean (95% C.I.) difference in trabecular BMD Z-scores between participants with iPTH levels above vs. below the upper limit was 1.66 (0.43, 2.89) for age 6 years, 0.78 (0.19, 1.37) for age 12 years, and −0.10 (−0.85, 0.65) for age 18 years. Similar significant results were observed when iPTH or 1–84 PTH level was analyzed as a continuous variable (data not shown).
Trabecular BMD Z-scores were not associated with prior or current recombinant human growth hormone (rhGH) or calcitriol treatment, age at diagnosis, or interval since CKD diagnosis, adjusted for CKD severity category. Concurrent glucocorticoid therapy was not associated with trabecular BMD Z-scores; however, a history of glucocorticoid therapy (current or prior) was associated with significantly lower trabecular BMD Z-scores [−0.69 (95% C.I. −0.30, −0.08), p<0.05], adjusted for CKD severity and age.
Cortical Volumetric BMD Z-Scores
The relations between cortical BMD Z-scores and CKD severity category are shown in Table 4. Compared with the reference group, mean cortical BMD Z-scores were not significantly different for CKD stages 2–3 or 5D, but were significantly lower in CKD stages 4–5. Adjustment for Tanner stage or cortical thickness did not attenuate CKD effects. Similar results were obtained when the analyses were limited to participants with CAKUT.
Table 4.
Cortical Bone, Muscle and Fat Z-scores in CKD Participants, Compared with the Reference Group
| Z-Score | CKD Stage 2–3 (95% C.I.) | p-value | CKD Stage 4–5 (95% C.I.) | p-value | CKD Stage 5D (95% C.I.) | p-value |
|---|---|---|---|---|---|---|
| Cortical BMD | 0.12 (−0.14, 0.38) | 0.35 | −0.43 (−0.73, −0.12) | 0.006 | 0.00 (−0.34, 0.35) | 0.98 |
| Cortical Bone Area | −0.17 (−0.43, 0.10) | 0.21 | −0.49 (−0.80, −0.18) | 0.002 | −0.49 (−0.83, −0.15) | < 0.01 |
| Muscle Area | −0.08 (−0.32, 0.17) | 0.55 | −0.08 (−0.37, 0.20) | 0.56 | −0.88 (−1.20, −0.55) | < 0.001 |
| Fat Area | −0.17 (−0.45, 0.10) | 0.21 | −0.03 (−0.35, 0.28) | 0.84 | −0.40 (−0.76, −0.03) | 0.03 |
The p-values represent significant differences within each CKD severity category, compared to the reference group.
Among the CKD participants, greater 1–84 PTH (r = −0.24, p < 0.01), iPTH (r = −0.22, p <0.01), BSAP (r = −0.18, p < 0.05) and β-CTX (r = −0.19, p < 0.02) levels were associated with lower cortical BMD Z-scores. Each association remained significant adjusted for CKD severity and cortical thickness. The lower mean cortical BMD Z-score observed in CKD stages 4–5, compared with the reference group was no longer significant when adjusted for PTH levels. Figure 2A demonstrates that cortical BMD Z-scores were significantly lower among CKD participants with iPTH levels above vs. below the upper limit of the iPTH target: −0.46 + 1.29 vs. 0.12 + 1.14, p < 0.01.
Figure 2. Cortical Volumetric BMD and Endosteal Circumference Z-scores according to iPTH Level.
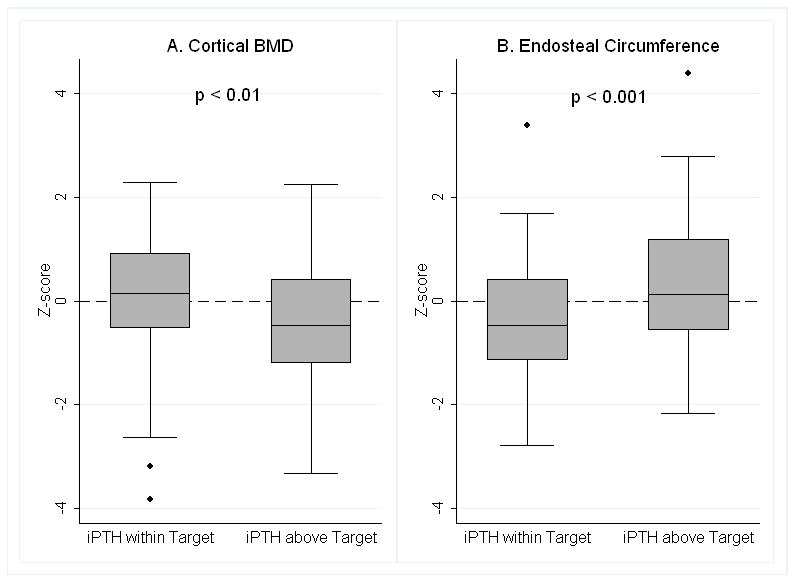
A. Cortical volumetric BMD Z-scores were significantly lower in participants with iPTH levels above the target range, compared to those with iPTH levels below the upper limit of the target range (p < 0.01).
B. Endosteal Circumference Z-scores were significantly greater in participants with iPTH levels above the target range, compared to those with iPTH levels below the upper limit of the target range (p < 0.001).
These data represent all CKD categories combined and were not adjusted for any covariates. The symbols above and below the box plots represent outliers.
Cortical BMD Z-scores were not associated with serum bicarbonate levels. Cortical BMD Z-scores did not differ according to the underlying renal diagnosis or CKD duration, adjusted for CKD severity. Cortical BMD Z-scores were not associated with calcitriol, rhGH or glucocorticoid therapy, independent of CKD severity, or with dialysis duration or modality.
Cortical Dimensions Z-scores
Cortical bone area Z-scores were lower in CKD, compared with the reference group (Table 4). The lower cortical bone area Z-scores in CKD stages 4–5 and 5D were characterized by smaller periosteal circumference and larger endosteal circumference Z-scores, compared with the reference group; however, these differences were not statistically significant (data not shown). Adjustment for Tanner stage moderately attenuated the deficits in cortical dimensions in CKD. For example, the mean cortical area Z-score in CKD stages 4–5 improved from −0.49 (Table 4) to −0.41 (95% C.I. −0.73, −0.05; p < 0.05) when adjusted for Tanner stage.
Lower cortical bone area and greater endosteal circumference Z-scores were significantly associated with higher levels of 1–84 PTH (cortical area r = −0.18, p < 0.05; endosteal circumference r = 0.30, p < 0.001), iPTH (cortical area r = −0.17, p < 0.05; endosteal circumference r = 0.29, p < 0.001), BSAP (cortical area r = −0.32, p=0.001; endosteal circumference r = 0.27, p < 0.01) and β-CTX (cortical area r = −0.25, p < 0.01; endosteal circumference r = 0.36 p < 0.0001) and lower levels of serum bicarbonate (cortical area r = 0.19, p < 0.05; endosteal circumference r = −0.24, p < 0.01) within the CKD participants. The associations remained significant adjusted for CKD severity category. Figure 2B demonstrates that endosteal circumference Z-scores were significantly greater among CKD participants with iPTH levels above vs. below the upper limit of the iPTH target range: 0.39 ± 1.23 vs. −0.30 ± 1.12, p < 0.001. Periosteal circumference Z-scores were not significantly associated with any of these laboratory parameters.
A longer duration since the diagnosis of CKD was associated with significantly lower cortical area and periosteal circumference Z-scores (all p < 0.05), adjusted for age and CKD severity. Glucocorticoid or calcitriol therapies, underlying renal diagnosis, and dialysis duration and modality were not associated with measures of cortical geometry. Similar results were observed when the analyses were limited to participants with CAKUT.
Muscle and Fat Area Z-scores
Advanced CKD was associated with significantly lower muscle area and fat area Z-scores, compared with the reference group (Table 4), as previously described.(30) Within the CKD participants, muscle area and cortical area Z-scores were positively correlated (r = 0.37, p < 0.0001). Adjustment for muscle area Z-scores did not attenuate the significant deficits in cortical area Z-scores observed in CKD stages 4–5, compared with the reference group. However, the lower cortical area Z-scores observed in CKD 5D were no longer significant after adjustment for muscle area Z-score.
DISCUSSION
This study is the first to examine trabecular and cortical volumetric BMD and cortical dimensions across the full spectrum of CKD severity in children or adults. These data demonstrated that secondary hyperparathyroidism in CKD was associated with lower cortical BMD, greater endosteal circumference and smaller cortical area, independent of CKD severity. These associations are consistent with known PTH effects to increase cortical porosity and decrease cortical thickness through loss of endocortical bone.(8) Elevated PTH levels were associated with greater trabecular BMD in younger participants; however, this association was absent in the older adolescents.
To our knowledge, six prior studies used pQCT to examine bone density and structure in children with CKD.(24–29) Four of these reported significantly greater trabecular BMD in CKD compared with controls; however, the very small sample sizes and sparse reference data precluded assessment of age effects.(24–26,28) Of note, in a study of 21 children on peritoneal dialysis, trabecular BMD was significantly greater in the children with CKD, compared with adult controls (p < 0.0001) and trabecular BMD was greater in younger children.(26) Studies of pQCT trabecular BMD in adults with CKD compared with controls are limited to a recent high-resolution pQCT study in older adults (age > 50 yr) with CKD stages 2–4.(49) The authors reported that CKD was associated with lower trabecular BMD compared with controls. However, the investigators excluded the 45% of male and 55% of female controls with DXA BMD T-scores < −1.0, effectively excluding controls with normal age-related bone loss. It is not stated if the CKD participants differed from the control sample as a whole.
The etiology of the markedly elevated trabecular BMD Z-scores in our younger CKD participants is unclear, and is unique to CKD. Prior studies by our group in nephrotic syndrome,(39) Crohn disease,(38) and juvenile idiopathic arthritis(46) demonstrated consistent reductions in trabecular BMD Z-scores associated with systemic inflammation and/or glucocorticoid therapy across the entire pediatric age range. We anticipated that trabecular BMD Z-scores would be elevated in CKD due to an anabolic effect of PTH.(8) Although this association was present in the younger CKD participants, it was absent in the older adolescents. We hypothesize that the elevated trabecular BMD in the younger children and in prior pediatric pQCT studies (24–26,28) is due to CKD and PTH effects on the metaphysis. Mehls, et al reported that transformation of metaphyseal spongiosa into diaphyseal spongiosa is disturbed in advanced CKD in children, such that dense metaphyseal spongiosa is encountered further along the shaft of the bone.(45) We do not believe that the elevated trabecular BMD represents an artifact of the abnormal growth plate morphology in pediatric CKD(50,51) because the pQCT reference line was positioned at the proximal margin of the distal growth plate in all CKD and control participants. The resolution of pQCT is insufficient to define individual trabeculae.(52) In the metaphysis, pQCT measures of trabecular volumetric BMD are a function of the bone volume fraction and the material bone mineral density distribution within the individual trabeculae. It is not known if the differences observed here between CKD and reference participants were due to differences in trabecular microarchitecture or material density. Future studies are needed in children with CKD using high-resolution pQCT to assess trabecular microarchitecture and compartment BMD along the entire metaphysis.
It is well-established that hyperparathyroidism results in increased bone turnover with endocortical bone loss and increased cortical porosity.(8,53,54) The extent of cortical bone loss in adults on maintenance dialysis was demonstrated in a bone biopsy study.(7) Regardless of the histological classification, the major structural abnormality in the skeleton was generalized thinning of cortical bone due to increased net endocortical resorption. Limited pQCT studies have been conducted in adults on hemodialysis,(55–57) children on dialysis(26) and children following transplantation, (24,27) demonstrating reductions in cortical volumetric BMD and/or cortical thickness. In the study here, the positive association of endosteal circumference Z-scores with PTH levels and bone turnover biomarkers was consistent with PTH effects on endocortical bone, and the association with low serum bicarbonate and high bone resorption markers was consistent with reports that chronic acidosis also contributes to cortical bone loss.(58) Of note, many of the estimated correlations between laboratory parameters and cortical bone Z-scores were weak (r = 0.18 to 0.36). However, when assessed as a group, the cumulative evidence supported the hypothesis that secondary hyperparathyroidism resulted in increased bone turnover, endocortical bone loss and decreases in cortical BMD in CKD. Secondary analyses adjusted for cortical thickness or limited to subjects with cortical thickness greater than 3 mm confirmed that these observations were not due to partial volume effects.(33)
Given the strong associations between muscle mass and cortical bone strength during growth and development, investigators have advocated a two-staged algorithm to assess (1) muscle mass relative to body size, and (2) bone outcomes relative to muscle mass in children with chronic disease.(59) This ‘functional muscle-bone unit’ approach is intended to distinguish between primary bone disorders (muscle mass is normal and bone mass is low relative to muscle), as opposed to bone disorders that are secondary to muscle deficits (muscle mass is reduced but bone mass is ‘adequate’ for the reduced muscle mass). In this study, we reported that cortical area deficits in CKD stage 5D were no longer significant after adjustment for muscle deficits. However, this does not prove a causal relationship. This close association may be mediated by nutritional, hormonal or inflammatory factors that directly influence both muscle and bone.(60)
The greatest limitation of this study was the cross-sectional design. BMD and cortical dimensions reflect cumulative bone accrual and disease activity throughout growth and development, while the medication and laboratory data presented here represent a snapshot in time. The heterogeneity of the underlying renal diseases is another important limitation. However, this study of 156 children is the largest pediatric pQCT study to date (the largest prior study enrolled 22 children). Importantly, the secondary analyses conducted within the 96 CAKUT participants reduced the heterogeneity and confirmed the key findings. Last, this study is limited by lack of bone biopsy data. Despite these limitations, this study provides important and novel insights into the structural effects of CKD and secondary hyperparathyroidism on bone development.
In summary, this study is the first to examine trabecular and cortical volumetric BMD and cortical dimensions across the full spectrum of CKD severity in children or adults. Furthermore, the healthy reference group constitutes the largest reference population used in the assessment of the skeletal effects of CKD in children and adolescents, facilitating adjustment for age, sex, race, pubertal maturation, and tibia length. This study is the first to provide Z-score estimates of the magnitude of the cortical volumetric BMD and cortical area deficits in the growing skeleton, and the first to identify that the associations of trabecular BMD with CKD severity and PTH levels vary according to age. Future studies are needed to establish the fracture implications of these alterations, to determine if cortical and trabecular abnormalities are reversible, and to identify therapies to improve bone quality in children with CKD.
Acknowledgments
Funding Sources: NIH R01-DK060030, R01-HD040714, K24-DK076808, and UL1-RR-024134
We greatly appreciate the dedication and enthusiasm of the children and their families who participated in this study. Special thanks to Donna Paulhamus in the Division of Gastroenterology, Hepatology and Nutrition at CHOP. Additional thanks to Ashwini Roy-Chaudhury in the Center for Health Quality at CCHMC.
Footnotes
Supplemental Data: No supplemental data are included
CONFLICT OF INTEREST
The Authors state that they have no conflicts of interest.
Contributor Information
Rachel J. Wetzsteon, Email: wetzsteon@email.chop.edu.
Heidi J. Kalkwarf, Email: heidi.kalkwarf@cchmc.org.
Justine Shults, Email: jshults@mail.med.upenn.edu.
Babette S. Zemel, Email: zemel@email.chop.edu.
Bethany J. Foster, Email: beth.foster@muhc.mcgill.ca.
Lindsay Griffin, Email: griffinl@email.chop.edu.
C. Frederic Strife, Email: Frederic.Strife@cchmc.org.
Debbie L. Foerster, Email: foerster@email.chop.edu.
Darlene K. Jean-Pierre, Email: darlene.jean-pierre@med.einstein.yu.edu.
Mary B. Leonard, Email: leonard@email.chop.edu.
References
- 1.Leonard MB, Elmi A, Mostoufi-Moab S, Shults J, Burnham JM, Thayu M, Kibe L, Wetzsteon RJ, Zemel BS. Effects of sex, race, and puberty on cortical bone and the functional muscle bone unit in children, adolescents, and young adults. J Clin Endocrinol Metab. 2010;95(4):1681–9. doi: 10.1210/jc.2009-1913. [DOI] [PMC free article] [PubMed] [Google Scholar]
- 2.Gilsanz V, Skaggs DL, Kovanlikaya A, Sayre J, Loro ML, Kaufman F, Korenman SG. Differential effect of race on the axial and appendicular skeletons of children. J Clin Endocrinol Metab. 1998;83(5):1420–7. doi: 10.1210/jcem.83.5.4765. [DOI] [PubMed] [Google Scholar]
- 3.Alem AM, Sherrard DJ, Gillen DL, Weiss NS, Beresford SA, Heckbert SR, Wong C, Stehman-Breen C. Increased risk of hip fracture among patients with end-stage renal disease. Kidney Int. 2000;58(1):396–9. doi: 10.1046/j.1523-1755.2000.00178.x. [DOI] [PubMed] [Google Scholar]
- 4.Ball AM, Gillen DL, Sherrard D, Weiss NS, Emerson SS, Seliger SL, Kestenbaum BR, Stehman-Breen C. Risk of hip fracture among dialysis and renal transplant recipients. Jama. 2002;288(23):3014–8. doi: 10.1001/jama.288.23.3014. [DOI] [PubMed] [Google Scholar]
- 5.Nickolas TL, McMahon DJ, Shane E. Relationship between moderate to severe kidney disease and hip fracture in the United States. J Am Soc Nephrol. 2006;17(11):3223–32. doi: 10.1681/ASN.2005111194. [DOI] [PubMed] [Google Scholar]
- 6.Malluche HH, Mawad HW, Monier-Faugere MC. Renal osteodystrophy in the first decade of the new millennium-analysis of 630 bone biopsies in black and white patients. J Bone Miner Res. doi: 10.1002/jbmr.309. [DOI] [PMC free article] [PubMed] [Google Scholar]
- 7.Schober HC, Han ZH, Foldes AJ, Shih MS, Rao DS, Balena R, Parfitt AM. Mineralized bone loss at different sites in dialysis patients: implications for prevention. J Am Soc Nephrol. 1998;9(7):1225–33. doi: 10.1681/ASN.V971225. [DOI] [PubMed] [Google Scholar]
- 8.Parfitt AM. A structural approach to renal bone disease. J Bone Miner Res. 1998;13 (8):1213–20. doi: 10.1359/jbmr.1998.13.8.1213. [DOI] [PubMed] [Google Scholar]
- 9.Zemel BS, Leonard MB, Kelly A, Lappe JM, Gilsanz V, Oberfield S, Mahboubi S, Shepherd JA, Hangartner TN, Frederick MM, Winer KK, Kalkwarf HJ. Height adjustment in assessing dual energy x-ray absorptiometry measurements of bone mass and density in children. J Clin Endocrinol Metab. 2010;95(3):1265–73. doi: 10.1210/jc.2009-2057. [DOI] [PMC free article] [PubMed] [Google Scholar]
- 10.Saland JM, Goode ML, Haas DL, Romano TA, Seikaly MG. The prevalence of osteopenia in pediatric renal allograft recipients varies with the method of analysis. Am J Transplant. 2001;1(3):243–50. doi: 10.1034/j.1600-6143.2001.001003243.x. [DOI] [PubMed] [Google Scholar]
- 11.Andrade MC, Carvalhaes JT, Carvalho AB, Lazarretti-Castro M, Brandao C. Bone mineral density and bone histomorphometry in children on long-term dialysis. Pediatr Nephrol. 2007;22(10):1767–72. doi: 10.1007/s00467-007-0546-7. [DOI] [PubMed] [Google Scholar]
- 12.Pluskiewicz W, Adamczyk P, Drozdzowska B, Szprynger K, Szczepanska M, Halaba Z, Karasek D. Skeletal status in children, adolescents and young adults with end-stage renal failure treated with hemo- or peritoneal dialysis. Osteoporos Int. 2002;13(5):353–7. doi: 10.1007/s001980200039. [DOI] [PubMed] [Google Scholar]
- 13.Pluskiewicz W, Adamczyk P, Drozdzowska B, Szprynger K, Szczepanska M, Halaba Z, Karasek D. Skeletal status in children and adolescents with chronic renal failure before onset of dialysis or on dialysis. Osteoporos Int. 2003;14(4):283–8. doi: 10.1007/s00198-002-1335-6. [DOI] [PubMed] [Google Scholar]
- 14.Pluskiewicz W, Adamczyk P, Drozdzowska B, Szprynger K, Szczepanska M, Halaba Z, Karasek D. Skeletal status in adolescents with end-stage renal failure: a longitudinal study. Osteoporos Int. 2005;16(3):289–95. doi: 10.1007/s00198-004-1672-8. [DOI] [PubMed] [Google Scholar]
- 15.Boot AM, Nauta J, de Jong MC, Groothoff JW, Lilien MR, van Wijk JA, Kist-van Holthe JE, Hokken-Koelega AC, Pols HA, de Muinck Keizer-Schrama SM. Bone mineral density, bone metabolism and body composition of children with chronic renal failure, with and without growth hormone treatment. Clin Endocrinol (Oxf) 1998;49(5):665–72. doi: 10.1046/j.1365-2265.1998.00593.x. [DOI] [PubMed] [Google Scholar]
- 16.Bakr AM. Bone mineral density and bone turnover markers in children with chronic renal failure. Pediatr Nephrol. 2004;19(12):1390–3. doi: 10.1007/s00467-004-1670-2. [DOI] [PubMed] [Google Scholar]
- 17.Waller S, Ridout D, Rees L. Bone mineral density in children with chronic renal failure. Pediatr Nephrol. 2007;22(1):121–7. doi: 10.1007/s00467-006-0292-2. [DOI] [PubMed] [Google Scholar]
- 18.Ahmed SF, Russell S, Rashid R, Beattie TJ, Murphy AV, Ramage IJ, Maxwell H. Bone mineral content, corrected for height or bone area, measured by DXA is not reduced in children with chronic renal disease or in hypoparathyroidism. Pediatr Nephrol. 2005;20 (10):1466–72. doi: 10.1007/s00467-005-1973-y. [DOI] [PubMed] [Google Scholar]
- 19.Van Dyck M, Gyssels A, Proesmans W, Nijs J, Eeckels R. Growth hormone treatment enhances bone mineralisation in children with chronic renal failure. Eur J Pediatr. 2001;160(6):359–63. doi: 10.1007/s004310100734. [DOI] [PubMed] [Google Scholar]
- 20.van der Sluis IM, Boot AM, Nauta J, Hop WC, de Jong MC, Lilien MR, Groothoff JW, van Wijk AE, Pols HA, Hokken-Koelega AC, de Muinck Keizer-Schrama SM. Bone density and body composition in chronic renal failure: effects of growth hormone treatment. Pediatr Nephrol. 2000;15(3–4):221–8. doi: 10.1007/s004670000470. [DOI] [PubMed] [Google Scholar]
- 21.Swolin-Eide D, Hansson S, Magnusson P. Children with chronic kidney disease: a 3-year prospective study of growth, bone mass and bone turnover. Acta Paediatr. 2009;98 (2):367–73. doi: 10.1111/j.1651-2227.2008.01073.x. [DOI] [PubMed] [Google Scholar]
- 22.Swolin-Eide D, Magnusson P, Hansson S. Bone mass, biochemical markers and growth in children with chronic kidney disease: a 1-year prospective study. Acta Paediatr. 2007;96 (5):720–5. doi: 10.1111/j.1651-2227.2007.00236.x. [DOI] [PubMed] [Google Scholar]
- 23.Jamal SA, Gilbert J, Gordon C, Bauer DC. Cortical pQCT measures are associated with fractures in dialysis patients. J Bone Miner Res. 2006;21(4):543–8. doi: 10.1359/jbmr.060105. [DOI] [PubMed] [Google Scholar]
- 24.Behnke B, Altrogge H, Delling G, Kruse HP, Muller-Wiefel DE. Bone mineral density in pediatric patients after renal transplantation. Clin Nephrol. 1996;46(1):24–9. [PubMed] [Google Scholar]
- 25.Behnke B, Kemper MJ, Kruse HP, Muller-Wiefel DE. Bone mineral density in children with primary hyperoxaluria type I. Nephrol Dial Transplant. 2001;16(11):2236–9. doi: 10.1093/ndt/16.11.2236. [DOI] [PubMed] [Google Scholar]
- 26.Lima EM, Goodman WG, Kuizon BD, Gales B, Emerick A, Goldin J, Salusky IB. Bone density measurements in pediatric patients with renal osteodystrophy. Pediatr Nephrol. 2003;18(6):554–9. doi: 10.1007/s00467-002-1041-9. [DOI] [PubMed] [Google Scholar]
- 27.Ruth EM, Weber LT, Schoenau E, Wunsch R, Seibel MJ, Feneberg R, Mehls O, Tonshoff B. Analysis of the functional muscle-bone unit of the forearm in pediatric renal transplant recipients. Kidney Int. 2004;66(4):1694–706. doi: 10.1111/j.1523-1755.2004.00937.x. [DOI] [PubMed] [Google Scholar]
- 28.Tenbrock K, Kruppa S, Mokov E, Querfeld U, Michalk D, Schoenau E. Analysis of muscle strength and bone structure in children with renal disease. Pediatr Nephrol. 2000;14 (7):669–72. doi: 10.1007/s004670000360. [DOI] [PubMed] [Google Scholar]
- 29.Bacchetta J, Boutroy S, Vilayphiou N, Ranchin B, Fouque-Aubert A, Basmaison O, Cochat P. Bone assessment in children with chronic kidney disease: data from two new bone imaging techniques in a single-center pilot study. Pediatr Nephrol. doi: 10.1007/s00467-010-1745-1. [DOI] [PubMed] [Google Scholar]
- 30.Foster BJ, Kalkwarf HJ, Shults J, Zemel BS, Wetzsteon RJ, Thayu M, Foerster DL, Leonard MB. Association of chronic kidney disease with muscle deficits in children. J Am Soc Nephrol. 22(2):377–86. doi: 10.1681/ASN.2010060603. [DOI] [PMC free article] [PubMed] [Google Scholar]
- 31.Tanner JM, Whitehouse RH, Marshall WA, Healy MJR, Goldstein H. Assessment of Skeletal Maturity and Prediction of Adult Height (TW2 Method) Academic Press; London, England: 1975. [Google Scholar]
- 32.Morris NM, Udry JR. Validation of a self-administered instrument to assess stage of adolescent development. J Youth Adolesc. 1980;9(3):271–80. doi: 10.1007/BF02088471. [DOI] [PubMed] [Google Scholar]
- 33.Binkley TL, Specker BL. pQCT measurement of bone parameters in young children: validation of technique. J Clin Densitom. 2000;3(1):9–14. doi: 10.1385/jcd:3:1:009. [DOI] [PubMed] [Google Scholar]
- 34.Schwartz GJ, Munoz A, Schneider MF, Mak RH, Kaskel F, Warady BA, Furth SL. New equations to estimate GFR in children with CKD. J Am Soc Nephrol. 2009;20(3):629–37. doi: 10.1681/ASN.2008030287. [DOI] [PMC free article] [PubMed] [Google Scholar]
- 35.K/DOQI clinical practice guidelines for chronic kidney disease: evaluation, classification, and stratification. Am J Kidney Dis. 2002;39(2 Suppl 1):S1–266. [PubMed] [Google Scholar]
- 36.Gao P, Scheibel S, D’Amour P, John MR, Rao SD, Schmidt-Gayk H, Cantor TL. Development of a novel immunoradiometric assay exclusively for biologically active whole parathyroid hormone 1–84: implications for improvement of accurate assessment of parathyroid function. J Bone Miner Res. 2001;16(4):605–14. doi: 10.1359/jbmr.2001.16.4.605. [DOI] [PubMed] [Google Scholar]
- 37.Ogden CL, Kuczmarski RJ, Flegal KM, Mei Z, Guo S, Wei R, Grummer-Strawn LM, Curtin LR, Roche AF, Johnson CL. Centers for Disease Control and Prevention 2000 growth charts for the United States: improvements to the 1977 National Center for Health Statistics version. Pediatrics. 2002;109(1):45–60. doi: 10.1542/peds.109.1.45. [DOI] [PubMed] [Google Scholar]
- 38.Dubner SE, Shults J, Baldassano RN, Zemel BS, Thayu M, Burnham JM, Herskovitz RM, Howard KM, Leonard MB. Longitudinal assessment of bone density and structure in an incident cohort of children with Crohn’s disease. Gastroenterology. 2009;136(1):123–30. doi: 10.1053/j.gastro.2008.09.072. [DOI] [PMC free article] [PubMed] [Google Scholar]
- 39.Wetzsteon RJ, Shults J, Zemel BS, Gupta PU, Burnham JM, Herskovitz RM, Howard KM, Leonard MB. Divergent effects of glucocorticoids on cortical and trabecular compartment BMD in childhood nephrotic syndrome. J Bone Miner Res. 2009;24(3):503–13. doi: 10.1359/JBMR.081101. [DOI] [PMC free article] [PubMed] [Google Scholar]
- 40.Cole TJ. The LMS method for constructing normalized growth standards. Eur J Clin Nutr. 1990;44(1):45–60. [PubMed] [Google Scholar]
- 41.Cole TJ, Green PJ. LMS Chartmaker Pro Child Growth Foundation. 2006. [Google Scholar]
- 42.Long JS, Ervin L. Using heteroscedasticity-consistent standard errors in the linear regression model. The American Statistician. 2000;54:217–24. [Google Scholar]
- 43.Tuchman S, Thayu M, Shults J, Zemel BS, Burnham JM, Leonard MB. Interpretation of biomarkers of bone metabolism in children: impact of growth velocity and body size in healthy children and chronic disease. J Pediatr. 2008;153(4):484–90. doi: 10.1016/j.jpeds.2008.04.028. [DOI] [PMC free article] [PubMed] [Google Scholar]
- 44.K/DOQI Clinical Practice Guidelines for bone metabolism and disease in children with chronic kidney disease. American Journal of Kidney Diseases. 2005;46(Suppl 1):S1–S103. [PubMed] [Google Scholar]
- 45.Mehls O, Ritz E, Krempien B, Willich E, Bommer J, Scharer K. Roentgenological signs in the skeleton of uremic children. An analysis of the anatomical principles underlying the roentgenological changes. Pediatr Radiol. 1973;1(3):183–90. doi: 10.1007/BF00974065. [DOI] [PubMed] [Google Scholar]
- 46.Burnham JM, Shults J, Dubner SE, Sembhi H, Zemel BS, Leonard MB. Bone density, structure, and strength in juvenile idiopathic arthritis: Importance of disease severity and muscle deficits. Arthritis Rheum. 2008;58(8):2518–27. doi: 10.1002/art.23683. [DOI] [PMC free article] [PubMed] [Google Scholar]
- 47.Canalis E, Mazziotti G, Giustina A, Bilezikian JP. Glucocorticoid-induced osteoporosis: pathophysiology and therapy. Osteoporos Int. 2007;18(10):1319–28. doi: 10.1007/s00198-007-0394-0. [DOI] [PubMed] [Google Scholar]
- 48.Dalle Carbonare L, Bertoldo F, Valenti MT, Zenari S, Zanatta M, Sella S, Giannini S, Cascio VL. Histomorphometric analysis of glucocorticoid-induced osteoporosis. Micron. 2005;36(7–8):645–52. doi: 10.1016/j.micron.2005.07.009. [DOI] [PubMed] [Google Scholar]
- 49.Bacchetta J, Boutroy S, Vilayphiou N, Juillard L, Guebre-Egziabher F, Rognant N, Sornay-Rendu E, Szulc P, Laville M, Delmas PD, Fouque D, Chapurlat R. Early impairment of trabecular microarchitecture assessed with HR-pQCT in patients with stage II–IV chronic kidney disease. J Bone Miner Res. 25(4):849–57. doi: 10.1359/jbmr.090831. [DOI] [PubMed] [Google Scholar]
- 50.Sanchez CP, He YZ. Effects of thyroparathyroidectomy, exogenous calcium, and short-term calcitriol therapy on the growth plate in renal failure. J Am Soc Nephrol. 2003;14 (1):148–58. doi: 10.1097/01.asn.0000039565.56011.be. [DOI] [PubMed] [Google Scholar]
- 51.Sanchez CP, He YZ, Leiferman E, Wilsman NJ. Bone elongation in rats with renal failure and mild or advanced secondary hyperparathyroidism. Kidney Int. 2004;65(5):1740–8. doi: 10.1111/j.1523-1755.2004.00577.x. [DOI] [PubMed] [Google Scholar]
- 52.Rauch F, Schoenau E. Changes in bone density during childhood and adolescence: an approach based on bone’s biological organization. J Bone Miner Res. 2001;16(4):597–604. doi: 10.1359/jbmr.2001.16.4.597. [DOI] [PubMed] [Google Scholar]
- 53.Parfitt AM. Metacarpal cortical dimensions in hypoparathyroidism, primary hyperparathyroidism and chronic renal failure. Calcif Tissue Res. 1977;22(Suppl):329–31. doi: 10.1007/BF02064091. [DOI] [PubMed] [Google Scholar]
- 54.Hopper TA, Wehrli FW, Saha PK, Andre JB, Wright AC, Sanchez CP, Leonard MB. Quantitative microcomputed tomography assessment of intratrabecular, intertrabecular, and cortical bone architecture in a rat model of severe renal osteodystrophy. J Comput Assist Tomogr. 2007;31(2):320–8. doi: 10.1097/01.rct.0000238007.19258.3d. [DOI] [PubMed] [Google Scholar]
- 55.Russo CR, Taccetti G, Caneva P, Mannarino A, Maranghi P, Ricca M. Volumetric bone density and geometry assessed by peripheral quantitative computed tomography in uremic patients on maintenance hemodialysis. Osteoporos Int. 1998;8(5):443–8. doi: 10.1007/s001980050089. [DOI] [PubMed] [Google Scholar]
- 56.Hasegawa K, Hasegawa Y, Nagano A. Estimation of bone mineral density and architectural parameters of the distal radius in hemodialysis patients using peripheral quantitative computed tomography. J Biomech. 2004;37(5):751–6. doi: 10.1016/S0021-9290(03)00174-X. [DOI] [PubMed] [Google Scholar]
- 57.Negri AL, Barone R, Lombas C, Bogado CE, Zanchetta JR. Evaluation of cortical bone by peripheral quantitative computed tomography in continuous ambulatory peritoneal dialysis patients. Hemodial Int. 2006;10(4):351–5. doi: 10.1111/j.1542-4758.2006.00128.x. [DOI] [PubMed] [Google Scholar]
- 58.Pereverzev A, Komarova SV, Korcok J, Armstrong S, Tremblay GB, Dixon SJ, Sims SM. Extracellular acidification enhances osteoclast survival through an NFAT- independent, protein kinase C-dependent pathway. Bone. 2008;42(1):150–61. doi: 10.1016/j.bone.2007.08.044. [DOI] [PubMed] [Google Scholar]
- 59.Schoenau E, Neu CM, Beck B, Manz F, Rauch F. Bone mineral content per muscle cross-sectional area as an index of the functional muscle-bone unit. J Bone Miner Res. 2002;17 (6):1095–101. doi: 10.1359/jbmr.2002.17.6.1095. [DOI] [PubMed] [Google Scholar]
- 60.Roubenoff R, Roubenoff RA, Cannon JG, Kehayias JJ, Zhuang H, Dawson-Hughes B, Dinarello CA, Rosenberg IH. Rheumatoid cachexia: cytokine-driven hypermetabolism accompanying reduced body cell mass in chronic inflammation. Journal of Clinical Investigation. 1994;93:2379–86. doi: 10.1172/JCI117244. [DOI] [PMC free article] [PubMed] [Google Scholar]