Abstract
Purpose
To evaluate the utility of lumbar spine attenuation measurement for bone mineral density (BMD) assessment at screening CT colonography (CTC), using central dual-energy x-ray absorptiometry (DXA) as the reference standard.
Material and Methods
252 adults (240 women, 12 men; mean age, 58.9 years) underwent CTC screening and central DXA BMD measurement within 2 months (mean interval, 25.0 days). The lowest DXA T-score between the spine and hip served as the reference standard, with low BMD defined per WHO as osteoporosis (DXA T-score ≤-2.5) or osteopenia (DXA T-score between −1.0 and −2.4). Both phantomless QCT and simple non-angled ROI MDCT attenuation measurements were applied to T12-L5 levels. Ability to predict osteoporosis and low BMD (osteoporosis or osteopenia) by DXA was assessed.
Results
A BMD cut-off of 90 mg/cc at phantomless QCT yielded 100% sensitivity for osteoporosis (29/29) and specificity of 63.8% (143/224); 87.2% (96/110) below this threshold had low BMD and 49.6% (69/139) above this threshold had normal BMD at DXA. At L1, a trabecular ROI attenuation cut-off of 160 HU was 100% sensitive for osteoporosis (29/29), with a specificity of 46.4% (104/224); 83.9% (125/149) below this threshold had low BMD and 57.5% (59/103) above had normal BMD at DXA. ROI performance was similar at all individual T12-L5 levels. At ROC analysis, AUC for osteoporosis was 0.888 for phantomless QCT (95% CI: 0.780–0.946) and ranged from 0.825–0.853 using trabecular ROIs at single lumbar levels (0.864 [0.752–0.930] at multivariate analysis). Supine-prone reproducibility was better with simple ROI method compared with QCT.
Conclusion
Both phantomless QCT and simple ROI attenuation measurements of the lumbar spine are effective for BMD screening at CTC, with high sensitivity for osteoporosis as defined by the DXA T-score.
Keywords: Osteoporosis, Screening, Bone mineral density, Computed tomography, CT colonography
Introduction
Osteoporosis is a major public health concern. It is estimated that up to 50% of women and 20% of men are at risk for developing an osteoporosis-related fracture during their lifetime.1 Despite these statistics, osteoporosis screening with dual-energy x-ray absorptiometry (DXA) remains underutilized. According to the official positions of the International Society for Clinical Densitometry (ISCD)2 and the National Osteoporosis Foundation (NOF),3 central DXA of the lumbar spine and proximal femora is the preferred method for bone mineral density (BMD) testing. Osteoporosis is diagnosed at central DXA in postmenopausal women and in men age 50 and older if the T-score of the lumbar spine or hip is −2.5 or less.2 Low BMD for purposes of this report includes both osteoporosis and osteopenia, corresponding to a DXA T-score of −1.0 or less.
BMD can also be assessed with other radiologic imaging tools, such as quantitative CT (QCT) and ultrasound. However, because the widely accepted WHO definition for osteoporosis is based on the DXA T-score,2 this measure must serve as the reference standard against which other BMD modalities are compared and validated. For patients undergoing screening CT colonography (CTC), a potential opportunity exists for concurrent BMD screening of the lumbar spine without the need for any additional imaging, radiation exposure, or patient time.4 If either phantomless QCT or even simpler lumbar spine MDCT attenuation measurements (as described below) prove to be sufficiently accurate for osteoporosis identification, this could increase screening rates or alternatively preclude the need for DXA screening in some individuals. Concurrent osteoporosis screening at CTC would further enhance the clinical value of this test, as well as the cost-effectiveness relative to one-dimensional screening modalities.
The main purpose of this study was to evaluate the utility of lumbar spine attenuation measurement for BMD assessment at screening CTC, using DXA as the reference standard. The lowest T-score from central DXA represents the appropriate (and obligatory) reference standard for comparison. Both formal phantomless QCT and simple non-angled trabecular ROI attenuation measurements of the lumbar spine were assessed. Measurement reproducibility of the CT-based attenuation measurements and detection of prevalent compression fractures in patients without osteoporosis by DXA T-score were secondary aims of this study.
Material and Methods
Patient Cohort
This HIPAA-compliant retrospective study was approved by the University of Wisconsin Health Sciences IRB; the need for obtaining signed informed consent was waived for this retrospective analysis. The main inclusion criteria consisted of adults age 50 years and older who underwent both central DXA and CTC screening within a 2-month interval (60 days) at our institution over a 52-month time period ending in September 2008. Eight patients were excluded because a T-score was not reported for either the L-spine or the hips at DXA. The final study cohort consisted of 252 asymptomatic adults (240 women, 12 men; mean age, 58.9 years; age range, 50–87 years; inter-quartile range 54–63 years). The mean time interval between CTC and DXA studies was 25.0 days (range, 1–60 days; inter-quartile range, 11–36.3 days).
DXA and MDCT Acquisition Techniques
Central DXA of the L-spine and proximal femora for BMD assessment was performed using standard techniques according to ISCD guidelines using GE Healthcare Lunar Prodigy densitometers. For inclusion, at least one valid T-score report for the lumbar spine or hips was required. Osteoporosis is diagnosed in postmenopausal women and in men age 50 and older if the DXA T-score of the lumbar spine, total hip, or femoral neck is −2.5 or less.2, 3 Osteopenia is defined as a DXA T-score between −1.0 and −2.4, with low BMD encompassing both osteoporosis and osteopenia. For the purposes of this study (and in routine clinical practice), individual patients were categorized according to their lowest central T-score, which served as the main DXA outcome measure. We also considered the spinal T-scores alone (without hip T-scores) as a separate reference standard for a more limited secondary analysis.
In the study cohort of 252 asymptomatic adults undergoing concurrent CTC and DXA screening, the prevalence of osteoporosis and osteopenia by the combined L-spine/hip DXA reference standard was 11.5% (29 of 252) and 55.2% (139 of 252), respectively. Of note, the L-spine DXA T-score was more often the primary determinant of osteoporosis. The hip T-score was −2.5 or less in only 13 or 29 patients with osteoporosis by the combined DXA reference standard, whereas the L-spine T-score was −2.5 or less in 23 of these 29 patients. In two and 14 cases with osteoporosis by central DXA, the hip T-scores were in the normal and osteopenic range, respectively, whereas the L-spine T-score was abnormal in 27 cases (osteoporosis in 23, osteopenia in four) and was not reported in two. We did not consider radius DXA in this study, which was reported in only a small minority of cases.
MDCT scanning for standard CTC screening was performed using low-dose technique, as previously described.5–7 To briefly summarize the entire CTC screening procedure, individuals first undergo bowel preparation on the evening before examination that consists of both catharsis and oral contrast tagging. Immediately prior to MDCT imaging, the colon is distended with carbon dioxide utilizing a continuous automated low-pressure delivery system. Noncontrast supine and prone MDCT acquisitions of the abdomen and pelvis are then obtained (LightSpeed Series, GE Healthcare) with 1.25-mm collimation, 120 kVp, and low-dose tube current technique that is either static (50–100 mAs) or modulated (noise index = 50; range, 30–300 mA). Supine and prone imaging at CTC provides a unique opportunity for an internal control for vertebral measurement. Images are reconstructed using a standard soft tissue algorithm with 1.25-mm slice thickness at 1-mm intervals. For extracolonic evaluation, the supine series is also reconstructed with a 5-mm slice thickness at 3-mm intervals.8 The MDCT scanners used in this study are calibrated daily to ensure accurate CT attenuation numbers, measured in Hounsfield units (HU).
Phantomless QCT Technique
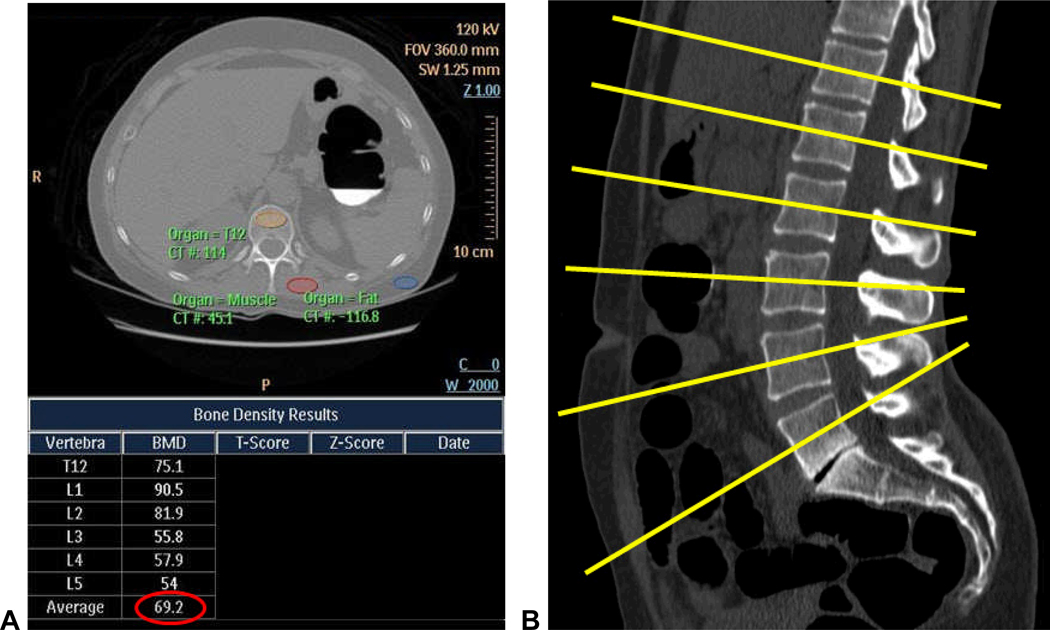
Formal quantitative CT was performed by a board-certified radiologist on a dedicated phantomless QCT software package (BMAP, Philips Healthcare) using the thin section (1.25 mm) supine series. The radiologist was unaware of the DXA results at the time of QCT interpretation. Phantomless QCT entails placing oval regions of interests (ROIs) on the vertebral body, paraspinal musculature, and subcutaneous fat at each level from T12 through L5 (Fig 1A). A sagittal reconstruction is used to angle the transverse plane of section to make it parallel with the end plate at each level. The vertebral body ROI is placed in the anterior trabecular region, as previously described,9–11 avoiding the basi-vertebral venous plexus posteriorly, the surrounding cortical bone, and any focal lytic or sclerotic lesion. A BMD measurement (in gm/cc) is derived by the software program, which was used as the main QCT outcome measure for comparison against the DXA T-score. Of note, the T-scores derived by the QCT software system were not considered, since these are not equivalent to T-scores derived by DXA and could potentially cause confusion.2, 9, 12
Figure 1. MDCT-based techniques for assessing bone mineral density at CTC screening.
A and B. Phantomless QCT technique: screen capture (A) of the phantomless QCT program and output shows the method of ROI placement for the vertebral body, muscle, and fat, shown here for the T12 level, which is then repeated for the L1–L5 levels. Each plane of measurement (B, yellow lines) is angled to be parallel with the end plates at that level. Note that the QCT-derived T-scores (and Z-scores) are blacked out and were not used in this study.
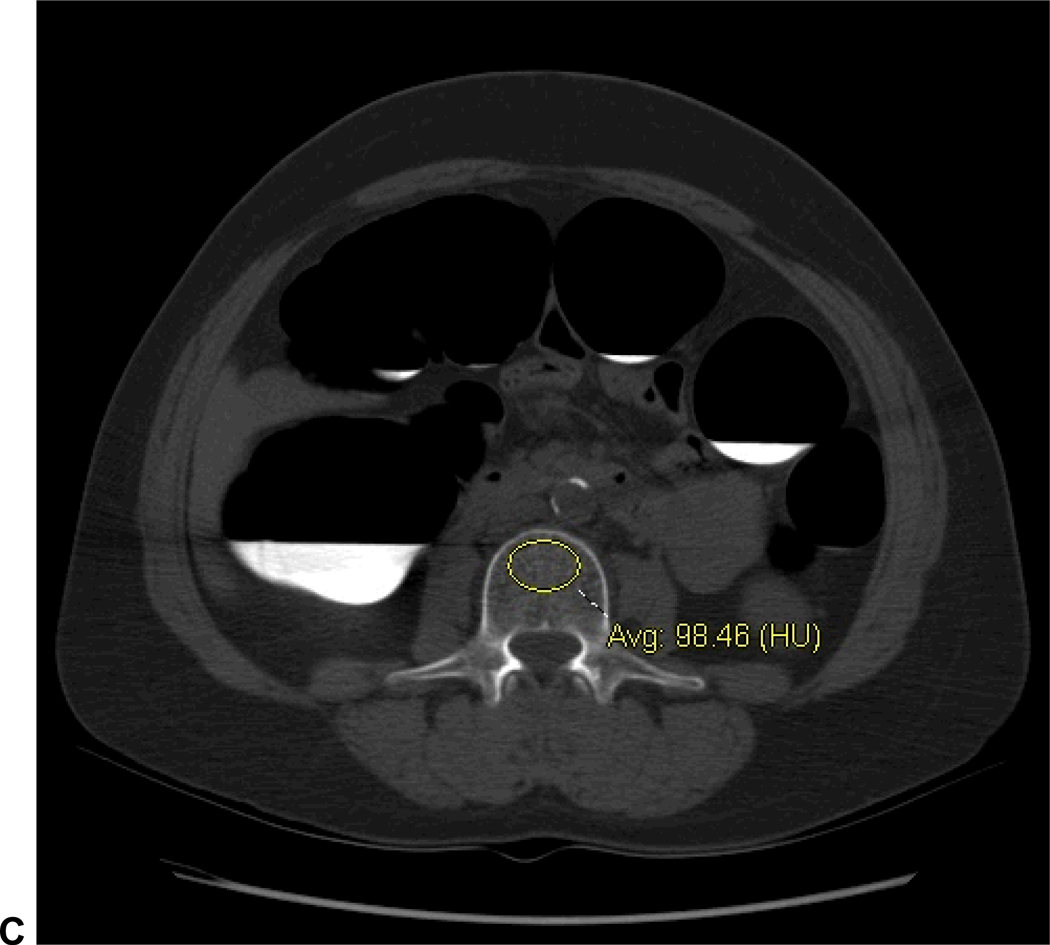
C. Simple ROI technique: standard transverse CTC image (same patient as in A) without oblique angulation shows ROI placement at the L3 level. Unlike QCT assessment, a single ROI placement at an individual level was considered as a primary outcome measure with this “simple” technique.
Note: images A and C are from a patient diagnosed with osteoporosis on DXA performed 4 days before CTC (L-spine T-score=−2.8). The QCT value of 69.2 mg/cc (circled in red) and the L3 vertebral attenuation of 98.5 HU are well below the thresholds derived in this study (see Table 1).
Simple Trabecular ROI Attenuation Technique
In addition to formal phantomless QCT, vertebral body attenuation at individual levels was also obtained using a trabecular ROI technique similar to QCT (Fig 1B), albeit without the initial step of plane angulation. The interpreting radiologist was again blinded to DXA results. We term this method as “simple” because it requires neither oblique angulation nor ROI placement in muscle and fat. Previous work has shown that non-angled measurements correlate well with the angled measurements.13 Furthermore, a single ROI measurement of mean attenuation (in HU) at an individual spinal level was considered the main outcome measure, which can be obtained much faster than the full T12-L5 QCT assessment. Simple ROI attenuation measurements were carried out on a standard PACS workstation (McKesson) as would be used for routine CT interpretation, with images viewed in a bone window setting (W:1200, L:350). Individual ROI measurements were performed from T12 through L5 to determine if there was an optimal level in terms of DXA correlation. The thicker 5-mm sections for extracolonic assessment were utilized for this “simple” ROI technique to better match with standard body CT scanning and promote more generalizable results. The thin section series (1.25 mm) were only used for the supine-prone precision comparison and for comparison with the thicker sections, as described below.
Assessment of Reproducibility
Reproducibility of CT-based results was assessed several ways, including supine versus prone comparison, thick (5-mm) versus thin (1.25 mm) section MDCT series, and inter-observer variability. For the subset of 45 cases where CTC and DXA screening exams were performed within one week of each other, QCT and simple ROI measurements were obtained on both the supine and prone MDCT series. For the remaining cases, only the supine series was utilized. This cohort of 45 cases was also used to compare the results for the simple ROI technique on the thick versus thin sections. To assess inter-observer variability of ROI measurements initially performed by the board-certified radiologist, an inexperienced 1st-year medical student repeated all T12-L5 measurements for the simple ROI technique (1,512 total measurements for comparison). For all ROI reproducibility measurements, the T12-L5ave value, calculated as the average attenuation in HU from T12 to L5 inclusive, was utilized for the main outcome measure to include data from all vertebral levels and to allow for more direct comparison of the simple ROI and QCT techniques.
Prevalent Compression Fractures
The sagittal lumbar spine reformations were assessed in each case for compression deformities involving T12-L5 by employing the Genant visual semi-quantitative method,14 which has been validated and is widely accepted for vertebral fracture assessment. Only moderate or severe compression deformities were recorded as positive to avoid ambiguity with mild borderline deformities. Of greatest interest are cases of unsuspected compression deformity detected at MDCT in patients without osteoporosis according to the DXA T-score, since these would effectively represent false-negative results for the reference standard.
Statistical Analysis
The diagnostic ability of phantomless QCT and simple ROI approaches with respect to the DXA T-score reference standard was assessed using ROC curve analysis, as well as threshold analysis to determine relevant cut-off values for osteoporosis detection (eg, 100% sensitivity for osteoporosis). MDCT performance against DXA T-score thresholds of −1.0 and −2.5 were used to derive areas under the curve (AUC) at ROC analysis. ROC analysis was performed against the primary referenced standard of the combined (L-spine and hip) central DXA T-score, but also for the L-spine and hip T-scores separately as a secondary analysis. Ninety-five percent confidence intervals (95% CI) were obtained for AUC measures. Multivariate logistic regression analysis was also performed to determine the best combination of vertebral level measurements for the ROI technique. Measurement precision was displayed on both simple scatterplot and Bland-Altman plots. Statistical calculations were performed in R (version 2.10.0, R Development Core Team, 2009). Study results are reported in accordance with STARD guidelines.15
Results
Threshold Analysis for Osteoporosis Detection
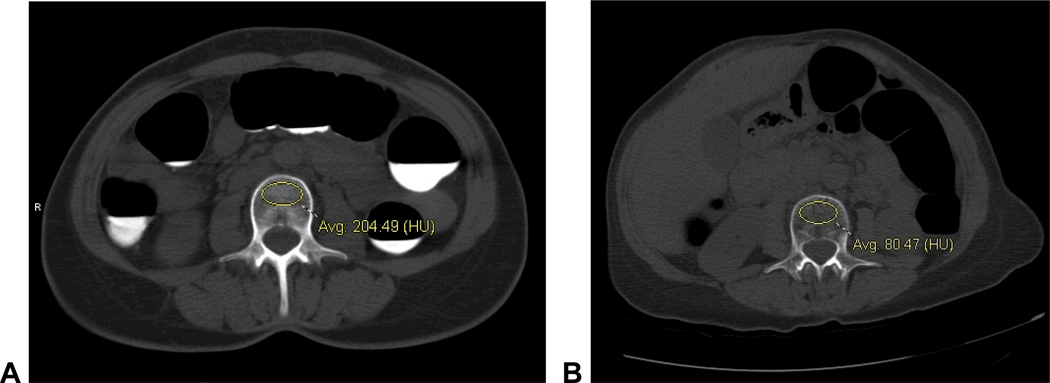
Table 1 shows the derived cut-off values for trabecular ROI attenuation at selected lumbar levels and for phantomless QCT that yield 100% sensitivity (29/29) for osteoporosis according to the DXA T-score reference standard. For example, using a trabecular ROI attenuation threshold of 160 HU at the L1 level yields 100% sensitivity for osteoporosis. With this 160 HU cut-off value at L1, 83.9% (125/149) of patients below this threshold had low BMD (osteoporosis or osteopenia) and 57.5% (59/103) above this threshold had normal a BMD at DXA. By employing different level-specific ROI HU threshold values, which is predictably lowest at L3 (130 HU) and gradually increases in value toward both the T12 and L5 levels, similar results are achieved for all other levels (Fig 2), including the T12-L5ave (Table). For phantomless QCT, a BMD threshold of 90 mg/cc also achieves 100% detection of osteoporosis. With this BMD cut-off for QCT, 87.2% (96/110) of patients below this threshold had low BMD and 49.6% (69/139) above this threshold had normal BMD at DXA. Specificity was relatively low when using these level-specific thresholds for maintaining 100% sensitivity, since patients with osteopenia below a given threshold are considered false positives in this calculation (Table). On average, patients were older and had a lower BMI below all the CT-based thresholds used to maintain 100% sensitivity for osteoporosis (Table)
Table 1.
QCT and ROI threshold values that yield 100% sensitivity for osteoporosis in 252 adults undergoing CTC screening
| Phantomless QCT |
L1 ROI |
L3 ROI |
T12-L5ave ROI |
|
|---|---|---|---|---|
| Threshold for 100% sensitivity for osteoporosis | 90 mg/cc | 160 HU | 130 HU | 145 HU |
| Sensitivity for osteoporosis | 100% (29/29) |
100% (29/29) |
100% (29/29) |
100% (29/29) |
| Specificity for osteoporosis (at 100% sensitivity threshold)* |
63.8% (143/224) |
46.4% (104/224) |
54.0% (121/224) |
53.1% (119/224) |
| % below threshold with low BMD at DXA** | 87.3% (96/110) |
83.9% (125/149) |
83.3% (110/132) |
84.3% (113/134) |
| % above threshold with normal BMD*** | 49.6% (69/139) |
57.3% (59/103) |
50.8% (61/120) |
50.8% (61/120) |
| Mean measurement (± SD) |
97.8 mg/cc (± 27.7 mg/cc) |
152.9 HU (± 38.3 HU) |
130.5 HU (± 38.6 HU) |
143.7 HU (± 36.7 HU) |
| Measurement range | 28–178 mg/cc | 62–291 HU | 41–245 HU | 59–254 HU |
| Mean patient age above/below threshold | 56.4 years/ 62.3 years |
55.7 years/ 61.2 years |
56.1 years/ 61.5 years |
56.1 years/ 61.5 years |
| Mean patient BMI above/below threshold | 26.7 kg/m2/ 25.4 kg/m2 |
26.6 kg/m2/ 25.8 kg/m2 |
26.8 kg/m2/ 25.5 kg/m2 |
26.9 kg/m2/ 25.4 kg/m2 |
Patients with osteopenia per DXA below each threshold is considered a false positive result
Low BMD = osteoporosis or osteopenia
By definition, the remaining patients with low BMD above this threshold had only osteopenia at DXA – not osteoporosis
Figure 2. Normal and abnormal L3 vertebral attenuation measurements using the simple ROI method.
A. Non-angled transverse CTC image with vertebral ROI at the L3 level shows a trabecular attenuation of 204.5 HU, well above the 145 HU level-specific threshold for 100% osteoporosis sensitivity (Table 1). L-spine DXA T-score was 0.6.
B. L3 vertebral ROI shows an attenuation of 80.5 HU in a patient with osteoporosis at DXA (L-spine T-score=−2.9), which is well below the 145 HU threshold.
ROC Analysis for Correlation with DXA T-Scores
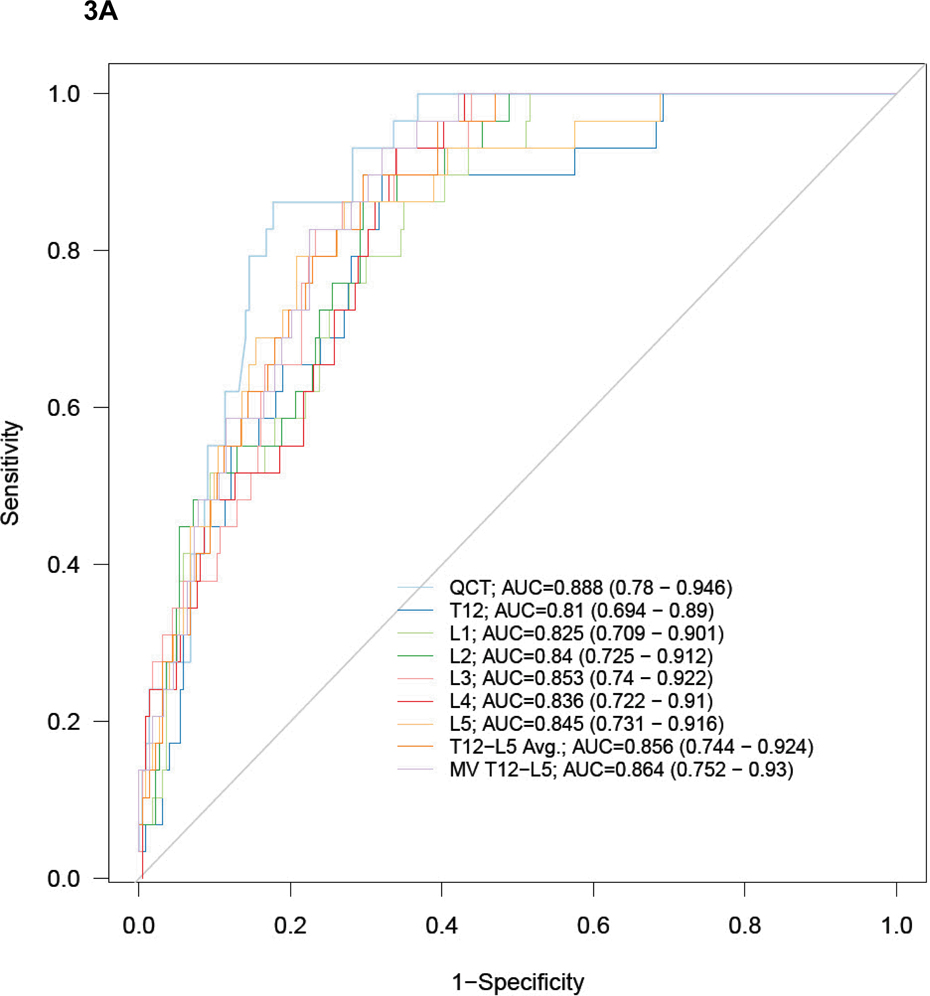
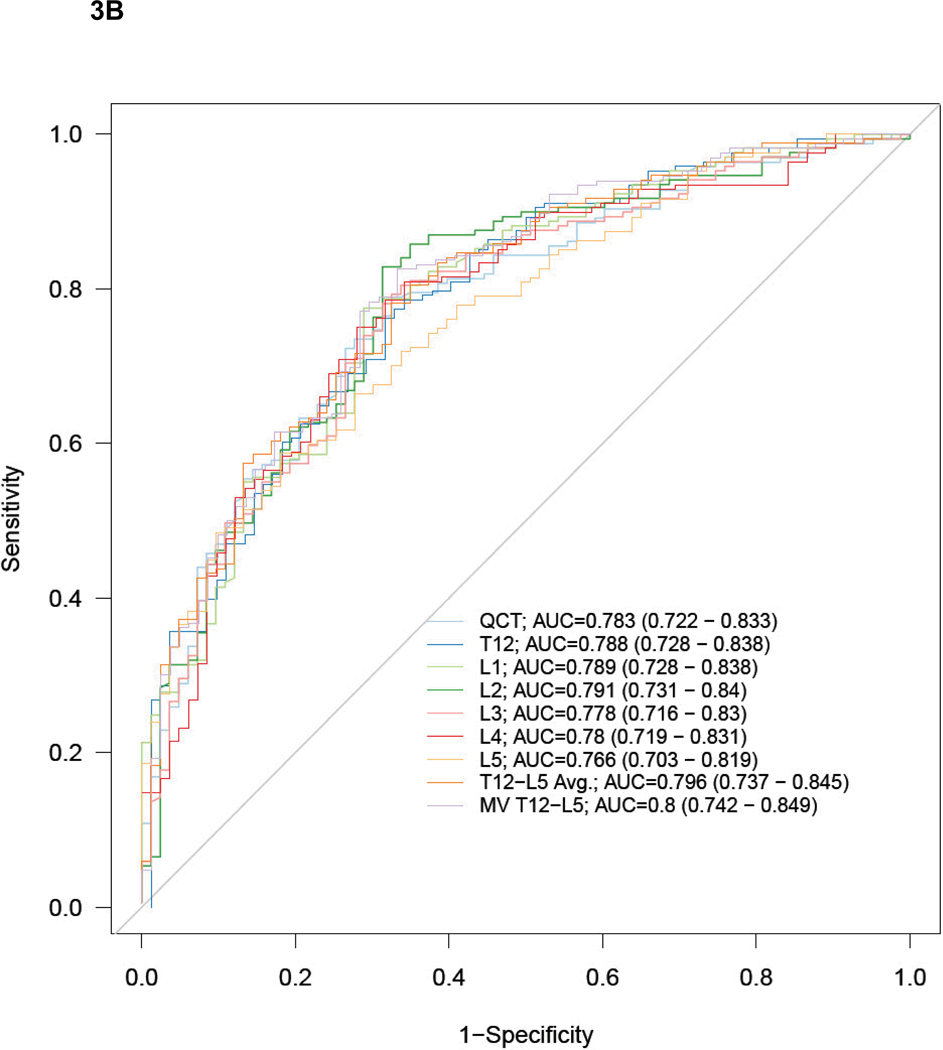
Figure 3 show the ROC curves and AUC results for predicting a DXA T-scores of −2.5 or lower (osteoporosis, Fig 3A), and −1.0 or lower (low BMD, Fig 3B). There were no significant differences in performance among the single vertebral levels, the T12-L5ave, or the best multivariate model for simple ROI attenuation, or for the QCT results (Fig 3). At the L1 level, the AUC for the simple ROI technique was 0.825 (95% CI: 0.709–0.901) for osteoporosis and 0.789 (95% CI: 0.728–0.838) for low BMD. For phantomless QCT, the AUC was 0.888 (95% CI: 0.780–0.946) for osteoporosis and 0.783 (95% CI: 0.722–0.833) for low BMD. The remaining AUC results for the simple ROI technique at other vertebral levels, as well as for T12-L5ave and the best multivariate model, are shown in Figure 3.
Figure 3. ROC curves for predicting DXA T-scores for osteopenia/osteoporosis with MDCT attenuation techniques.
ROC curves for phantomless QCT and simple ROI MDCT methods for detecting DXA T-scores of −2.5 or lower (A, osteoporosis) and −1.0 or lower (B, low BMD – osteopenia and osteoporosis). AUC values (with 95% CI) are shown for each method and level (MV = best multivariate model). Note how similar the performance is, regardless of specific ROI approach, with sizable overlap of all 95% confidence intervals.
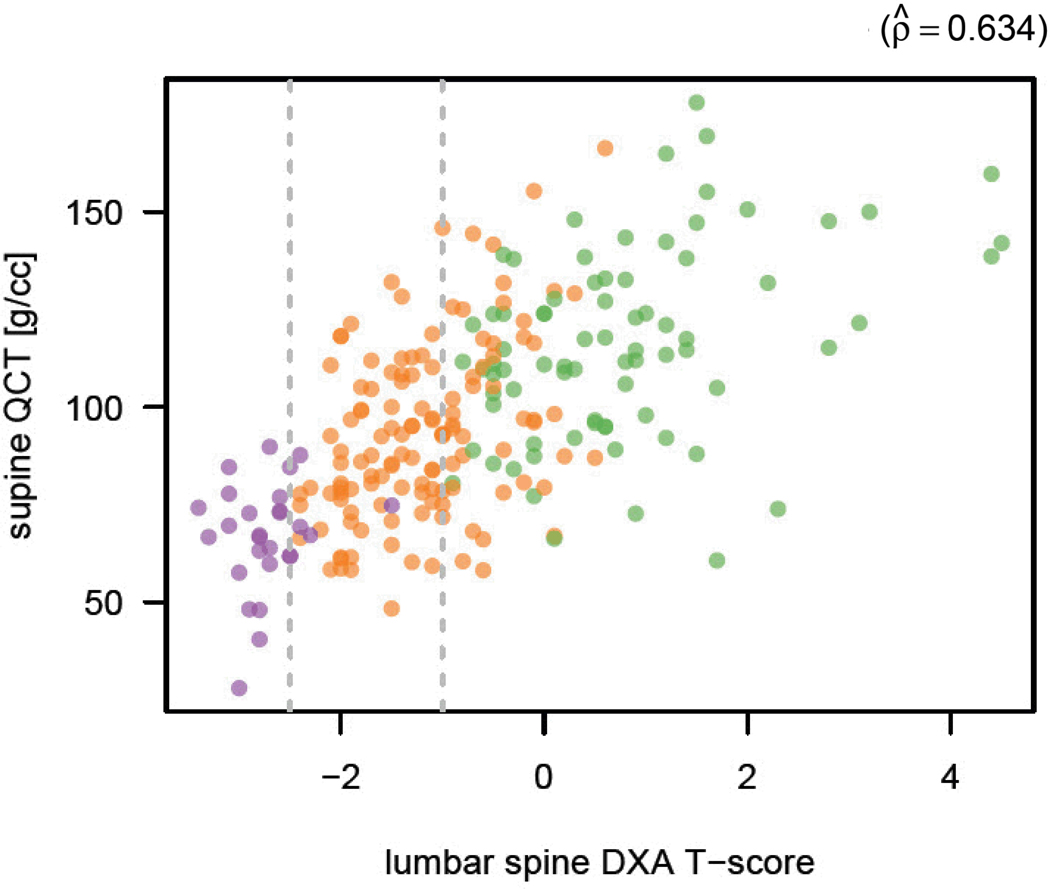
Secondary ROC analysis separating the L-spine and hip T-scores into isolated reference standards showed that diagnostic performance for all the CT-based measures was better using the L-spine T-score reference standard. For osteoporosis, the AUC range was 0.838–0.894 using the L-spine reference standard and was 0.764–0.860 using the hip. For osteopenia, the AUC range using the L-spine and hip T-scores was 0.772–0.811 and 0.736–0.768, respectively. The combined (primary) reference standard results for both osteoporosis and osteopenia were intermediate between these separate L-spine and hip results, as shown in Figure 3. Figure 4 shows a simple scatterplot of QCT BMD results compared with L-spine DXA results.
Figure 4. Scatterplot of BMD results at QCT compared with L-spine DXA T-scores.
Simple scatterplot shows BMD at QCT against L-spine DXA T-score. Patients with osteoporosis, osteopenia, and normal BMD according to central DXA T-score are depicted in purple, orange, and green, respectively. The Pearson product-moment correlation is 0.634.
Reproducibility Measures
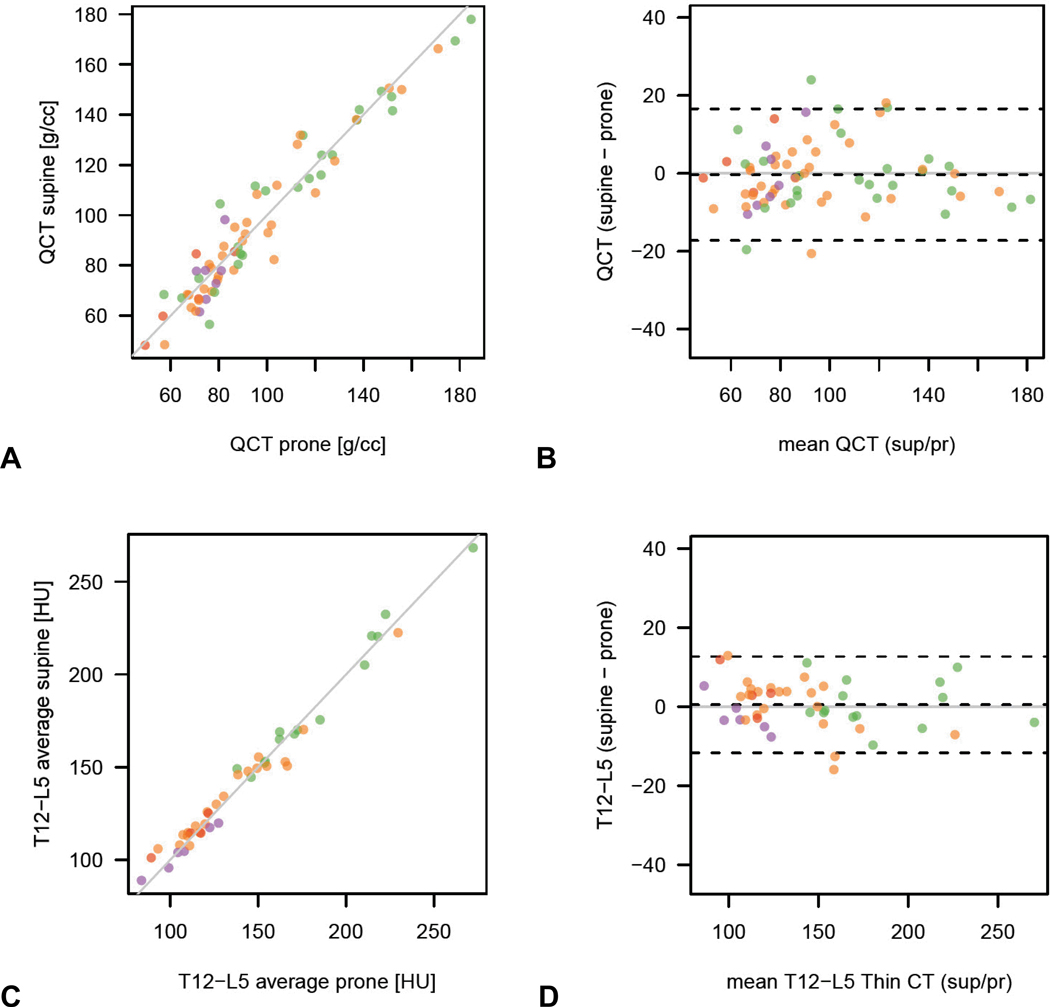
The reproducibility of measurement between the supine and prone series for the simple ROI attenuation technique and phantomless QCT are shown in Fig 5. As seen from both the simple scatterplots and Bland-Altman plots, supine-prone matching appears to be better with the simple trabecular ROI method compared with phantomless QCT. ROI attenuation measurement reproducibility between the thick (5-mm) and thin (1.25 mm) section MDCT series was also reliable (results not shown), indicating that either series can be used.
Figure 5. Reproducibility of MDCT attenuation techniques using supine and prone series as internal controls.
Simple and Bland-Altman plots for the phantomless QCT technique (A and B) and the simple ROI technique (C and D) in 45 patients who underwent DXA and CTC within 7 days of each other show slightly better reproducibility for the simple ROI vertebral method. (Note: purple dots = osteoporosis, orange dots = osteopenia, and green dots = normal BMD at DXA according to T-scores).
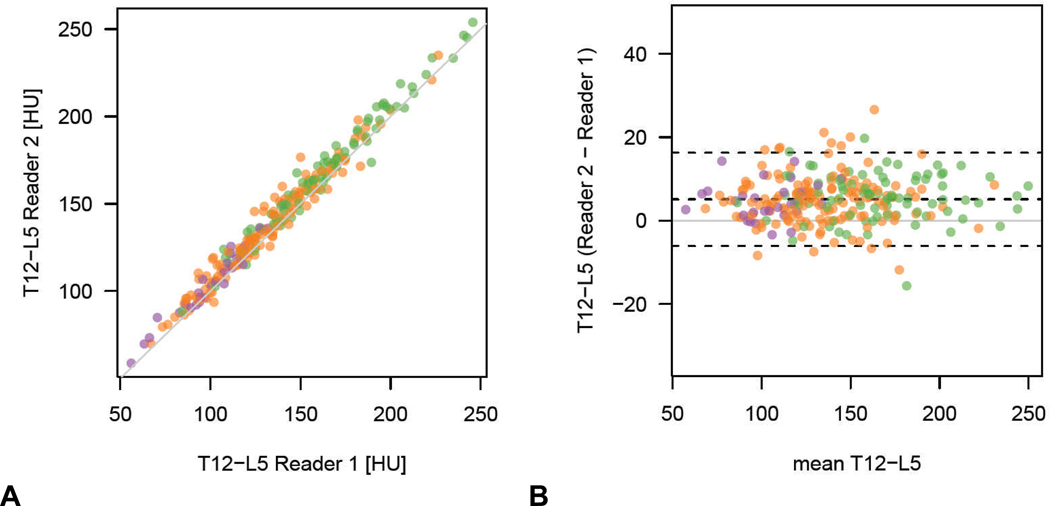
The Bland-Altman 95% limits of agreement of vertebral ROI attenuation between the two readers ranged from −6.1 to 16.3 HU for T12-L5ave (Figure 6). For all levels tested, no cases of osteoporosis were incorrectly placed above the established ROI threshold for 100% sensitivity by the inexperienced second reader.
Figure 6. Inter-observer measurement variability for simple ROI method.
Simple (A) and Bland-Altman (B) plots show good reproducibility for trabecular attenuation measurement between the board-certified radiologist and the inexperienced 1st-year medical student (T12-L5ave shown). Note that all cases with osteoporosis according to DXA T-score (purple dots) are within the 95% limits of agreement, without any outliers.
Prevalent compression fractures
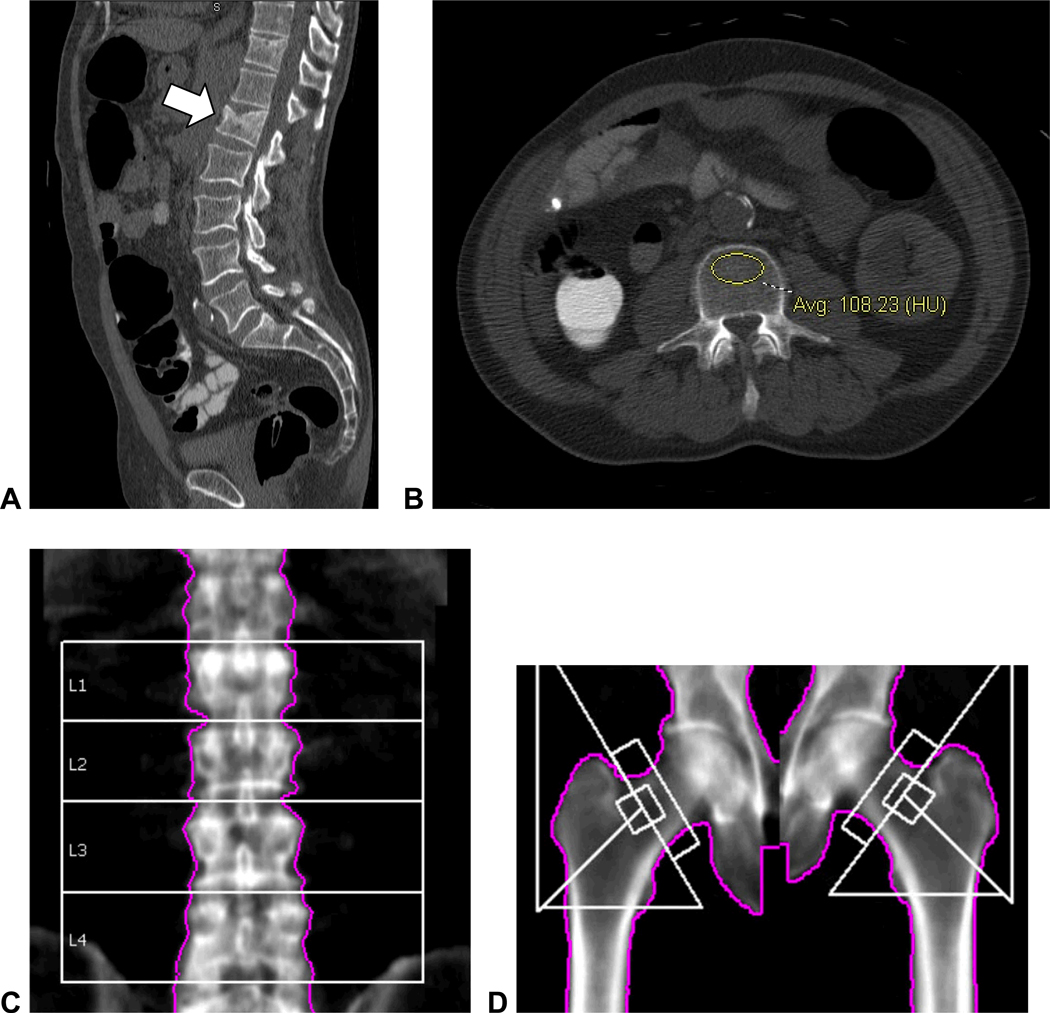
Using the Genant visual semi-quantitative method, three patients without osteoporosis according to DXA T-scores had unsuspected moderate lumbar compression deformities on the sagittal MDCT reconstructions (Fig 7).
Figure 7. Unsuspected moderate L1 compression deformity in 60-year-old man with abnormally low vertebral attenuation but without osteoporosis by DXA.
Sagittal reconstruction of supine CTC series (A) shows a moderate compression fracture at the L1 level. Vertebral attenuation was abnormally low at all levels (B, 108 HU at L3) except for L1 (173 HU, not shown) due to the compression deformity itself. The reported T-scores at central DXA were 0.2 for L1–L4 (C) and −1.1 for the left femoral neck (D). Increased density at L1 level at DXA in C was attributed to degenerative changes.
Discussion
Our results suggest that valuable information pertaining to vertebral BMD assessment is currently going unused at CTC screening, as well as other noncontrast abdominal CT examinations. By applying either phantomless QCT analysis or even single-level ROI measurement to noncontrast CT studies, we can identify individuals at risk for osteoporosis, as well those who are not. We acknowledge that DXA BMD measurement is imperfect for fracture risk prediction, but believe it appropriate to frame all CT-based results in terms of the DXA T-scores, since this represents the necessary reference standard because of the WHO definition of osteoporosis.2 For individuals at risk that fall below our derived CT-based thresholds for 100% sensitivity for osteoporosis, formal DXA evaluation would likely be warranted. This opportunistic approach that effectively piggy-backs lumbar spine assessment at CTC screening requires no additional scanning, radiation, or costs, all of which may limit the use of QCT as a primary screening test for osteoporosis. Furthermore, use of the simple ROI technique (eg, at L1) entails only minimal effort from the radiologist, with a negligible investment of interpretation time.
Osteoporosis represents a major public health issue and there is a growing appreciation of the need for wider screening efforts. The recently revised and expanded recommendations by the USPSTF underscore the need for more screening.16 Although a number of investigators have suggested that QCT may in fact be better than DXA for BMD assessment,17–23 DXA nonetheless remains the defining test for osteoporosis and our work does not seek to change this. T-scores derived from tests other than DXA, such as quantitative CT and ultrasound, cannot be applied to the WHO diagnostic classification and are not currently applicable to FRAX.2 However, by harnessing the attenuation data contained within routine CT scans, we may be able to make a positive impact in terms of “opportunistic” screening, with little or no down side, and more efficient use of existing resources. Body CT is a common procedure in the U.S., with an estimated 25 million scans in adults covering the chest and/or abdomen performed each year.24 Even if just a small fraction of these cases were captured for opportunistic BMD screening, the overall impact could be substantial. Although it is difficult to predict the net effect on the overall number of DXA screening exams, the percentage of cases positive for osteoporosis would likely increase, further improving cost-effectiveness.
We initially sought to compare only the phantomless QCT against the DXA reference standard. Previous studies with phantomless QCT have demonstrated high precision and opened the door for QCT assessment without the use of an external phantom.25, 26 However, our preliminary investigations suggested that simple trabecular ROI measurement of the lumbar spine, without the use of fat and muscle as internal controls, plane angulation, or formal derivation of BMD values or T-scores yielded results that were similar to phantomless QCT. By including this “simple” ROI technique in this work, we have shown that non-angled ROI attenuation measurement at a single lumbar level provides for rapid assessment that is equivalent to the full multi-level phantomless QCT approach in terms of predicting the DXA T-score. In fact, reproducibility of results between the supine and prone series in our study was better with the simple ROI technique compared with QCT. This may relate to wider variations in fat and muscle attenuation, which might impact the phantomless QCT results. Fully-automated volumetric trabecular bone measurement at CT represents another attractive potential solution. Preliminary research has demonstrated good reproducibility with this non-operator-dependent approach.4
Although single-level vertebral assessment is discouraged at DXA2 and may strike some as a gross oversimplification, this approach is better suited to CT attenuation measurement due to the high level of anatomic detail and ability to directly measure representative regions of trabecular bone. However, due to the known differences in BMD and therefore CT attenuation at different lumbar levels, which are lowest at L3, level-specific thresholds are required. It should also be noted that our results apply only to non-contrast CT as we did not study the effect of IV contrast. It is likely that higher ROI threshold values for osteoporosis would be needed to account for enhancement of the vertebral body, although one small-cohort QCT study did not find a significant difference.27 The impact on phantomless QCT measurement would presumably be more complex due to the differences in contrast enhancement of bone, muscle, and fat.
Until better understood, the use of CT attenuation data for BMD assessment may raise potential management issues when discordant with the DXA results. For example, approximately 15% of adults below the threshold for 100% osteoporosis detection will have a normal T-score reported at central DXA. Because the CT-based techniques are a direct measure of trabecular bone, whereas DXA is a planar technique confounded by cortical bone and degenerative changes, one could argue that the CT results may better reflect the true BMD status of the patient. Of course, when an unsuspected lumbar compression fracture is identified at CT (or other VFA technique) in a patient without osteoporosis according to their DXA T-score, the fracture finding strongly influences both diagnosis and treatment, as seen with the FRAX fracture risk assessment tool.28 In a significant fraction of cases (8% in the current series), the lumbar T-score will not be reported at DXA, typically due to prominent degenerative changes. This is of course not an issue at CT due to its cross-sectional nature that provides for direct trabecular assessment.
BMD assessment adds to the growing list of serendipitous “extracolonic” screening opportunities at CTC beyond the colorectal evaluation alone, which is of proven value.5, 7, 29 Simultaneous screen detection of unsuspected abdominal aortic aneurysms and extracolonic cancers are recognized benefits of CTC,30, 31 which further enhance its cost-effectiveness.32 Further investigation is needed to assess the potential positive impact that routine osteoporosis screening at CTC might convey. Additional opportunities associated with the extracolonic information available at CTC include measurement of visceral fat, liver attenuation, and abdominal aortic calcification. With respect to musculoskeletal data at CTC beyond the lumbar spine, evaluation of the femoral neck has been largely untouched, as is the case with muscle evaluation for sarcopenia.33, 34 Although much of the attention related to extracolonic evaluation at CTC screening was initially focused on the potential negative impact, perhaps due to lingering concerns from the whole-body CT screening debacle, we anticipate continued investigations into more ways to add value well beyond colorectal cancer screening.
Our study has some limitations. This is a retrospective, single-center study. The thresholds and diagnostic performance measures (sensitivity, specificity, AUC) are study-dependent and require larger cohorts and external validation. The study cohort was relatively young in terms of osteoporosis screening, with a low prevalence of compression fractures. Assessment of an older, more enriched cohort might improve the performance of the CT-based measures. By choosing CT-based thresholds that are 100% sensitive for detecting DXA-defined osteoporosis, the specificity values are quite low, with nearly half of cases below the various thresholds with osteopenic BMD and sometimes even normal. If imperfect sensitivity values were felt to be more appropriate (eg, 80% or 90%), the specificity would improve. However, by using this opportunistic CT data, the number of normal DXA studies would be decreased. The impact of intravenous contrast on trabecular bone measurement at CT was not assessed in this study and further investigation is also warranted. Although this opportunistic strategy of incidental osteoporosis screening at CT would conceivably reduce the number of unnecessary DXA studies, and thus reduce costs, these savings were not assessed formally.
In conclusion, our study shows that both phantomless QCT and simple ROI attenuation measurements of the lumbar spine are effective for BMD screening at non-contrast CT, with high sensitivity for osteoporosis as defined by the DXA T-score. Single-level ROI vertebral attenuation measurement at CTC is reproducible, requires little effort, and adds no radiation or costs but can provide valuable BMD data for osteoporosis screening. This approach could potentially be applied at the L1 level to any non-contrast CT of the chest and/or abdomen, harnessing data that currently goes unused in routine clinical practice. Additional large-scale validation is required before more widespread use in other body CT applications can be advocated, particularly for studies employing IV contrast.
Acknowledgments
Funding: This research was supported in part by the National Institutes of Health (grant 1R01CA144835-01)
Footnotes
Conflict of Interest:
Dr. Pickhardt serves as a consultant for Medicsight, Viatronix, Bracco, and Check Cap; and is co-founder of VirtuoCTC. Dr. Summers receives royalties and research support from iCAD, and owns stock in Johnson & Johnson. Binkley is a consultant for Merck, Amgen, Lilly, and Tarsa. All other authors have no conflicts of interest.
References
- 1.Pickhardt PJ, Choi JR, Hwang I, Schindler WR. Nonadenomatous polyps at CT colonography: Prevalence, size distribution, and detection rates. Radiology. 2004;232:784–790. doi: 10.1148/radiol.2323031614. [DOI] [PubMed] [Google Scholar]
- 2.Lewiecki EM, Gordon CM, Baim S, et al. International Society for Clinical Densitometry 2007 Adult and Pediatric Official Positions. Bone. 2008;43:1115–1121. doi: 10.1016/j.bone.2008.08.106. [DOI] [PubMed] [Google Scholar]
- 3.National Osteoporosis Foundation. [Accessed June 17, 2010]; at http://www.nof.org/ [Google Scholar]
- 4.Summers RM, Baecher N, Yao J, et al. Feasibility of simultaneous CT colonography and fully-automated bone mineral densitometry in a single examination. J Comput Assist Tomogr. doi: 10.1097/RCT.0b013e3182032537. in press. [DOI] [PMC free article] [PubMed] [Google Scholar]
- 5.Kim DH, Pickhardt PJ, Taylor AJ, et al. CT colonography versus colonoscopy for the detection of advanced neoplasia. New England Journal of Medicine. 2007;357:1403–1412. doi: 10.1056/NEJMoa070543. [DOI] [PubMed] [Google Scholar]
- 6.Pickhardt PJ. Screening CT colonography: how I do it. AJR Am J Roentgenol. 2007;189:290–298. doi: 10.2214/AJR.07.2136. [DOI] [PubMed] [Google Scholar]
- 7.Pickhardt PJ, Choi JR, Hwang I, et al. Computed tomographic virtual colonoscopy to screen for colorectal neoplasia in asymptomatic adults. New England Journal of Medicine. 2003;349:2191–2200. doi: 10.1056/NEJMoa031618. [DOI] [PubMed] [Google Scholar]
- 8.BLINDED [Google Scholar]
- 9.Engelke K, Adams JE, Armbrecht G, et al. Clinical use of quantitative computed tomography and peripheral quantitative computed tomography in the management of osteoporosis in adults: The 2007 ISCD Official Positions. Journal of Clinical Densitometry. 2008;11:123–162. doi: 10.1016/j.jocd.2007.12.010. [DOI] [PubMed] [Google Scholar]
- 10.Adams JE. Quantitative computed tomography. European Journal of Radiology. 2009;71:415–424. doi: 10.1016/j.ejrad.2009.04.074. [DOI] [PubMed] [Google Scholar]
- 11.Steiger P, Block JE, Steiger S, et al. Spinal bone mineral density measured with quantitiative CT - effect of region of interest, vertebral level, and technique. Radiology. 1990;175:537–543. doi: 10.1148/radiology.175.2.2326479. [DOI] [PubMed] [Google Scholar]
- 12.Raisz LG. Screening for osteoporosis. New England Journal of Medicine. 2005;353:164–171. doi: 10.1056/NEJMcp042092. [DOI] [PubMed] [Google Scholar]
- 13.Link TM, Koppers BB, Licht T, Bauer J, Lu Y, Rummeny EJ. In vitro and in vivo spiral CT to determine bone mineral density: Initial experience in patients at risk for osteoporosis. Radiology. 2004;231:805–811. doi: 10.1148/radiol.2313030325. [DOI] [PubMed] [Google Scholar]
- 14.Genant HK, Wu CY, Vankuijk C, Nevitt MC. Vertebral fracture assessment using a semiquantitative technique. Journal of Bone and Mineral Research. 1993;8:1137–1148. doi: 10.1002/jbmr.5650080915. [DOI] [PubMed] [Google Scholar]
- 15.Bossuyt PM, Reitsma JB, Bruns DE, et al. Towards complete and accurate reporting of studies of diagnostic accuracy: The STARD initiative. Ann Intern Med. 2003;138:40–44. doi: 10.7326/0003-4819-138-1-200301070-00010. [DOI] [PubMed] [Google Scholar]
- 16.Nelson HD, Haney EM, Dana T, Bougatsos C, Chou R. Screening for Osteoporosis: An Update for the US Preventive Services Task Force. Ann Intern Med. 2010;153 doi: 10.7326/0003-4819-153-2-201007200-00262. 99-W43. [DOI] [PubMed] [Google Scholar]
- 17.Guglielmi G. Quantitative computed tomography (QCT) and dual x-ray absorptiometry (DXA) in the diagnosis of osteoporosis. European Journal of Radiology. 1995;20:185–187. doi: 10.1016/0720-048x(95)00647-9. [DOI] [PubMed] [Google Scholar]
- 18.Guglielmi G, Grimston SK, Fischer KC, Pacifici R. Osteoporosis - diagnosis with lateral and posteroanterior dual x-ray absorptiometry compared with quantitative CT. Radiology. 1994;192:845–850. doi: 10.1148/radiology.192.3.8058958. [DOI] [PubMed] [Google Scholar]
- 19.Pacifici R, Rupich R, Griffin M, Chines A, Susman N, Avioli LV. Dual energy radiography versus quantitative computer tomography for the diagnosis of osteoporosis. Journal of Clinical Endocrinology & Metabolism. 1990;70:705–710. doi: 10.1210/jcem-70-3-705. [DOI] [PubMed] [Google Scholar]
- 20.Rehman Q, Lang T, Modin G, Lane NE. Quantitative computed tomography of the lumbar spine, not dual X-ray absorptiometry, is an independent predictor of prevalent vertebral fractures in postmenopausal women with osteopenia receiving long-term glucocorticoid and hormone-replacement therapy. Arthritis and Rheumatism. 2002;46:1292–1297. doi: 10.1002/art.10277. [DOI] [PubMed] [Google Scholar]
- 21.Weigert JM. QCT, the most accurate method of measuring bone mineral density? Journal of Bone and Mineral Research. 1997;12:1954–1955. doi: 10.1359/jbmr.1997.12.11.1954. [DOI] [PubMed] [Google Scholar]
- 22.Yu W, Gluer CC, Fuerst T, et al. Influence of degenerative joint disease on spinal bone mineral measurements in postmenopausal women. Calcif Tissue Int. 1995;57:169–174. doi: 10.1007/BF00310253. [DOI] [PubMed] [Google Scholar]
- 23.Yu W, Gluer CC, Grampp S, et al. Spinal bone mineral assessment in postmenopausal women: A comparison between dual X-ray absorptiometry and quantitative computed tomography. Osteoporosis Int. 1995;5:433–439. doi: 10.1007/BF01626604. [DOI] [PubMed] [Google Scholar]
- 24.IMV 2006 CT Market Summary Report. Des Plains, IL: IMV Medical Information Division; 2006. [Google Scholar]
- 25.Boden SD, Goodenough DJ, Stockham CD, Jacobs E, Dina T, Allman RM. Precise measurement of vertebral bone density using computed tomography without the use of an external reference phantom. J Digit Imaging. 1989;2:31–38. doi: 10.1007/BF03168013. [DOI] [PubMed] [Google Scholar]
- 26.Gudmundsdottir H, Jonsdottir B, Kristinsson S, Johannesson A, Goodenough D, Sigurdsson G. Vertebral bone density in Icelandic women using quantitative computed tomography without an external reference phantom. Osteoporosis Int. 1993;3:84–89. doi: 10.1007/BF01623378. [DOI] [PubMed] [Google Scholar]
- 27.Hopper KD, Wang MP, Kunselman AR. The use of clinical CT for baseline bone density assessment. J Comput Assist Tomogr. 2000;24:896–899. doi: 10.1097/00004728-200011000-00015. [DOI] [PubMed] [Google Scholar]
- 28.Kanis JA, Johnell O, Oden A, Johansson H, McCloskey E. FRAX (TM) and the assessment of fracture probability in men and women from the UK. Osteoporosis Int. 2008;19:385–397. doi: 10.1007/s00198-007-0543-5. [DOI] [PMC free article] [PubMed] [Google Scholar]
- 29.Johnson CD, Chen MH, Toledano AY, et al. Accuracy of CT colonography for detection of large adenomas and cancers. New England Journal of Medicine. 2008;359:1207–1217. doi: 10.1056/NEJMoa0800996. [DOI] [PMC free article] [PubMed] [Google Scholar]
- 30.Pickhardt PJ, Hanson ME, Vanness DJ, et al. Unsuspected extracolonic findings at screening CT colonography: clinical and economic impact. Radiology. 2008;249:151–159. doi: 10.1148/radiol.2491072148. [DOI] [PubMed] [Google Scholar]
- 31.Pickhardt PJ, Meiners RJ, Kim DH, Cash BD. Unsuspected cancers detected at CT colonography screening in over 10,000 asymtpomatic adults; Annual meeting for the Society of Gastrointestinal Radiologists; 2009; 2009. [Google Scholar]
- 32.Hassan C, Pickhardt P, Laghi A, et al. Computed tomographic colonography to screen for colorectal cancer, extracolonic cancer, and aortic aneurysm. Arch Intern Med. 2008;168:696–705. doi: 10.1001/archinte.168.7.696. [DOI] [PubMed] [Google Scholar]
- 33.Walsh MC, Hunter GR, Livingstone MB. Sarcopenia in premenopausal and postmenopausal women with osteopenia, osteoporosis and normal bone mineral density. Osteoporosis Int. 2006;17:61–67. doi: 10.1007/s00198-005-1900-x. [DOI] [PubMed] [Google Scholar]
- 34.Zerbini CA, Pippa MG. Sarcopenia in ageing men with osteopenia, osteoporosis and normal bone mineral density. Journal of Bone and Mineral Research. 2007;22:W264. [Google Scholar]


