Abstract
Since people with low status are more likely to experience social evaluative threat and are therefore more inclined to monitor for these threats and inhibit approach behaviour, we expected that low-status subjects would be more engaged in evaluating their own performance, compared with high-status subjects. We created a highly salient social hierarchy based on the performance of a simple time estimation task. Subjects could achieve high, middle or low status while performing this task simultaneously with other two players who were either higher or lower in status. Subjects received feedback on their own performance, as well as on the performance of the other two players simultaneously. Electroencephalography (EEG) was recorded from all three participants. The results showed that medial frontal negativity (an event-related potential reflecting performance evaluation) was significantly enhanced for low-status subjects. Implications for status-related differences in goal-directed behaviour are discussed.
Keywords: status, power, ERP, MFN, FRN, PCA
INTRODUCTION
Social hierarchies feature prominently in a large variety of animal species (Boehm, 1999), including humans, and are found to be an important organizing principle in most cultures (Sidanius and Pratto, 2001). In animals, but also in humans, social status strongly predicts well-being, morbidity and even survival (Sapolsky, 2004). Be it in domestic, professional or recreational settings, status looms large and defines implicit expectations and action predispositions that drive appropriate (social) behaviour (Cummins, 2000). Recent work by social scientists has begun to tackle this topic, elucidating behavioural differences between low- and high-status individuals. More specifically, this line of research has focused on the effects of social power. Although power and status are conceptually different, they almost always go hand in hand, which is why we will use these terms interchangeably here.
One of the more prominent theories in this field holds that high status and power are associated with approach behaviour, while low power is related to inhibitory behaviour (Keltner et al., 2003). Perspectives on approach and inhibition behaviour have been shaped to a large extent by the theory postulated by Gray (1987) that proposes two interacting motivational systems: the behavioural approach system (BAS) and the behavioural inhibition system (BIS). While the BAS regulates behaviour associated with rewards, such as the acquisition of food, sex and money, the BIS acts as an alarm system that is triggered by signals of potential punishment and inhibits behaviour that may lead to aversive or harmful outcomes. Although research has largely focused on individual (trait) differences in approach and inhibition (e.g. Carver and White, 1994), Keltner and colleagues (2003) proposed that social status can also influence the relative balance between approach and inhibition. Their theory states that high power activates approach-related processes, while low power activates inhibitory processes. The reason for this, they propose, is that power is associated with optimal access to rewards. Powerful people more often than not find themselves in environments offering many potential rewards, making it easier for them to approach these rewards. In addition, the powerful are less dependent on others to acquire these rewards, making it easier for those with high status to act in ways that enable them to obtain rewards. For complementary reasons, those with low status are more inclined to inhibit approach behaviour. These low-status individuals lack access to material and social resources and experience more social threat and punishments, especially the threat of being evaluated unfavourably by those having higher status. Because the environment of people with low status is characterized by a high degree of threat and limited access to rewards, they are more inclined to inhibit reward-seeking approach behaviour. In support of this theory, we have previously shown that the experience of power directly activates the motivational systems in the brain that regulate approach behaviour (Boksem et al., 2011c). High-status subjects showed a greater relative activation of left frontal–cortical areas, which have been specifically related to approach behaviour (e.g. Harmon-Jones, 2003), and have been associated with a stronger bias to respond to reward related cues (Pizzagalli et al., 2005).
Together, these findings suggest that social status has a profound effect on how people monitor their environment and evaluate their own performance: while high-status subjects are more focused on (rewarding) outcomes, low-status subjects are more inclined to evaluate outcomes in terms of potential (social) threat and losses.
This evaluation of performance is reflected by a family of negative-going event-related potentials (ERPs) that are elicited both when subjects commit errors [error-related negativity (ERN); Falkenstein et al., 1990], as well as when subjects receive negative performance feedback [feedback-related negativity (FRN); Miltner et al., 1997]. These ERP components have been suggested to be associated with common underlying neural processes (Nieuwenhuis et al., 2004), and for convenience, we will refer to these components as medial frontal negativity (MFN; Gehring and Willoughby, 2002). We have previously found (Boksem et al., 2006, 2008) that, while subjects with high BAS-scores displayed a large MFN in the context of potential rewards that could be earned, subjects with high BIS-scores displayed a large MFN in the context of potential losses. Therefore, we proposed that the MFN reflects a motivational/affective evaluation of performance outcomes: the MFN may reflect the subjective importance of action outcomes for an individual (see also Gehring and Willoughby, 2002; Pailing and Segalowitz, 2004; Hajcak et al., 2005; Yu et al., 2007; Tops and Boksem, 2010).
More specifically, we have argued that MFN amplitudes are most dependent on how concerned subjects are over making mistakes, especially in a social context. Indeed, both measures of negative affectivity (i.e. anxiety, neuroticism) and positive affectivity (i.e. agreeableness; Deneve and Cooper, 1998) have been shown to affect MFN amplitude while they are also related to concerns over social evaluation (e.g. Tops et al., 2006). The most salient feedback signals are of a social nature, and negative social evaluation is probably one of the most potent ones, leading to strong physiological responses (Dickerson and Kemeny, 2004). Indeed, the MFN, BIS and cortisol levels have all been related to social evaluative threat (Hajcak et al., 2005; Cavanagh and Allen, 2008; Tops and Boksem, 2011). Importantly, the Anterior Cingulate Cortex (ACC; the putative source of the MFN) has been shown to be involved in processing ‘error’ signals from the social environment such as potential loss of social resources: exclusion, rejection and the experience of shame and guilt (Shin et al., 2000; Eisenberger et al., 2003; Kross et al., 2007).
Since people with low status are more likely to experience social evaluative threat (e.g. Fiske, 1993; Anderson and Berdahl, 2002) and are consequently more inclined to monitor for these threats and inhibit approach behaviour (Keltner et al., 2003), we would expect that, particularly in a hierarchical social context, low-status individuals will be more engaged in evaluating their own performance (i.e. display a larger MFN), compared with high-status individuals. This is what we set out to investigate in the present study.
METHOD
Thirty-six healthy participants (seven males), between 17 and 32 (M = 20.9, s.d. = 4.2) years of age, were recruited from the university population. Subjects were invited to the lab three at a time. Upon arrival, they were informed that they were to play an interactive game with the other participants present in the lab and that we would be recording Electroencephalography (EEG) from all of them. To make sure that differences in status were not confounded with baseline differences in approach motivation [which has been shown to be related to both MFN amplitudes and social power (Boksem et al., 2006, 2011)], we administered the BIS/BAS-scale developed by Carver and White (1994).
The social ranking we created was based on the performance in a simple time estimation reaction time task that subjects performed individually (we will refer to this part of the experiment as the ‘rank-inducing session’; see Zink et al., 2008). At the start of each trial, a blue circle was presented that changed colour to green after 2–2.5 s. It was the participants’ job to press the response button exactly 1 s after the circle had turned green. Responses were considered correct when they were within a certain allowable time interval. Subsequently, subjects received feedback on their performance: a smiley face when they responded within the allowable time interval or a sad face when they responded too fast or too slow. Over the 320 trials that subjects performed in this rank-inducing session, we covertly adjusted the duration of allowable-response interval based on a subject’s performance. If a response fell outside the allowable-response interval, the interval was lengthened, while if a response fell within the allowable-response interval, the interval was shortened. For the subjects who were to become the ‘top-ranking’ players, the interval was lengthened by 30 ms when responses fell outside the critical interval, and shortened by only 5 ms when responses fell within the interval. For the subjects who were to become the ‘middle-ranking’ players, the interval was lengthened by 5 ms when responses fell outside the critical interval, and shortened by 5 ms when responses fell within the interval. Finally, for subjects who were to become the ‘lowest-ranking’ players, the interval was lengthened by 5 ms when responses fell outside the critical interval, and shortened by 30 ms when responses fell within the interval. After every 20 trials, summary feedback was displayed (for 5 s), showing the cumulative percentage correct of all three players. The ranking of the participants was based on this percentage correct. During the entire experiment, the name of the player with the best score was presented at the top of the screen, the name of the player with the worst score at the bottom of the screen and the third player in the middle, creating a hierarchical ranking. The names presented were the actual names of the three participants. To make this ranking even more salient, the top player received three stars behind his name, the middle player two and the bottom-ranking player received just one star. Importantly, when the status of the subject changed, both the position of their name on the screen, as well as the number of stars behind their name changed. We made sure that subjects achieved their final ranking at least 100 trials before the end of the rank-inducing session and that they maintained this status until the end of the first session. Twelve subjects acquired the low (two males), middle (two males) and high (three males) rank.
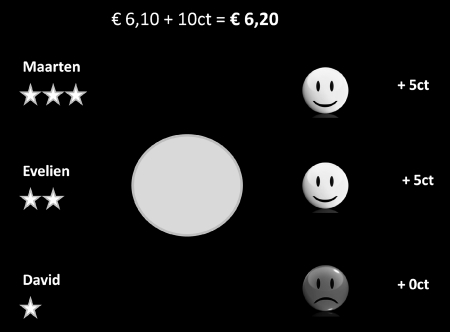
After a short break, subjects continued with the second session that we will refer to as the experimental session. In this session, the three subjects performed the time estimation task together and were informed that every correct response from the three participants would be rewarded with five eurocents, so the maximal earnings per trail would be 15 eurocents. Every cent won would be added to an account that was displayed on screen throughout the experiment. Subjects were informed that at the end of the experiment, the money in the account would be distributed equally among the three subjects. Subjects received feedback on their own and also on the others’ performance simultaneously, and were informed that the other two subjects also received feedback on performance of all three participants at the same time (Figure 1). Subjects performed 320 trials in this session, lasting for ∼35 min. In this second, experimental session the length of the critical interval was manipulated in such a way that all subjects received positive feedback on 50% of the trials. The hierarchy established in the rank-inducing session was maintained so the status of subjects did not change during the experimental session, and was visible to the subjects during the entire experiment (i.e. by the number of stars behind their names and the position of their names on the screen (Figure 1). It is important to note that, although the percentage of positive and negative feedback was manipulated, this feedback was actually still contingent upon the participants’ performance. What differed between subjects was the time interval within which responses were considered correct.
Fig. 1.
Screenshot of the time estimation reaction time task. At the start of the trial, a blue circle was presented, that changed colour to green after 2–2.5 s. It was the participant’s job to hit the spacebar exactly 1 s after the circle had turned green. Subjects were rewarded with five eurocents every time they responded correctly. Responses were considered correct when they were within a certain critical time interval. Two seconds after the circle changed colour, subjects were given feedback on their performance: a smiley face accompanied by ‘+5ct’ when they responded within the critical time interval or a sad face and ‘+0ct’ when they responded too fast or too slow. Note that the name of the player with the best score was presented at the top of the screen, the name of the player with the worst score at the bottom of the screen and the third player in the middle, creating a hierarchical ranking. The names presented were the actual names of the three participants. To make this ranking even more salient, the top player received three stars behind his name, the middle player two and the bottom-ranking player received just one star.
EEG was recorded from 128 locations using active Ag–AgCl electrodes (Biosemi ActiveTwo, Amsterdam, Netherlands) mounted in an elastic cap. Horizontal EOGs were recorded from two electrodes placed at the outer canthi of both eyes. Vertical EOGs were recorded from electrodes on the infraorbital and supraorbital regions of the right eye placed in line with the pupil. The EEG and EOG signals were sampled at a rate of 256 Hz, digitally low-pass filtered with a 52 Hz cut-off (3 dB) and offline rereferenced to an averaged mastoid reference.
All ERP analyses were performed using the Brain Vision Analyser software (Brain Products). The data were resampled at 100 Hz and further filtered with a 0.53 Hz high-pass filter and a slope of 48 dB/oct and a 40 Hz low-pass filter also with a slope of 48 dB/oct. Artefacts were rejected and eye movement artefacts were corrected, using the Gratton et al. (1983) method. ERPs from each individual subject were averaged separately and a baseline voltage averaged over the 200 ms interval preceding feedback was subtracted from these averages.
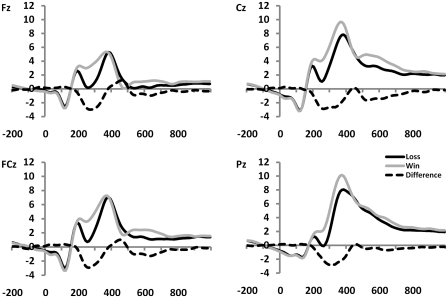
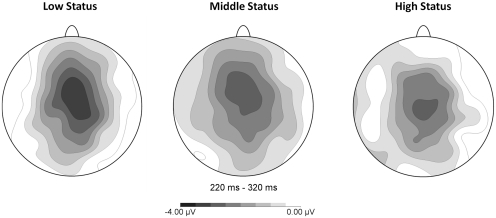
Visual inspection of grand-averaged waveforms and their scalp distributions (Figures 2–5) indicated an MFN that reached its maximum between 220 and 320 ms after presentation of the feedback on midline frontal electrode sites, centred around FCz and Cz. Therefore, the average amplitudes in this time window and these electrode positions were entered in a general linear model (GLM) for statistical analyses To minimize the effects of differences between groups resulting from non-neural causes and also to minimize the effects of overlap between MFN and other ERP components (most notably the P3), we followed up on these analyses by creating difference waves by subtracting ERPs elicited by wins from ERPs associated with losses (see Holroyd and Krigolson, 2007) and submitted mean amplitudes of these difference waves recorded from FCz, Cz and Pz in a time window of 220–320 ms post-feedback to t-tests. To further rule out potential contamination of the MFN by other potentially overlapping components, we also analysed the ERP data by conducting a spatial principal component analysis (PCA; Spencer et al., 2001), using the PCA module provided with the Brain Vision Analyzer software. Spatial factor loadings were obtained by submitting to a PCA the datapoints for each participant and condition, using varimax rotation and taking an eigenvalue of 1 as the limit for the number of components extracted. Next, we identified the factor showing loadings that were maximal at frontal–central areas (see Holroyd and Coles, 2008; Holroyd et al., 2008), enabling us to isolate activity that can be attributed to the MFN. We further analysed the extracted PCA components in the same way as the ERPs, by submitting the average of a 220–320 ms time window to statistical analyses. Finally, we correlated ERP and PCA data with BIS/BAS scores and performance data.
Fig. 2.
Feedback-locked ERPs, averaged over the three status groups (n = 36), showing that negative feedback elicited a more negative-going ERP in the latency range typically associated with the MFN (here: 220–320 ms), compared with the ERP elicited by positive feedback. The dotted line represents the difference wave created by subtracting the ERP associated with positive feedback from the ERP associated with negative feedback.
Fig. 3.
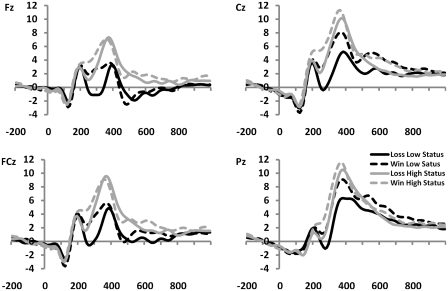
Feedback-locked ERPs from subjects in the high (n = 12) and low (n = 12) status groups, showing a more pronounced difference in amplitude (220–320 ms) between positive and negative feedback for low-status subjects, compared with high-status subjects.
Fig. 4.
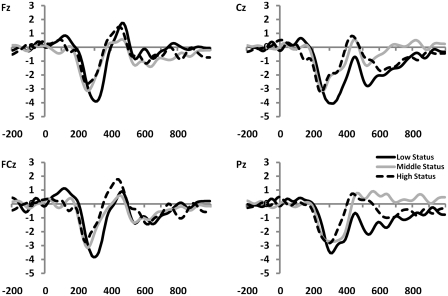
Difference waves, created by subtracting the feedback-evoked ERP associated with positive feedback from the ERP associated with negative feedback, for subjects with low (n = 12), middle (n = 12) and high (n = 12) status. MFN was significantly larger for low-status subjects compared with subjects of both middle and high status.
Fig. 5.
Topographical distributions of the MFN for the three status groups.
RESULTS
BIS/BAS
In order to determine whether there were baseline differences in approach motivation between groups that could potentially confound our results, subjects filled out the BIS/BAS questionnaire. Mean BIS scores for the low, middle and high-status groups were 19.0 (s.d. = 4.3), 22.0 (s.d. = 3.9) and 19.8 (s.d. = 4.4), respectively, F(2, 35) = 1.75, NS. Mean BAS scores were 43.3 (s.d. = 2.9), 40.8 (s.d. = 3.5) and 40.8 (s.d. = 5.6), respectively, F(2, 35) = 1.36, NS. These results show that there were no significant baseline differences in approach motivation between our three status groups.
ERPs
While amplitudes were of comparable magnitude at Cz and FCz, for reasons of clarity and consistency, we will report results from Cz here. However, the reported effects were also significant at FCz. As expected, feedback indicating losses elicited a larger negativity (M = 2.5 µV) in the MFN latency range compared to feedback indicating gains [M = 5.3 µV, F(1, 33) = 72.93, P < 0.001; see Figure 2]. One sample t-tests confirmed that the amplitude of the difference wave (M = −2.7 µV), created by subtracting the ERPs associated with gains from the ERPs associated with losses, was indeed significantly different from zero, t(35) = −8.64, P < 0.001 (Figure 2). This was shown to be true for the MFN in the low-status group [M = −3.3 µV, t(11) = −6.77, P < 0.001], as well as in the middle-status group [M = −2.6 µV, t(11) = −6.24, P < 0.001], and also in the high-status group [M = −2.6 µV, t(11) = −3.85, P < 0.005]. Figure 5 shows that, in accordance with previous studies reporting MFN, this negativity reached its maximum over frontocentral scalp positions in all three status groups.
In addition, we found an interaction between outcome (gains vs losses) and status, F(2, 33) = 4.46, P < 0.05 (Figures 3 and 4). To follow-up on this, we tested for differences in MFN amplitude associated with social status by submitting difference waves for the three status levels (high, middle and low status) to independent samples t-tests. We found that the MFN amplitude on Cz associated with low status was larger compared with the MFN associated with high status, t(33) = 1.95, P < 0.05, and was also larger compared with the MFN associated with middle status, t(33) = 2.02, P < 0.05. The MFNs associated with high and middle status were not significantly different, t(33) = 0.09, NS.
PCA
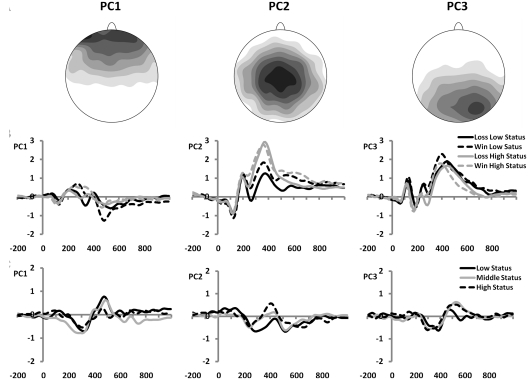
To confirm our findings, and to separate activity that can be attributed to the MFN from activity that cannot, we conducted a spatial PCA on the ERP data. This analysis revealed three spatial components that were maximal at AFz, Cz and POz/PO8, respectively. Although slightly more posterior than the MFN, we selected the second spatial factor, which was maximal at Cz, as the best representative of the MFN (Figure 6A). Comparable with the ERP findings, this PCA component was more negative for losses compared with wins [F(1, 33) = 45.67, P < 0.001], and this effect interacted with social status [F(2, 33) = 5.18, P < 0.05; Figure 6B]. Follow-up analyses, using difference waves that were created by subtracting factor loadings associated with gains from those associated with losses (analogue to ERP difference waves; Figure 6C), showed that factor loadings of this component associated with low status were larger compared with those associated with high status, t(33) = 2.57, P < 0.05, and were also larger compared with those associated with middle status, t(33) = 3.03, P < 0.05. Loadings associated with high and middle status were not significantly different, t(33) = 0.41, NS. Finally, none of the effects reported above were significant when we analysed components 1 and 3, showing that component 2 uniquely contributed to the effect of social status on MFN amplitude.
Fig. 6.
(A) Topographical distributions of the three extracted principal components. Note that only component 2 has the spatial distribution associated with the MFN. (B) Spatial factor scores for subjects in the high (n = 12) and low (n = 12) status groups, confirming a more pronounced difference in factor scores of principal component 2 (220–320 ms) between positive and negative feedback for low-status subjects, compared to high-status subjects. (C) Associated ‘difference waves’ of factor scores, created by subtracting loadings associated with positive feedback from those associated with negative feedback, for subjects with low (n = 12), middle (n = 12) and high (n = 12) status.
Correlations
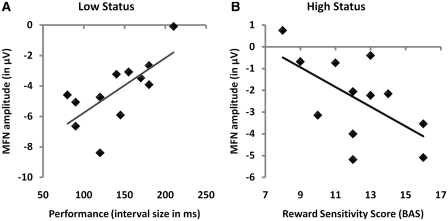
For low-status subjects, MFN difference wave amplitudes on Cz were found to be related to the length of the critical interval in which responses were considered to be correct, r(12) = 0.66, P < 0.05: larger (i.e. more negative) MFN amplitudes were associated with a narrower critical interval (Figure 7). Since the size of this critical interval was dynamically adjusted to the participant’s performance by reducing the size of the interval after correct responses, this interval size can be considered a direct measure for performance accuracy. Therefore, the observed correlation indicates that MFN amplitudes in low-status subjects are related to more accurate performance in these subjects. This correlation was not observed for subjects with middle or high status, r(12) < 0.27, NS. Similar effects were observed on FCz, and also for PCA component 2, r(12) = 0.68, P < 0.05, but not for the other components, r(12) < 0.34, NS.
Fig. 7.
Scatter plots of the correlation between MFN amplitude (Cz) and performance for low-status subjects [r(12) = 0.66; A], and the correlation between MFN amplitude (Cz) and BAS scores for high-status subjects [r(12) = −0.61; B].
In contrast, for high-status subjects we found that on Cz, their MFN difference wave amplitudes were related to their scores on reward sensitivity [BAS; r(12) = −0.79, P < 0.005]: for high-status subjects, the difference in ERP amplitudes elicited by gains and losses was associated with how much these subjects were motivated by rewards: high-status subjects who were highly motivated by rewards displayed relatively large (i.e. more negative) MFNs when they found out that they lost money, compared with trials in which they gained money (Figure 7), while for high-status subjects who were less sensitive to rewards, this difference in ERP amplitudes between gains and losses was less pronounced. This correlation was observed for the subscales BAS-Drive and BAS-Reward [r(12) > 0.76, P < 0.005], but not for BAS-Fun Seeking [r(12) = 0.05, NS]. Similar effects of BAS in the high-status group were observed on Pz, while the effect on PCA component 2 just failed to reach significance, r(12) = 0.55, P = 0.06. These correlations with reward sensitivity were not observed for low-status subjects, while for middle-status subjects, the only significant correlation was between MFN amplitude on Cz and BAS-Drive, r(12) = −0.61, P < 0.05. All other correlations were found to be non-significant.
DISCUSSION
It has been proposed that people with low status are more likely to experience social evaluative threat and are therefore more inclined to monitor for these threats and inhibit approach behaviour. Therefore, we expected that, particularly in a hierarchical social context, low-status individuals would be more engaged in evaluating their own performance. This is indeed what we observed in the present experiment: MFN for low-status participants was found to be of significantly larger amplitude compared with both middle- and high-status participants. Importantly, by isolating the spatial component that corresponds to the MFN, our PCA analysis showed that the observed effects were unlikely to have been caused by temporally coinciding activity unrelated to MFN. Nevertheless, the reported negativity is somewhat more posterior, peaking at Cz, than would have been expected from a MFN, which is important to take into account when comparing the present results with other findings on MFN.
We have argued that MFN amplitudes are most dependent on how concerned subjects are over making mistakes, especially in a social context. Indeed, we have recently found that being treated unfairly (receiving low offers in an ultimatum game; Boksem and De Cremer, 2010), viewing disapproving facial expressions (Boksem et al., 2011b), as well as being outperformed by peers (Boksem et al., 2011a), results in enhanced MFN amplitudes. Therefore, MFN amplitude may reflect how engaged subjects are in processing cues that indicate possible threats to their standing in the social group (see Tops and Boksem, 2010). Because of the importance of social ties and the belongingness to a group for our well-being and even survival, it is imperative to be able to detect one’s acceptance within, or rejection from, the social group. In social animals such as humans, the neural system involved in performance evaluation and the detection of errors, losses, threats and punishments (as reflected by the MFN), may be particularly involved in processing errors and threats of a social nature of which potential social exclusion may be a very prominent one. Indeed, also the ACC (the putative source of the MFN) has been shown to be involved in processing ‘error’ signals from the social environment such as potential loss of social resources, exclusion and rejection (e.g. Eisenberger et al., 2003).
Particularly for individuals already at the bottom of the social ladder, the threat of negative evaluation and potential exclusion by their peers may loom large (Anderson and Berdahl, 2002). Therefore, it makes adaptive sense for these individuals to put more effort into evaluating their own performance and more actively monitor for (social) errors than would be necessary for individuals enjoying a higher status. The enhanced MFN amplitudes for low-status participants reported here strongly support such an interpretation.
Moreover, especially for low-status individuals, these error signals of negative social evaluation should provide a motivational cue to change behaviour in such a way that their performance will be more positively evaluated by others in the future, to prevent further loss of status and potential exclusion. Indeed, we found that MFN amplitudes were positively related to performance of low-status subjects only. These findings fit well with one of the most prominent theories on the MFN, which states that the MFN reflects the activity of a system for reinforcement learning (Holroyd and Coles, 2002). The reinforcement learning theory of the MFN holds that this system utilizes information from the environment indicating success or failure, in order to adjust behaviour in such a way that it better correspond to the set goals. Recently, it was shown that, when subjects received negative feedback for a certain action, MFN amplitude was larger when behaviour is subsequently successfully adjusted (i.e. when subjects have learned from the feedback), compared with when the incorrect response is repeated after negative feedback, (i.e. subjects have not learned from the feedback; Van der Helden et al., 2010). The present data suggest that, while high-status subjects used feedback to determine whether they received rewards (MFN was related to BAS scores), low-status subjects used the information provided by the feedback to adjust performance: for these subjects, MFN amplitudes were positively related to performance. However, because these findings are based on between-subject correlations, and do not show trial-by-trial associations, they have to be interpreted with caution.
Two important potential confound need to be addressed here. First, because low-status subjects have experienced a lot of negative feedback during the rank inducing session, they may have become increasingly despondent, possibly resulting in depressed mood and anxiety. Indeed, the MFN has previously been found to be enlarged for subjects with high levels of negative affect (Luu et al., 2000; Hajcak et al., 2004), depression (Chiu and Deldin, 2007) and anxiety (Hajcak et al., 2003). However, in the present experimental session, subjects in all status groups received equal numbers of positive and negative feedback, affecting mood similarly in all subjects. Still, possible carry-over effects of mood from the rank inducing session cannot be excluded. Second, because the status groups are generated by changing the difficulty and thus the frequency of reinforcement in the three groups, this may result in different reward expectations for subjects in the different status groups, which may also explain the observed differences in MFN amplitude. For example, Holroyd et al. (2003) found that unexpected negative feedback elicited the largest MFN, while Oliveira et al. (2007) showed that also unexpected positive feedback may lead to larger MFN amplitudes. Thus, unexpectedness may be related to increased MFN amplitudes. In addition to the fact that these expectancy effects are not always observed (e.g. Hajcak et al., 2007), in our experiment, especially for subjects in the high-status group, who, because they experienced few instances of negative reinforcement in the rank-inducing session, negative feedback should be particularly unexpected. However, these subjects actually showed the smallest MFN amplitudes, while subjects in the low-status group, who had experienced many instances of negative feedback in the rank-inducing session, displayed the largest amplitudes. In addition, any effects of expectancy on MFN amplitudes can be considered to be relatively short-lived because frequencies of positive and negative feedback were equal for all subjects in the experimental session. Therefore, alternative explanations of the observed effects in terms of expectancy seem unlikely.
The present findings suggest that low-status subjects monitor their performance more actively, and adjust their behaviour more effectively when they receive information that current performance is below par. This, however, appears to be in stark contrast with suggestions in the literature that low status and low power may impair executive functions and goal-directed behaviour (e.g. Guinote, 2007; Smith et al., 2008). High power individuals have been shown to have a greater capacity for maintenance of self-set goals and are better able to keep these goals at the focus of their attention, while low power individuals are more guided by situational constraints and have difficulties inhibiting goal-irrelevant information (Overbeck and Park, 2006).
We have suggested previously (Boksem et al., 2011) that this paradox may be resolved by proposing that differences in status may involve differential activation of two separate neural control pathways that project from limbic areas in the brain to the prefrontal cortex (Tucker and Williamson, 1984; Corbetta and Shulman, 2002: Braver et al., 2007). The first, mediodorsal pathway projects to the dorsolateral prefrontal cortex and is involved in planning, goal-directed behaviour, and applying top-down control over selection of stimuli from the environment. Conversely, a second, ventrolateral pathway projects to the orbitofrontal cortex and ventral prefrontal cortex and is more sensitive to external cues and is specialized in detecting salient unexpected events in the environment. Importantly, the ‘dorsal’ control system is considered to be proactive in that it is engaged when behaviour follows a predetermined action plan, while the ‘ventral’ system is considered to be reactive, interrupting dorsal goal-directed behaviour when events in the environment call for a change of plans.
We suggest that high-status individuals may rely more on the proactive dorsal control system, stimulating approach and goal-directed behaviour, while the behaviour of low-status individuals is regulated more by the reactive ventral system, which down-regulates approach and is sensitive to salient external events (such as negative performance feedback), making them better equipped to monitor and adjust their performance, but on the downside, may also leave them unable to inhibit distracting information from the environment (see Eysenck et al., 2007 for a similar reasoning on the effects of anxiety on attentional control processes). This would make adaptive sense: being relatively unconstrained, high-status individuals are in a position to act in accordance with predetermined plans, while low-status individuals continuously have to monitor their unpredictable environment for unexpected changes and cues that may signal possible social exclusion and rejection by higher status individuals (which as a by-product may induce over-detection of stimuli from the environment that are deemed relevant, resulting in increased distractibility). Therefore, low status most likely does not impair executive control, but rather it is associated with a more reactive mode of behavioural control that is actually more adaptive for those low in status.
Conflict of Interest
None declared.
REFERENCES
- Anderson C, Berdahl JL. The experience of power: examining the effects of power on approach and inhibition tendencies. Journal of Personality and Social Psychology. 2002;83(6):1362–77. [PubMed] [Google Scholar]
- Boehm C. Hierarchy in the Forest: The Evolution of Egalitarian Behavior. Cambridge: Harvard University Press; 1999. [Google Scholar]
- Boksem MAS, De Cremer D. Fairness concerns predict medial frontal negativity amplitude in ultimatum bargaining. Social Neuroscience. 2010;5(1):118–128. doi: 10.1080/17470910903202666. [DOI] [PubMed] [Google Scholar]
- Boksem MAS, Kostermans E, de Cremer D. Failing where others have succeeded: medial frontal negativity tracks failure in a social context. Psychophysiology. 2011a;48(7):973–9. doi: 10.1111/j.1469-8986.2010.01163.x. [DOI] [PubMed] [Google Scholar]
- Boksem MAS, Ruys KI, Aarts H. Facing disapproval: performance monitoring in a social context. Social Neuroscience. 2011b;6(4):360–8. doi: 10.1080/17470919.2011.556813. [DOI] [PubMed] [Google Scholar]
- Boksem MAS, Smolders R, De Cremer D. Social power and approach-related neural activity. Social, Cognitive and Affective Neuroscience. 2011c doi: 10.1093/scan/nsp006. doi:10.1093/scan/nsp006. [DOI] [PMC free article] [PubMed] [Google Scholar]
- Boksem MAS, Tops M, Kostermans E, De Cremer D. Sensitivity to punishment and reward omission: evidence from error-related ERP components. Biological Psychology. 2008;79(2):185–92. doi: 10.1016/j.biopsycho.2008.04.010. [DOI] [PubMed] [Google Scholar]
- Boksem MAS, Tops M, Wester AE, Meijman TF, Lorist MM. Error-related ERP components and individual differences in punishment and reward sensitivity. Brain Research. 2006;1101:92–101. doi: 10.1016/j.brainres.2006.05.004. [DOI] [PubMed] [Google Scholar]
- Braver TS, Gray JR, Burgess GC. Explaining the many varieties of working memory variation: dual mechanisms of cognitive control. In: Conway A, Jarrold C, Kane M, Miyake A, Towse J, editors. Variation in Working Memory. Oxford: Oxford University Press; 2007. pp. 76–106. [Google Scholar]
- Carver CS, White TL. Behavioral inhibition, behavioral activation, and affective responses to impending reward and punishment - The BIS BAS scales. Journal of Personality and Social Psychology. 1994;67(2):319–333. [Google Scholar]
- Cavanagh JF, Allen JJB. Multiple aspects of the stress response under social evaluative threat: an electrophysiological investigation. Psychoneuroendocrinology. 2008;33(1):41–53. doi: 10.1016/j.psyneuen.2007.09.007. [DOI] [PubMed] [Google Scholar]
- Chiu PH, Deldin PJ. Neural evidence for enhanced error detection in major depressive disorder. American Journal of Psychiatry. 2007;164(4):608–16. doi: 10.1176/ajp.2007.164.4.608. [DOI] [PubMed] [Google Scholar]
- Corbetta M, Shulman GL. Control of goal-directed and stimulus-driven attention in the brain. Nature Reviews Neuroscience. 2002;3(3):201–215. doi: 10.1038/nrn755. [DOI] [PubMed] [Google Scholar]
- Cummins DD. How the social environment shaped the evolution of mind. Synthese. 2000;122(1-2):3–28. [Google Scholar]
- DeNeve KM, Cooper H. The happy personality: a meta-analysis of 137 personality traits and subjective well-being. Psychological Bulletin. 1998;124(2):197–229. doi: 10.1037/0033-2909.124.2.197. [DOI] [PubMed] [Google Scholar]
- Dickerson SS, Kemeny ME. Acute stressors and cortisol responses: a theoretical integration and synthesis of laboratory research. Psychological Bulletin. 2004;130(3):355–391. doi: 10.1037/0033-2909.130.3.355. [DOI] [PubMed] [Google Scholar]
- Eisenberger NI, Lieberman MD, Williams KD. Does rejection hurt? An fMRI study of social exclusion. Science. 2003;302(5643):290–2. doi: 10.1126/science.1089134. [DOI] [PubMed] [Google Scholar]
- Eysenck MV, Derakshan N, Santos R, Calvo MG. Anxiety and cognitive performance: attentional control. Emotion. 2007;7(2):336–53. doi: 10.1037/1528-3542.7.2.336. [DOI] [PubMed] [Google Scholar]
- Falkenstein M, Hohnsbein J, Hoormann J, Blanke L. Effects of errors in choice reaction tasks on the ERP under focussed and divided attention. In: Brunia CHM, Gaillard AWK, Kok A, editors. Psychophysiological Brain Research. Tilburg: Tilburg University Press; 1990. pp. 192–5. [Google Scholar]
- Fiske ST. Controling other people - the impact of power on stereotyping. American Psychologist. 1993;48(6):621–8. doi: 10.1037//0003-066x.48.6.621. [DOI] [PubMed] [Google Scholar]
- Gehring WJ, Willoughby AR. The medial frontal cortex and the rapid processing of monetary gains and losses. Science. 2002;295(5563):2279–82. doi: 10.1126/science.1066893. [DOI] [PubMed] [Google Scholar]
- Gratton G, Coles MG, Donchin E. A new method for off-line removal of ocular artifact. Electroencephalography and Clinical Neurophysiology. 1983;55:468–84. doi: 10.1016/0013-4694(83)90135-9. [DOI] [PubMed] [Google Scholar]
- Gray JA. The neuropsychology of emotion and personality. In: Stahl SM, Iverson SD, Goodman EC, editors. Cognitive Neurochemistry. Oxford: Oxford University Press; 1987. pp. 171–90. [Google Scholar]
- Guinote A. Power and goal pursuit. Personality and Social Psychology Bulletin. 2007;33(8):1076–87. doi: 10.1177/0146167207301011. [DOI] [PubMed] [Google Scholar]
- Hajcak G, McDonald N, Simons RF. Anxiety and error-related brain activity. Biological Psychology. 2003;64(1-2):77–90. doi: 10.1016/s0301-0511(03)00103-0. [DOI] [PubMed] [Google Scholar]
- Hajcak G, McDonald N, Simons RF. Error-related psychophysiology and negative affect. Brain and Cognition. 2004;56(2):189–97. doi: 10.1016/j.bandc.2003.11.001. [DOI] [PubMed] [Google Scholar]
- Hajcak G, Moser JS, Holroyd CB, Simons RF. It's worse than you thought: the feedback negativity and violations of reward prediction in gambling tasks. Psychophysiology. 2007;44(6):905–12. doi: 10.1111/j.1469-8986.2007.00567.x. [DOI] [PubMed] [Google Scholar]
- Hajcak G, Moser JS, Yeung N, Simons RF. On the ERN and the significance of errors. Psychophysiology. 2005;42(2):151–60. doi: 10.1111/j.1469-8986.2005.00270.x. [DOI] [PubMed] [Google Scholar]
- Harmon-Jones E. Clarifying the emotive functions of asymmetrical frontal cortical activity. Psychophysiology. 2003;40(6):838–48. doi: 10.1111/1469-8986.00121. [DOI] [PubMed] [Google Scholar]
- Holroyd CB, Coles MGH. The neural basis of human error processing: reinforcement learning, dopamine, and the error-related negativity. Psychological Review. 2002;109(4):679–709. doi: 10.1037/0033-295X.109.4.679. [DOI] [PubMed] [Google Scholar]
- Holroyd CB, Coles MGH. Dorsal anterior cingulate cortex integrates reinforcement history to guide voluntary behaviour. Cortex. 2008;44(5):548–59. doi: 10.1016/j.cortex.2007.08.013. [DOI] [PubMed] [Google Scholar]
- Holroyd CB, Krigolson OE. Reward prediction error signals associated with a modified time estimation task. Psychophysiology. 2007;44(6):913–7. doi: 10.1111/j.1469-8986.2007.00561.x. [DOI] [PubMed] [Google Scholar]
- Holroyd CB, Nieuwenhuis S, Yeung N, Cohen JD. Errors in reward prediction are reflected in the event-related brain potential. Neuroreport. 2003;14(18):2481–4. doi: 10.1097/00001756-200312190-00037. [DOI] [PubMed] [Google Scholar]
- Holroyd CB, Pakzad-Vaezi KL, Krigolson OE. The feedback correct-related positivity: sensitivity of the event-related brain potential to unexpected positive feedback. Psychophysiology. 2008;45(5):688–95. doi: 10.1111/j.1469-8986.2008.00668.x. [DOI] [PubMed] [Google Scholar]
- Keltner D, Gruenfeld DH, Anderson C. Power, approach, and inhibition. Psychological Review. 2003;110(2):265–84. doi: 10.1037/0033-295x.110.2.265. [DOI] [PubMed] [Google Scholar]
- Kross E, Egner T, Ochsner K, Hirsch J, Downey G. Neural dynamics of rejection sensitivity. Journal of Cognitive Neuroscience. 2007;19(6):945–56. doi: 10.1162/jocn.2007.19.6.945. [DOI] [PubMed] [Google Scholar]
- Luu P, Collins P, Tucker DM. Mood, personality, and self-monitoring: negative affect and emotionality in relation to frontal lobe mechanisms of error monitoring. Journal of Experimental Psychology-General. 2000;129(1):43–60. doi: 10.1037//0096-3445.129.1.43. [DOI] [PubMed] [Google Scholar]
- Miltner WHR, Braun CH, Coles MGH. Event-related brain potentials following incorrect feedback in a time-estimation task: evidence for a “generic” neural system for error detection. Journal of Cognitive Neuroscience. 1997;9(6):788–98. doi: 10.1162/jocn.1997.9.6.788. [DOI] [PubMed] [Google Scholar]
- Nieuwenhuis S, Holroyd CB, Mol N, Coles MGH. Reinforcement-related brain potentials from medial frontal cortex: origins and functional significance. Neuroscience and Biobehavioral Reviews. 2004;28(4):441–8. doi: 10.1016/j.neubiorev.2004.05.003. [DOI] [PubMed] [Google Scholar]
- Oliveira FTP, McDonald JJ, Goodman D. Performance monitoring in the anterior Cingulate is not all error related: expectancy deviation and the representation of action-outcome associations. Journal of Cognitive Neuroscience. 2007;19(12):1994–2004. doi: 10.1162/jocn.2007.19.12.1994. [DOI] [PubMed] [Google Scholar]
- Overbeck JR, Park B. Powerful perceivers, powerless objects: flexibility of powerholders' social attention. Organizational Behavior and Human Decision Processes. 2006;99(2):227–43. [Google Scholar]
- Pailing PE, Segalowitz SJ. The error-related negativity as a state and trait measure: motivation, personality, and ERPs in response to errors. Psychophysiology. 2004;41(1):84–95. doi: 10.1111/1469-8986.00124. [DOI] [PubMed] [Google Scholar]
- Pizzagalli DA, Sherwood RJ, Henriques JB, Davidson RJ. Frontal brain asymmetry and reward responsiveness - a source-localization study. Psychological Science. 2005;16(10):805–13. doi: 10.1111/j.1467-9280.2005.01618.x. [DOI] [PubMed] [Google Scholar]
- Sapolsky RM. Social status and health in humans and other animals. Annual Review of Anthropology. 2004;33:393–418. [Google Scholar]
- Shin LM, Dougherty DD, Orr SP, et al. Activation of anterior paralimbic structures during guilt-related script-driven imagery. Biological Psychiatry. 2000;48(1):43–50. doi: 10.1016/s0006-3223(00)00251-1. [DOI] [PubMed] [Google Scholar]
- Sidanius J, Pratto F. Social Dominance Orientation: A Theory of Intergroup of Hierarchy and Oppression. New York: Cambridge University Press; 2001. [Google Scholar]
- Smith PK, Jostmann NB, Galinsky AD, van Dijk WW. Lacking power impairs executive functions. Psychological Science. 2008;19(5):441–7. doi: 10.1111/j.1467-9280.2008.02107.x. [DOI] [PubMed] [Google Scholar]
- Spencer KM, Dien J, Donchin E. Spatiotemporal analysis of the late ERP resonses to deviant stimuli. Psychophysiology. 2001;38(2):343–58. [PubMed] [Google Scholar]
- Tops M, Boksem MAS. Absorbed in the task: personality measures predict engagement during task performance as tracked by error negativity and asymmetrical frontal acitivity. Cognitive, Affective and Behavioral Neuroscience. 2010;20(4):441–53. doi: 10.3758/CABN.10.4.441. [DOI] [PubMed] [Google Scholar]
- Tops M, Boksem MAS. Cortisol involvement in mechanisms of behavioural inhibition. Psychophysiology. 2011;48(5):723–32. doi: 10.1111/j.1469-8986.2010.01131.x. [DOI] [PubMed] [Google Scholar]
- Tops M, Boksem MAS, Wester AE, Lorist MM, Meijman TF. Task engagement and the relationships between the error-related negativity, agreeableness, behavioral shame proneness and cortisol. Psychoneuroendocrinology. 2006;31(7):847–58. doi: 10.1016/j.psyneuen.2006.04.001. [DOI] [PubMed] [Google Scholar]
- Tucker DM, Williamson PA. Asymmetric neural control systems in human self-regulation. Psychological Review. 1984;91(2):185–215. [PubMed] [Google Scholar]
- Van der Helden J, Boksem MAS, Blom JHG. The importance of failure: feedback related negativity predicts motor learning efficiency. Cerebral Cortex. 2010;20:1596–1603. doi: 10.1093/cercor/bhp224. [DOI] [PubMed] [Google Scholar]
- Yu RJ, Luo YJ, Ye Z, Zhou XL. Does the FRN in brain potentials reflect motivational/affective consequence of outcome evaluation? Progress in Natural Science. 2007;17:136–43. [Google Scholar]
- Zink CF, Tong YX, Chen Q, Bassett DS, Stein JL, Meyer-Lindenberg A. Know your place: neural processing of social hierarchy in humans. Neuron. 2008;58(2):273–83. doi: 10.1016/j.neuron.2008.01.025. [DOI] [PMC free article] [PubMed] [Google Scholar]


