Abstract
A molecular cytogenetic analysis was performed on HS-RMS-2, a cell line established in this laboratory from a rare pleomorphic type of rhabdomyosarcoma. G-banding and multicolor-FISH analyses revealed that the cells have a complex chromosomal composition. Comparative genomic in situ hybridization (CGH) detected eight highly amplified regions at 1p36.1-p36.2, 1p31-p32, 1q21-q31, 8q12-q21, 8q24-qter, 11q12-q13, 12q13-q14 and 18q12-q22, suggesting the co-existence of multiple amplified oncogenes in these tumor cells. Reverse chromosome painting, using a probe regenerated by microdissection of a long marker chromosome, revealed the native location of three of eight possible genes to be on chromosomes 1p31-32, 12q14 and 18q21. FISH using BAC and cosmid probes revealed amplification of JUN (1p31), MYC (8q24), CCND1 (11q13), INT2 (11q13.3), MDM2 (12q14.3-q15) and MALT (18q21). These findings indicate that at least eight amplified oncogenes may contribute to the pathogenesis of a rare pleomorphic type of rhabdomyosarcoma. This new cell line should prove useful for in vitro preclinical studies of molecularly targeted therapies
Keywords: Rhabdomyosarcoma, oncogenes, homogeneously staining region, co-amplification, FISH, CGH
Introduction
Rhabdomyosarcoma (RMS) is a small, round cell tumor associated with skeletal muscle his-togenesis and it is the most common pediatric soft tissue sarcoma [1]. There are three main histological and clinical forms of this tumor: embryonal RMS (eRMS), alveolar RMS (aRMS) and pleomorphic RMS (pRMS) [2]. These tumors are classified on the basis of their degree of differentiation, a feature closely related with their response to chemotherapy [3]. The genes responsible for tumorigenesis have been characterized in two (aRMS and eRMS) of the three types of RMS [4-6].
Little is known about genetic alterations in pRMS, though an accumulation of genetic changes affecting the expression and function of critical genes is thought to drive malignant transformation and tumor progression. Genetic aberrations in malignant tumors, including RMS, often involve not only rearrangements of whole chromosomes or specific chromosomal regions, but also the amplification of oncogenes. Chromosomal aberrations in RMS have been studied by using both classical and molecular cytogenetics. Classical cytogenetics by staining meta-phase chromosomes of the tumors has been a powerful tool for the analysis of chromosome aberrations in leukemia. However, classical cytogenetics has had limited value for the analysis of solid tumors, especially those showing very complex karyotypes. Moreover, karyotyping of soft and solid tumors is compromised due to the low mitotic activity of cultured tumor cells and the overgrowth of non-neoplastic stromal cells. The establishment of tumor cell lines can prove invaluable for the genetic and functional studies of solid tumor cells. Tumor cell lines represent useful in vitro models for studies related to tumorigenesis, especially in the investigation of genetic changes and malignant transformation associated with the development of tumors. Therefore, establishing and characterizing cell lines from rare tumors, such as pRMS, is very useful. We previously described the establishment of pRMS cell line, designated HS-RMS-1 [7], which to our knowledge was the first report of an pRMS cell line.
We now report the establishment and molecular cytogenetic characterization of a second pRMS cell line, designated HS-RMS-2. The field of molecular cytogenetics has developed rapidly over the last decade and has greatly advanced the knowledge of chromosomal aberrations in soft and solid tumors. Fluorescence in situ hybridization (FISH), including multi-color FISH (M-FISH) [8], permits the precise analysis of the copy number of individual genes or chromosome loci as well as the analysis of chromosomal rearrangements, such as translocations. Comparative genomic hybridization (CGH) is a technique that allows for the comprehensive and rapid detection of DNA sequence copy number changes within the entire genome [9]. CGH has been validated for the detection of amplifications using tumor cell lines containing unknown or known amplified oncogenes. In addition, chromosomal microdissection (CMD) has been developed as a tool to obtain probes from specific chromosomal regions, thus permitting cytogeneticists to elucidate the origin of complex chromosomal rearrangements [10]. These molecular cytogenetic approaches (M-FISH, CGH and CMD analyses) are complementary modalities for detecting DNA copy number changes and other chromosomal alterations in tumors. Such analyses enable investigators to obtain insights regarding oncogenes and tumor-suppressor genes important in tumor pathogenesis.
This report presents a detailed molecular cytogenetic characterization of the HS-RMS-2 cell line. In addition, the potential roles of eight amplified oncogenes detected by CGH in carcinogenesis are discussed.
Materials and methods
Establishment and culture of the HS-RMS-2 cell line
An 85-year-old female presented with a painful, large mass in the left gluteal muscle. The findings at biopsy were suggestive of pleomorphic sarcoma. The whole tumor was then extirpated with wide margins. A small portion of the tumor tissue was obtained for primary culture. Histopathology was consistent with a diagnosis of pleomorphic rhabdomyosarcoma exhibiting an irregular pattern of pleomorphic tumor cells that occasionally had abundant eosinophilic cytoplasm, as well as an immunopositive reaction for myogenic markers including HHF-35, desmin, and alpha-sarcomeric actin, but not for S-100 protein or alpha-smooth muscle actin. The tumor tissue was minced with scissors and digested with 0.25% trypsin solution. The dissociated cells were seeded in 25 cm2 flasks (GIBCO, BRL) containing DMEM (Sigma) supplemented with 10% fetal bovine serum and antibiotics (Penicillin and Streptomycin, GIBCO, BRL) and cultured at 37°C in a 5% CO2 humidified incubator. Semi-confluent layers formed, and the cells were dispersed with trypsin solution and then seeded in new flasks for passage. These procedures were serially performed until the HS-RMS-2 cell line was established.
Pathological studies
Pathological studies on HS-RMS-2 cells were carried out as described previously [7]. Cultured adherent cells growing on coverslips at passage 10 were fixed with 95% ethanol, and tissue from a xenotransplant nude mouse tumor was fixed with 20% buffered formalin solution. Cells on coverslips and sections of dewaxed-tumor tissue were stained with hematoxylin and eosin (H&E), and periodic acid-Schiff (PAS) reaction with or without diastase predigestion, as well as with antibodies against vimentin (V9, ×100; Dakopatts, Tokyo, Japan), muscle actin (HHF35, ×1000; Enzo, NY, USA), desmin (D33, ×30; Dakopatts), alpha-sarcomeric actin (alpha-Sr-1, ×20; Dakopatts), myogenin (FD5, ×50; Dakopatts), MyoD1 (5.8A, ×50; Dakopatts), myogenin (FD5, ×50; Dakopatts), myoglobin (polyclonal, ×400, Dakopatts), alpha-smooth muscle actin (1A4, ×200; Dakopatts, Tokyo, Japan), S-100 protein (polyclonal, ×1000; Dakopatts, Tokyo, Japan), CD31 (JX/70A, ×20; Dakopatts), macrophages (HAM56, ×1000, Enzo), using the streptavidin-biotin immunoperoxidase method (Histofine SAB-PO kit, Nichirei, Tokyo, Japan). To enhance the immunoreactivities of CD31 and HAM56, each specimen was preincubated in 0.1% pronase E (Sigma, St. Louis, MO, USA) at 37°C for 20 min. To retrieve antigenic activities of vimentin and MyoD1, the specimens were incubated in citrate-buffered solution (pH 6.0) at 95°C for 5 min and 40 min, respectively, using a microwave oven generating 600 W (H 2500, Energy Beam Science, Agawah, MA, USA). They were also examined with antibodies against vimentin (V9, ×100; Dakopatts, Tokyo, Japan), desmin (D33, ×30; Dakopatts, Tokyo, Japan) alpha-smooth muscle actin (1A4, ×200; Dakopatts, Tokyo, Japan), S-100 protein (polyclonal, ×1000; Dakopatts, Tokyo, Japan), CD34 (HPCA-1, ×10, Becton Dickinson, CA, USA), and c-kit (Polyclonal, ×50, Dakopatts, Tokyo, Japan), using the streptavidin-biotin immunoperoxidase method (Histofine SAB-PO kit, Nichirei, Tokyo, Japan).
Chromosome analysis
Chromosomes from the cell line were analyzed using GTG-banding and multi-color FISH (M-FISH). Metaphase cells were harvested, and slides were prepared according to standard methods [9]. Briefly, actively dividing cells were blocked in metaphase with 0.1 mg/ml of Colcemid (Gibco) for 1 to 3 hours, incubated in 0.075 M KCl hypotonic solution for 20 minutes, and fixed in methanol-glacial acetic acid (3:1). GTG-and Q-banding were performed using standard procedures [11]. Representative images were captured using an Olympus (Japan) DP-70 system for GTG- and Q-banding, and the Mac Probe analysis system (Applied Imaging Corporation, USA) for FISH, M-FISH and CGH. Karyotypic analysis was performed in accordance with the International System for Human Cytogenetic Nomenclature, 2009 [12].
M-FISH study
Commercially available probes (SpectraVysion assay; Abbot Molecular-Vysis, Des Plaines, IL, USA) were used for M-FISH, following the manufacturer's protocols.
CGH study
Metaphase-CGH was performed according to a standard protocol [9], with minor modifications. Genomic DNA was isolated from tumor specimens and peripheral blood lymphocytes from karyotypically normal male controls using standard techniques. Reference and tumor DNAs were labeled by nick translation with rhodamine -dUTP (Amersham Pharmacia Biotech, USA) and fluorescein-12-dUTP (NEN Life Science Products, Boston, MA), respectively. The hybridization mixture contained 200 ng of tumor DNA, 200 ng of reference DNA, and 20 μg of Cot-1 DNA (Roche Diagnostics Corporation, Indianapolis, USA) in 8 μL of hybridization solution, H-7782 (Sigma-Aldrich Co., St. Louis, USA). The probe mixture was hybridized to normal male metaphase spreads (46, XY) for 3 days at 37°C. The hybridized slides were then washed in post-wash solution (50% formamide/2×SSC) for 20 minutes at 43°C and washed twice in 2×SSC for 4 minutes at 37°C and once in 1×PBD (4×SSC/0.05% Tween20) at room temperature. The slides were washed three times for 2 minutes in 1×PBD and then mounted with a Vectashield (Vector Laboratories, Burlingame, CA, USA).
CGH digital image analysis
The CGH analysis was performed using an Olympus BX-50 fluorescence microscope equipped with single band-pass filters for fluorescein, rhodamine, and DAPI and with a cooled CCD camera (KAF 1400, Photometrics, USA) and Mac Probe, version 3.4 analysis system (Applied Imaging Corporation, USA, Sekitechnotoron, Japan). Nine to ten metaphase spreads were combined to obtain profiles of the mean ratio and standard deviation. Chromosomal regions where the green-to-red ratio exceeded 1.15 were considered to be over-represented (gained), whereas regions where the ratio was below 0.85 were considered to be under-represented (lost). If the mean green-to-red ratio exceeded 1.3 in a small segment of the chromosome arm, these regions were considered to represent high-level amplification. Telomeric and heterochromatic regions were excluded from the analysis.
CMD, DOP-PCR and labeling
Metaphase spreads for CMD and FISH were prepared on 24 × 60 mm coverslips and glass slides, respectively. For one medium size acro-centric chromosome thought to contain a homogenously staining region (hsr), one metaphase spread were used to scrape the hsr using a CMD technique [7, 11]. In brief, glass needles with about 1 to 2 μm diameter tips were produced from glass capillaries (GD-1, Narishige, Tokyo, Japan) using a PC-10 pipette puller (Narishige). Microdissection was then performed under the guidance of an inverted microscope (Olympus, Tokyo, Japan) equipped with a mechanical micromanipulator, Eppendorf 5171 (Hamburg, Germany). The scraped chromosome fragments were placed into a 0.5 ml tube under a binocular microscope. DOP-PCR was used to amplify DNA of the scraped chromosome segments in a thermal cycler (PTC-100; MJ Research, MA.). The procedure was essentially the same as that reported by Christian et al. [13] with minor modifications. PCR was performed in a final volume of 10 μl containing 1.0 μl Thermo Sequenase DNA polymerase (Amersham Biosciences Corp., NJ, USA), 1.0 μl Thermo Sequenase reaction buffer, 200 μM each of dATP, dCTP, dGTP, and dTTP and 4 μM DOP primer (5'-CCG ACT CGA GNN NNN NAT GTG G-3'). Thirty μL of mineral oil were added to prevent evaporation. The thermal profile was 95°C for 10 min, 6 cycles of 94°C for 1 min, 30°C for 2 min, and a ramp of 0.1°C/s up to 65°C for 3 min, 30 cycles of 94°C for 1 min, 56°C for 1 min, and 72°C for 3 min, followed by a single 72°C for 5 min and held at 4°C until removed. Each sample was separated by electrophoresis on a 1.5% agarose gel at 100V for 1 hr to verify DNA recovery from the PCR. A hapten of biotin-or digoxigenin-labeled nucleotide was incorporated into the DNA segments by using a second-generation DOP-PCR with 2 μl of the first -generation products as a template. The 50 μl labeling reaction for the second PCR contained 20 U Thermo Sequenase DNA polymerase, 26 mM Tris-HCl, pH 9.0, 6.5 mM MgCl2, 200 μM each of dATP, dCTP, dGTP, and dTTP and 40 μM biotin-16-dUTP (Roche Applied Science, Tokyo, Japan) or digoxigenin-11-dUTP (Roche Applied Science), and 4 mM DOP primer. The thermal profile was 95°C for 5 min, 25 cycles at 94°C for 1 min, 56°C for 1 min, and 72°C for 3 min, followed by 72°C for 5 min and held at 4°C until removed. The PCR-derived probe obtained by microdissection from the longest marker chromosome was labeled with either digoxigenin or biotin.
Reverse and forward FISH using CMD-generated probes
Chromosome microdissection and hybridization of the resulting PCR-generated FISH probe were performed using a modification of the methods described previously [11]. Briefly, a PCR-derived probe obtained by microdissection was digoxigenin-labeled and hybridized to metaphase chromosomes of HS-RMS-2 cells (reverse FISH) and PHA-stimulated normal peripheral blood lymphocytes (forward FISH).
Dual or single color FISH analysis by cosmid & BAC probes combined with painting probes
Combinations of JUN (1p31; cosmid; Cosmobio, Japan), chromosome 1 painting probes, MYC (8q24; Appligene; Oncor, France), chromosome 8 painting, CCND1 (11q13; Kreatech, Diagnostics, Netherlands), chromosome 11 centromere probes, CDK4 (11q13; Kreatech, Diagnostics, Netherlands), chromosome 11 centromere probes, INT2 (11q13.3; Appligene; Oncor, France), chromosome 11 painting probes (Appligene; Oncor, France), SAS (12q13-q14; Appligene; Oncor, France), MDM2 (12q14.3-q15; Appligene; Oncor, France), chromosome 12 painting, BCL2 (18q.21.3; Appligene; Oncor, France) and MALT break probe (18q21; consisting of proximal region (345 kb) and distal region (680 kb): Kreatech, Diagnostics, Netherlands) were used for hybridization to metaphase spreads from the cell line to detect the distribution of oncogenes, specific chromosomal segments, and sites of amplification. Probes of P58 (1p36; Appligene; Oncor, France) and TP53 (17p13.1; Appligene; Oncor, France) were also tested to determine whether these genes were amplified or lost. FISH was performed according to the manufacturer's protocol. Hybridization of the probes was performed at 37 °C for 12-15 hours, followed by post-hybridization washes and visualization of the probes under the guidance of an epifluorescence microscope.
Results
Establishment of the cell line
The cells began to proliferate 4 weeks after the initiation of the culture and were adapted to growth in D-MEM medium supplemented with 10% FBS and antibiotics. The established cell line, designated HS-RMS-2, has been maintained in continuous culture by serial cell transfer for more than 24 months. The cells were frozen under standard conditions using Bambanker (Lymphotec Inc., Japan), and can be revived successfully after storage in liquid nitrogen. The HS-RMS-2 line was predominantly composed of tumor cells of medium-to-large size, with either a polygonal or spindle shape (Figure 1).
Figure 1.
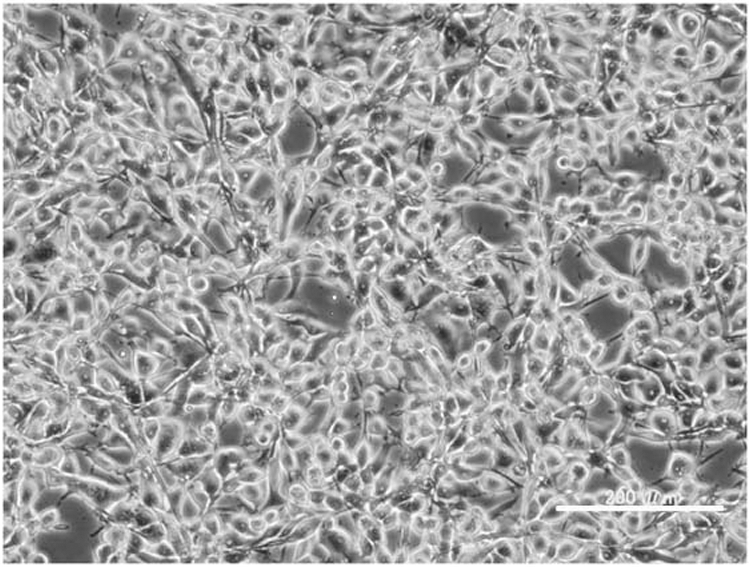
Morphology of the HS-RMS-2 cell line in culture, photographed with a phase contrast microscope. The white bar indicates 200 μm.
Tumorigenicity
Tumors of ~1 cm in diameter developed after two months in each nude mouse transplanted with HS-RMS-2 cells. The tumors were composed of either spindle or polygonal cells similar to those observed in the primary tumor.
Pathological study
The cytoplasm of HS-RMS-2 cells was frequently positive for antibodies against vimentin, HHF35, desmin and alpha-sarcomeric actin. The nuclei were occasionally positive for MyoD1 and myogenin. The heterotransplanted nude mouse tumor had almost identical features as those of the original tumor and compatible with pRMS. The tumor cells possessed many PAS-positive glycogen granules in the cytoplasm and were frequently positive for vimentin, HHF35, desmin and alpha-sarcomeric actin. The other antibodies tested showed negative staining in HS-RMS-2 cells.
Cytogenetic findings
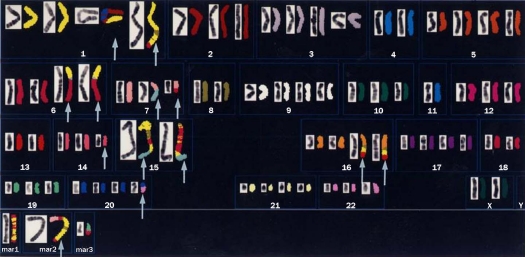
Conventional cytogenetic analysis using GTG-banding revealed a highly complicated karyotype; 75-81<3n>, -X[5], +der(3)t(3;?)(p22;?) [3], -4[4], +5[3], -6[4], -7[3], -8[3], +9[2], -11×2[5], +12[3], -13[3], - -15×3[5], -16[4], +17[3], - der(18)t(18;?)(q23;?)[6], +20[3], +21[4], +22[3], 13-24mar [cp6]. A representative G-banded karyotype [81<3n>, -X×2, del(1) (p22), -2, +der(3)t(3;?)(q21;?), -4×2, -7×2, der(?)t(?;8)(?;q13), -10, -11×2, +12, -13×2, -16×2, +17, der (18) t(18;?)(p11;?), +19, +24mar] is shown in Figure 2. M-FISH revealed that the cell line was hyper-triploid and contained multiple chromosomal aberrations (Figure 3), with 11 different unbalanced-translocated chromosomes, including various marker chromosomes. Chromosome 1 was the most frequently involved (6/11), followed by chromosome 18 (5/11), and chromosome 8 (3/11). Others included chromosomes 2 (1/11), 6 (2/11), 15 (2/11), 16 (2/11), 19 (1/11), and 20 (2/11).
Figure 2.
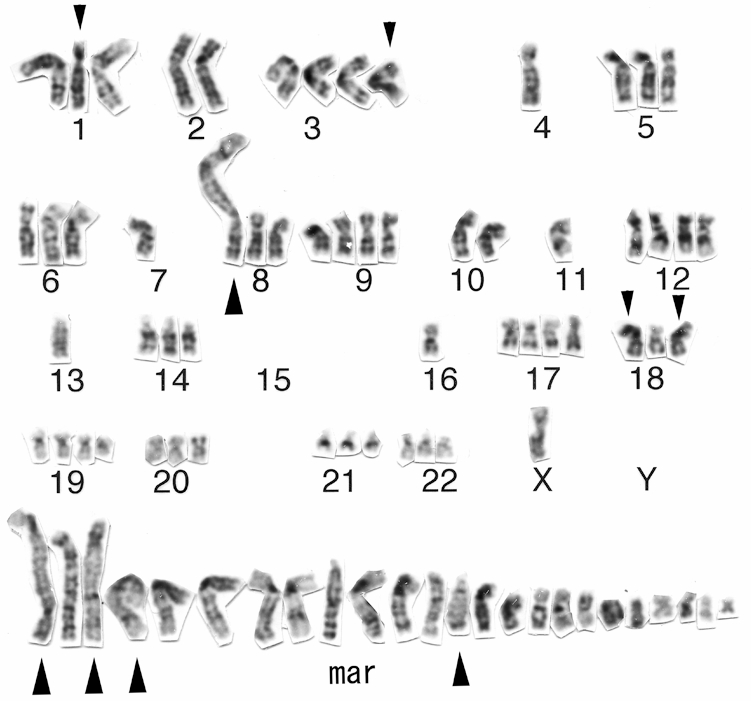
A representative G-banded karyotype of the HS-RMS-2 cell line. Note the presence of many marker chromosomes (mar). Small arrowheads indicate abnormal chromosomes. Large arrowheads show possible chromosomes with an hsr.
Figure 3.
A representative M-FISH karyogram of the HS-RMS-2 cell line. Arrows indicate chromosomes with aberrations.
CGH
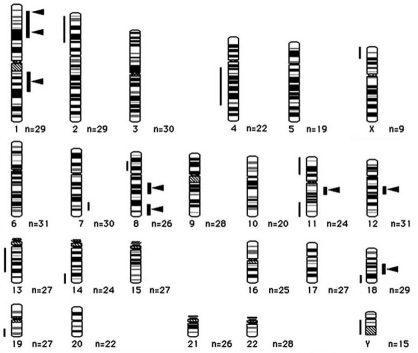
Metaphase-CGH revealed eight high-level gains in HS-RMS-2 cells. A summary of the DNA sequence copy number aberrations detected in this cell line by CGH is shown in Table 1. An extremely high-level of gains were seen on chromosome bands, 1p36.1-1p36.2, 1p31-p32, 1q21-q31, 8q12-q21, 8q24-qter, 11q12-q14, 12q13-14, and 18q12-q22 (Figure 4). In addition, lower level gains were also detected on 7q32-q35 and 8q13-q21. On the other hand, losses were observed at 11 regions: 2q14-q24, 4q13-q14, 5p14-p15, 8q12-q22, 11p12-p15, 11q22-q25, 13q12-q13, 14q31-q32, 18q22-q23, 19q13.2-q13.3 and Y. Altogether, the CGH analysis revealed 19 genomic imbalances in HS -RMS-2 cells, including eight sites of high-level DNA amplification (Figure 5).
Table 1.
Gains and losses of the sequences in the HS-RMS-2 cell line by CGH.
| High-level gains | Gains | Losses |
|---|---|---|
| 1p36.1-p36.2, | 7q32-35 | 2p14-p24, 4q13- |
| 1p31-p32, | p14, 5p14-p15, | |
| 1q21-q31, | 8p12-p22, 11p12- | |
| 8q13-q21, | p15, 11q22-q25, | |
| 8q24-qter, | 13q12-q31, 14q31 | |
| 11q12-q14, | -q32, 18q22-q23, | |
| 12q13-q14, | 19q13.2-q13.3 | |
| 18q12-q22 |
Figure 4.
A representative CGH image of HS-RMS-2. Green parts of the chromosomes show amplified regions of HS-RMS2 and red indicates lost regions. Arrowheads indicate both the locations (green signals) of putative amplified oncogenes and the peaks of highly-amplified regions.
Figure 5.
An ideogram of DNA sequence copy number changes in HS-RMS-2 cell line detected by CGH. Gains are shown on the right side of the chromosome ideograms and losses on the left. Bold lines show high-level gains. Arrowheads show peaks for high-level gains.
CMD and forward & reverse FISH painting
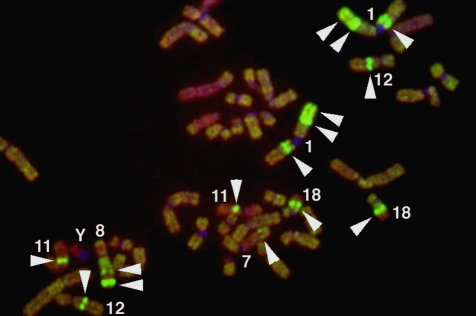
A probe derived by microdissecting whole acro-centric long marker chromosome from HS-RMS-2 cells was generated and hybridized to metaphase spreads from HS-RMS-2 (reverse painting) and normal lymphocytes (forward painting). Probe signals painted not only an original marker chromosome but also other marker chromosomes and normal chromosomes 1, 12 and 18 (Figure 6a). FISH using a microdissection-derived probe on the normal chromosome revealed the chromosomes, 1p31-32, 12q14 and 18q21, the native location of the DNA sequences contained in the CMD-derived probe (Figure 6b).
Figure 6.
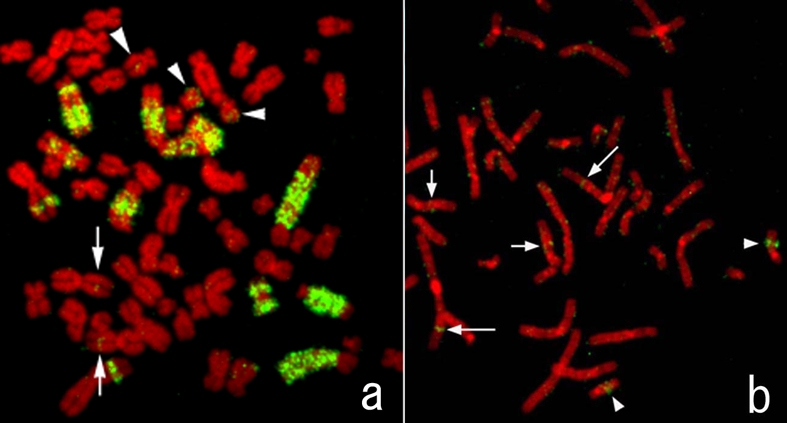
FISH image obtained using the probe generated by microdissection of an hsr of HS-RMS-2. a. A metaphase of HS-RMS-2. Note that green FISH signals are seen on large regions of some chromosomes, which are presumably hsrs. b. A metaphase spread from a normal lymphocyte. Long arrows (1p), short arrows (12q), and arrowheads (18q) show native locations of the DNA derived from the micro-dissected amplification regions.
FISH analysis by unique-gene and painting probes
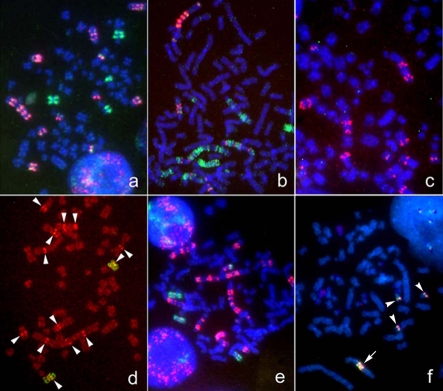
FISH was used to access amplification of candidate genes and to confirm the chromosomal rearrangements. A summary of FISH using several commercially available probes is shown in Table 2. The unique-gene probes, P58 (1p36), JUN (1q31), MYC (8q24), CCDN1 (11q13), CDK4 (11q13), INT2 (11q13.3), SAS (12q13-14), MDM2 (12q14.3-q15), MALT (18q21) and BCL2 (18q21.3), which reside near highly over-represented regions in HS-RMS-2 cells, were used to reveal their distributions on the chromosomes. We also assessed the copy number of the critical tumor suppressor gene TP53 (17p13.1). A large number of signals were observed for JUN, MYC, CCND1, INT2, MDM2 and MALT, as predicted by the CGH analysis (Figure 7). FISH signals with the MALT gene probe seemed to be amplified but not as highly as with the probes for the other five oncogenes. CDK4, SAS and BCL2 did not appear to be amplified based on the number and intensity of the FISH signals. Fluorescent signals of P58 were detected on four to seven chromosomes (Figure 8a). The FISH signals of TP53 did not show any losses and were seen on the normal chromosome 17s (Figure 8b).
Table 2.
FISH analysis by unique probes
| Probe | Locus | Amplification |
|---|---|---|
| P58 | 1p36 | - |
| JUN | 1p31 | + |
| MYC | 8q24 | + |
| CCND1 | 11q13 | + |
| CDK4 | 11q13 | - |
| INT2 | 11q13.3 | + |
| SAS | 12q13-q14 | - |
| MDM2 | 12q14.3-q15 | + |
| TP53 | 17p13.1 | - |
| MALT | 18q21 | + |
| BCL2 | 18q21.3 | - |
Figure 7.
Gene amplification demonstrated by FISH using commercially available onco-gene probes. a. JUN (1p31) (red) and chromosomes 1 painting (green); b. MYC (8q24.12-13) (red) and chromosome 8 painting (green); c. CCND1 (11q13) (red); d. INT2 (11q13.3) (red) and chromosome 11 painting (green). Arrowheads show the red FISH signals of the original location on green painted chromosomes 11 and spotted red ones of INT2; e. MDM2 (12q14.3-q15) (red) and chromosome 12 painting (green); f. MALT (18q21) (reddish-white). The probe represents proximal (green; 345 kb) and distal (red; 680 kb) regions of the MALT gene. An arrow shows the marker chromosome with amplified signals. Arrowheads show a single copy gene on each chromosome.
Figure 8.
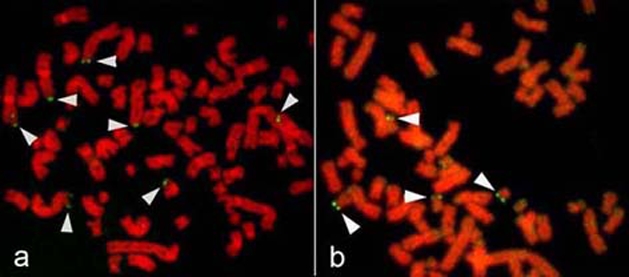
FISH images of P58 and TP53 genes. a. P58 (1p36). Arrowheads show several FISH signals on chromosomes 1 and its derivatives. b. TP53 (17p13.1). Arrowheads show FISH signals on four chromosomes 17.
Discussion
Pleomorphic rhabdomyosarcoma (pRMS) is an aggressive histological variant of rhabdomyosarcoma, occurring predominantly in adults, usually older than 45 years of age, and represents only 2-5% of all adult soft tissue sarcomas. This tumor has a tendency to arise in large skeletal muscle of the extremities, mainly in the thigh. Like other pleomorphic sarcomas, pRMS generally has a poor prognosis because it has a highly aggressive nature and also a tendency to frequently metastasize to various sites, such as the brain and the lung [14-16].
pRMS is the rarest of the three types of RMS, and only a few cytogenetic reports can be found in the literature [16, 17]. Though pRMS is not characterized by specific chromosomal translocations, unlike the other two variants (aRMS and eRMS). Instead, they are generally hyper-diploid with variable gains, rather than a specific translocation [18]. However, some recurrent abnormalities have been reported in pRMS, including rearrangements involving chromosomes 1, 2, and 11 [19]. HS-RMS-2 cells were hypertriploid and contained many numerical and structural abnormalities based on G-and Q-banding analysis. M-FISH readily depicted the precise chromosomes involved in various complex rearrangements, including 11 different unbalanced-translocated chromosomes, found in HS-RMS-2 cells. Many of the unbalanced translocations contained segments of chromosomes 1 and 8.
Tumor specific chromosomal abnormalities have been reported in a number of sarcomas, including t(11;22) in Ewing's sarcoma and peripheral primitive neuroectodermal tumor, t (12;16) in myxoid liposarcoma, and t(12;22) in clear cell sarcoma [17, 19-21]. These specific translocations are thought to be critically important in the pathogenesis of these tumors and result in the formation of fusion genes, such as EWS/ATF1 in clear cell sarcoma [17, 22]. In particular, the alveolar type of RMS frequently harbors a t(2;13), or t(1;13), thus resulting in the formation of a fusion gene, PAX3-FKHR or PAX7-FKHR [23, 24]. On the other hand, eRMS exhibit loss of heterozygosity at 11p15.5, and the loss of a putative tumor suppressor gene located at this location has been proposed to have a causal role in eRMS [23, 25]. Interestingly, loss of this region was also observed in the HS-RMS-2 cell line based on the CGH analysis. Not only pRMS but also other pleomorphic sarcomas usually exhibit complex karyotypes with no specific pattern [14]. Further studies and the accumulation of similar cases will be required to determine whether there are specific translocations or genes pathognomonic for pRMS.
The CGH study showed numerous DNA gains and losses in this cell line. Gains of chromosomes 1, 8 and 18, and losses of chromosomes 2, 5, 11, 13, 14, 18 and 19 were consistent with the data of Li et al. [18]. Remarkably, eight high-level amplifications were detected at three regions on chromosomes 1, two regions on chromosome 8, and one region each on chromosomes 11, 12 and 18. Generally, oncogene amplification is a major genomic force contributing to the development of human cancers, including RMS [17, 26, 27]. Amplified oncogenes located at regions of high-level copy number gains may be related to pathogenesis of this tumor. The co-existence of high-level gains of 8 different chromosomal regions in one tumor cell is notable. These high-level gains are associated with the amplification of multiple oncogenes, including JUN (1p31), MYC (8q24), CCND1 (11q13), INT2 (11q13.3) and MDM2 (12q14.3-q15), each of which is commonly amplified in various types of solid tumors [17, 21, 28-32]. The amplified oncogenes observed in the HS-RMS-2 cell line may contribute to the pathogenesis of pRMS and will be explored in future work. The co-amplification of multiple oncogenes, and the wide distribution of the amplified genes within the genome of the HS-RMS-2 cells suggest that multiple oncogenes may cooperate oncogenically in these cells.
The identification of amplified sequences of DNA using CMD-generated probe is a useful approach for detecting amplified oncogenes [9, 11]. The CMD probe used here was generated from one acro-centric long marker chromosome from a HS-RMS-2 cell. The CMD-generated probe hybridized to large segments in several marker chromosomes containing putative hsrs, while the hybridization to metaphase spreads from lymphocytes provided information regarding the native location of the DNA present in the hsr. The oncogenes that contributed the hsr formation were revealed by dual-color FISH using cosmid and BAC probes. FISH using the CMD probe suggested that there are at least three oncogenes located in the hsr. In addition, FISH experiments using commercially available probes, demonstrated that six oncogenes tested (JUN, MYC, INT2, CCND1, MDM2 and MALT), are amplified in HS-RMS-2 cells. JUN and CCND1 have been implicated in the growth of RMS [33, 34]. Inhibition of MYC decreases RMS tumorigenicity and rescues myogenic differentiation [35]. MYC is involved in several biological processes such as cell proliferation, differentiation, and apoptosis, and MYC deregulation is observed in a large number of human tumors [36]. INT2 encodes a protein belonging to the fibroblast growth factor family, which is thought to be involved in the pathogenesis of some sarcomas [17]. In addition, amplification of 12q13-q14 has been reported in aRMS and has been associated with local tumor invasion [26]. Taken together, these findings suggest that the highly amplified genes detected in our cell line may have some related function, such as perturbing signal transduction related to cell growth and differentiation. Tumor subtypes may also be distinguished by their propensity for amplifying oncogenes, thus suggesting that the particular types of genomic instability present in a tumor are important determinants of how expression of an oncogene might be altered. Moreover, tumors with gene amplifications are often associated with poor prognosis [26]. Co-amplification of INT2 and CCND1, each located in 11q13, are frequently observed in sarcomas. MALT gene amplification, on the other hand, has been reported MALT lymphoma [37]. Amplification of MDM2 is important because it results in degradation of p53 [38]. Oncogenes located at the three remaining amplified regions revealed by CGH, i.e., 1p36.1-p36.2, 1q21-q31, and 8q13-q21, remain to be elucidated.
The previously established HS-RMS-1 cell line did not appear to have any hsrs, and CGH did not detect any gene amplification. According to our clinical reports of HS-RMS-1 and HS-RMS-2 derived patients, the former patient (HS-RMS-1) deceased at about 2.5 years after surgery, however, latter (HS-RMS-2) died at about 6 months. This implies that the tumor from which the HS-RMS-2 line with several hsrs was derived from a more aggressive or more undifferentiated tumor than the one that gave rise to the HS-RMS-1 cell line. Further study of the HS-RMS-2 cell line may provide insights into the mechanisms leading to genomic instability, hsr formation, and co-amplification of oncogenes in relation to pRMS.
Acknowledgments
We thank K. Morisawa for technical support. This study is partly supported by the special field grant (12213096) from the Ministry of education, Culture, Sports and Science, Japan.
References
- 1.Shimada H, Newton WA Jr, Soule EH, Beltangady MS, Maurer HM. Pathology of fatal rhabdomyosarcoma. Report from Intergroup Rhabdomyosarcoma Study (IRS-I and IRS-II) Cancer. 1987;59:459–465. doi: 10.1002/1097-0142(19870201)59:3<459::aid-cncr2820590318>3.0.co;2-k. [DOI] [PubMed] [Google Scholar]
- 2.Horn Enterline. Cancer. 1958;11:181–199. doi: 10.1002/1097-0142(195801/02)11:1<181::aid-cncr2820110130>3.0.co;2-i. [DOI] [PubMed] [Google Scholar]
- 3.Molenaar WM, Oosterhuis JW, Kamps WA. Cytologic differentiation in childhood rhabdomyosarcomas following polychemotherapy. Hum Pathol. 1984;15:973–979. doi: 10.1016/s0046-8177(84)80127-6. [DOI] [PubMed] [Google Scholar]
- 4.Meloni-Ehrig A, Smith B, Zgoda J, Greenberg J, Perdahl-Wallace E, Zaman S, Mowrey P. Translocation (2;8)(q35;q13): a recurrent abnormality in congenital embryonal rhabdomyosarcoma. Cancer Genet Cytogenet. 2009;191:43–45. doi: 10.1016/j.cancergencyto.2009.01.010. [DOI] [PubMed] [Google Scholar]
- 5.Rubin BP, Nishijo K, Chen HI, Yi X, Schuetze DP, Pal R, Prajapati SI, Abraham J, Arenkiel BR, Chen QR, Davis S, McCleish AT, Capecchi MR, Michalek JE, Zarzabal LA, Khan J, Yu Z, Parham DM, Barr FG, Meltzer PS, Chen Y, Keller C. Evidence for an unanticipated relationship between undifferentiated pleomorphic sarcoma and embryonal rhabdomyosarcoma. Cancer Cell. 2011;19:177–191. doi: 10.1016/j.ccr.2010.12.023. [DOI] [PMC free article] [PubMed] [Google Scholar]
- 6.Zibat A, Missiaglia E, Rosenberger A, Pritchard-Jones K, Shipley J, Hahn H, Fulda S. Activation of the hedgehog pathway confers a poor prognosis in embryonal and fusion gene-negative alveolar rhabdomyosarcoma. Oncogene. 2010;29:6323–6330. doi: 10.1038/onc.2010.368. [DOI] [PubMed] [Google Scholar]
- 7.Sonobe H, Takeuchi T, Taguchi T, Shimizu K, Furihata M, Ohtsuki Y. A new human pleomorphic rhabdomyosarcoma cell line, HS-RMS-1, exhibiting MyoD1 and myogenin. Int J Oncol. 2000;17:119–125. doi: 10.3892/ijo.17.1.119. [DOI] [PubMed] [Google Scholar]
- 8.Speicher MR, Gwyn Ballard S, Ward DC. Karyotyping human chromosomes by combinatorial multi-fluor FISH. Nat Genet. 1996;12:368–375. doi: 10.1038/ng0496-368. [DOI] [PubMed] [Google Scholar]
- 9.Kallioniemi OP, Kallioniemi A, Sudar D, Rutovitz D, Gray JW, Waldman F, Pinkel D. Comparative genomic hybridization: a rapid new method for detecting and mapping DNA amplification in tumors. Semin Cancer Biol. 1993;4:41–46. [PubMed] [Google Scholar]
- 10.Kume M, Taguchi T, Okada H, Anayama T, Tominaga A, Shuin T, Sasaguri S. Establishment and molecular cytogenetic characterization of non-small cell lung cancer cell line KU-T1 by multicolor fluorescence in situ hybridization, comparative genomic hybridization, and chromosome microdissection. Cancer Genetics and Cytogenetics. 2007;179:93–101. doi: 10.1016/j.cancergencyto.2007.07.020. [DOI] [PubMed] [Google Scholar]
- 11.Taguchi T, Cheng GZ, Bell DW, Balsara B, Liu Z, Siegfried JM, Testa JR. Combined chromosome microdissection and comparative genomic hybridization detect multiple sites of amplified DNA in a human lung carcinoma cell line. Genes Chromosomes Cancer. 1997;20:208–212. doi: 10.1002/(sici)1098-2264(199710)20:2<208::aid-gcc13>3.0.co;2-m. [DOI] [PubMed] [Google Scholar]
- 12.Shaffer LG, Slovak ML, Campbell LJ, editors. Basel: S Karger AG; 2009. ISCN (2009): International System of Human, Cytogenetic Nomenclature. [Google Scholar]
- 13.Christian AT, Garcia HE, Tucker JD. PCR in situ followed by microdissection allows whole chromosome painting probes to be made from single microdissected chromosomes. Mamm Genome. 1999;10:628–631. doi: 10.1007/s003359901058. [DOI] [PubMed] [Google Scholar]
- 14.Guillou L, Aurias A. Soft tissue sarcomas with complex genomic profiles. Virchows Arch. 2010;456:201–217. doi: 10.1007/s00428-009-0853-4. [DOI] [PubMed] [Google Scholar]
- 15.Francis P, Namløs HM, Müller C, Edén P, Fernebro J, Berner JM, Bjerkehagen B, Akerman M, Bendahl PO, Isinger A, Rydholm A, Myklebost O, Nilbert M. Diagnostic and prognostic gene expression signatures in 177 soft tissue sarcomas: hypoxia-induced transcription profile signifies metastatic potential. BMC Genomics. 2007;8:73–88. doi: 10.1186/1471-2164-8-73. [DOI] [PMC free article] [PubMed] [Google Scholar]
- 16.Enzinger FM, Weiss SW: Rhabdomyosarcoma. St. Louis: Mosby Year Book; 1995. Soft Tissue Tumors; pp. 539–577. [Google Scholar]
- 17.Sandberg AA, Meloni-Ehrig AM. Cytogenetic and genetics of human cancer: methods and accomplishments. Cancer Genet Cytogenet. 2010;203:102–26. doi: 10.1016/j.cancergencyto.2010.10.004. [DOI] [PubMed] [Google Scholar]
- 18.Li G, Ogose A, Kawashima H, Umezu H, Hotta T, Tohyama T, Ariizumi T, Endo N. Cytogenetic and real-time quantitative reverse-transcriptase polymerase chain reaction analyses in pleomorphic rhabdomyosarcoma. Cancer Genet Cytogenet. 2009;192:1–9. doi: 10.1016/j.cancergencyto.2009.02.011. [DOI] [PubMed] [Google Scholar]
- 19.Gordon A, McManus A, Anderson J, Fisher C, Abe S, Nojima T, Pritchard-Jones K, Shipley J. Chromosomal imbalances in pleomorphic rhabdomyosarcomas and identification of the alveolar rhabdomyosarcoma-associated PAX3-FOXO1A fusion gene in one case. Cancer Genet Cytogenet. 2003;140:73–77. doi: 10.1016/s0165-4608(02)00631-3. [DOI] [PubMed] [Google Scholar]
- 20.Suzuki M, Tominaga N, Ide Y, Ohyama A, Nakahara T, Ishikawa H, Tanaka A, Mataga I. Establishment and characterization of the rhabdomyosarcoma cell line designated NUTOS derived from the human tongue sarcoma: Special reference to the susceptibility of anti-cancer drugs. Human cell. 2010;23:65–73. doi: 10.1111/j.1749-0774.2010.00086.x. [DOI] [PubMed] [Google Scholar]
- 21.Louis-Brennetot C, Coindre JM, Ferreira C, Pérot G, Terrier P, Aurias A. The CDKN2A/CDKN2B/CDK4/CCND1 pathway is pivotal in well-differentiated and dedifferentiated liposarcoma oncogenesis. An analysis of 104 tumors. Genes Chromosomes Cancer. 2011;50:896–907. doi: 10.1002/gcc.20909. [DOI] [PubMed] [Google Scholar]
- 22.Panagopoulos I, Mertens F, Dêbiec-Rychter M, Isaksson M, Limon J, Kardas I, Domanski HA, Sciot R, Perek D, Crnalic S, Larsson O, Mandahl N. Molecular genetic characterization of the EWS/ATF1 fusion gene in clear cell sarcoma of tendons and aponeuroses. Int J Cancer. 2002;99:560–567. doi: 10.1002/ijc.10404. [DOI] [PubMed] [Google Scholar]
- 23.Anderson J, Gordon A, Pritchard-Jones K, Shipley J. Genes, chromosome, and rhabdomyosarcoma. Genes Chromosomes Cancer. 1999;26:275–85. [PubMed] [Google Scholar]
- 24.Kikuchi K, Tsuchiya K, Otabe O, Gotoh T, Tamura S, Katsumi Y, Yagyu S, Tsubai-Shimizu S, Miyachi M, Iehara T, Hosoi H. Effects of PAX3-FKHR on malignant phenotypes in alveolar rhabdomyosarcoma. Biochem Biophys Res Commun. 2008;365:568–574. doi: 10.1016/j.bbrc.2007.11.017. [DOI] [PubMed] [Google Scholar]
- 25.Kratz CP, Steinemann D, Niemeyer CM, Schlegelberger B, Koscielniak E, Kontny U, Zenker M. Uniparental disomy at chromosome 11p15.5 followed by HRAS mutations in embryonal rhabdomyosarcoma: lessons from Costello syndrome. Hum Mol Genet. 2007;16:374–379. doi: 10.1093/hmg/ddl458. [DOI] [PubMed] [Google Scholar]
- 26.Barr FG, Duan F, Smith LM, Gustafson D, Pitts M, Hammond S, Gastier-Foster JM. Genomic and clinical analyses of 2p24 and 12q13-q14 amplification in alveolar rhabdomyosarcoma: a report from the Children's Oncology Group. Genes Chromosomes Cancer. 2009;48:661–672. doi: 10.1002/gcc.20673. [DOI] [PMC free article] [PubMed] [Google Scholar]
- 27.Missiaglia E, Selfe J, Hamdi M, Williamson D, Schaaf G, Fang C, Koster J, Summersgill B, Messahel B, Versteeg R, Pritchard-Jones K, Kool M, Shipley J. Genomic imbalances in rhabdomyosarcoma cell lines affect expression of genes frequently altered in primary tumors: an approach to identify candidate genes involved in tumor development. Genes Chromosomes Cancer. 2009;48:455–467. doi: 10.1002/gcc.20655. [DOI] [PubMed] [Google Scholar]
- 28.Durbin AD, Hannigan GE, Malkin D. Oncogenic ILK, tumor suppression and all that JNK. Cell Cycle. 2009;8:4060–4066. doi: 10.4161/cc.8.24.10093. [DOI] [PubMed] [Google Scholar]
- 29.Mariani O, Brennetot C, Coindre JM, Gruel N, Ganem C, Delattre O, Stern MH, Aurias A. JUN oncogene amplification and overexpression block adipocytic differentiation in highly aggressive sarcomas. Cancer Cell. 2007;11:361–374. doi: 10.1016/j.ccr.2007.02.007. [DOI] [PubMed] [Google Scholar]
- 30.Morrison C, Radmacher M, Mohammed N, Suster D, Auer H, Jones S, Riggenbach J, Kelbick N, Bos G, Mayerson J. MYC amplification and polysomy 8 in chondrosarcoma: array comparative genomic hybridization, fluorescent in situ hybridization, and association with outcome. J Clin Oncol. 2005;23:9369–9376. doi: 10.1200/JCO.2005.03.7127. [DOI] [PubMed] [Google Scholar]
- 31.Kiuru-Kuhlefelt S, Sarlomo-Rikala M, Larramendy ML, Söderlund M, Hedman K, Miettinen M, Knuutila S. FGF4 and INT2 oncogenes are amplified and expressed in Kaposi's sarcoma. Mod Pathol. 2000;13:433–437. doi: 10.1038/modpathol.3880074. [DOI] [PubMed] [Google Scholar]
- 32.Weaver J, Downs-Kelly E, Goldblum JR, Turner S, Kulkarni S, Tubbs RR, Rubin BP, Skacel M. Fluorescence in situ hybridization for MDM2 gene amplification as a diagnostic tool in lipomatous neoplasms. Mod Pathol. 2008;21:943–949. doi: 10.1038/modpathol.2008.84. [DOI] [PubMed] [Google Scholar]
- 33.Riuzzi F, Sorci G, Donato R. RAGE expression in rhabdomyosarcoma cells results in myogenic differentiation and reduced proliferation, migration, invasiveness, and tumor growth. Am J Pathol. 2007;171:947–961. doi: 10.2353/ajpath.2007.070049. [DOI] [PMC free article] [PubMed] [Google Scholar]
- 34.Stepulak A, Rzeski W, Sifringer M, Brocke K, Gratopp A, Kupisz K, Turski L, Ikonomidou C. Fluoxetine inhibits the extracellular signal regulated kinase pathway and suppresses growth of cancer cells. Cancer Biol Ther. 2008;7:1685–1693. doi: 10.4161/cbt.7.10.6664. [DOI] [PubMed] [Google Scholar]
- 35.Marampon F, Ciccarelli C, Zani BM. Down-regulation of c-Myc following MEK/ERK inhibition halts the expression of malignant phenotype in rhabdomyosarcoma and in non muscle-derived human tumors. Mol Cancer. 2006;5:31–48. doi: 10.1186/1476-4598-5-31. [DOI] [PMC free article] [PubMed] [Google Scholar]
- 36.Field JK, Spandidos DA. The role of ras and myc oncogenes in human solid tumors and their relevance in diagnosis and prognosis (review) Anticancer Res. 1990;10:1–22. [PubMed] [Google Scholar]
- 37.Kuo SH, Weng WH, Chen ZH, Hsu PN, Wu MS, Lin CW, Jeng HJ, Yeh KH, Tsai HJ, Chen LT, Cheng AL. Establishment of a novel MALT lymphoma cell line, ma-1, from a patient with t (14;18)(q32;q21)-positive Helicobacter Pylori-independent gastric MALT Lymphoma. Genes Chromosomes Cancer. 2011;50:908–921. doi: 10.1002/gcc.20910. [DOI] [PubMed] [Google Scholar]
- 38.Ito A, Kawaguchi Y, Lai C-H, Kovacs JJ, Higashimoto Y, Appella E, Yao T-P. MDM2-HDAC1-mediated deacetylation of P53 is required for its degradation. EMBO J. 2002;15:6236–6245. doi: 10.1093/emboj/cdf616. [DOI] [PMC free article] [PubMed] [Google Scholar]


