Abstract
The objective of this study was to create a clinically applicable mathematical model of immunotherapy for cancer and use it to explore differences between successful and unsuccessful treatment scenarios. The simplified predator-prey model includes four lumped parameters: tumor growth rate, g; immune cell killing efficiency, k; immune cell signaling factor, λ; and immune cell half-life decay, μ. The predator-prey equations as functions of time, t, for normalized tumor cell numbers, y, (the prey) and immunocyte numbers, ×, (the predators) are: dy/dt = gy - kx and dx/dt = λxy - μx. A parameter estimation procedure that capitalizes on available clinical data and the timing of clinically observable phenomena gives mid-range benchmarks for parameters representing the unstable equilibrium case in which the tumor neither grows nor shrinks. Departure from this equilibrium results in oscillations in tumor cell numbers and in many cases complete elimination of the tumor. Several paradoxical phenomena are predicted, including increasing tumor cell numbers prior to a population crash, apparent cure with late recurrence, one or more cycles of tumor growth prior to eventual tumor elimination, and improved tumor killing with initially weaker immune parameters or smaller initial populations of immune cells. The model and the parameter estimation techniques are easily adapted to various human cancers that evoke an immune response. They may help clinicians understand and predict certain strange and unexpected effects in the world of tumor immunity and lead to the design of clinical trials to test improved treatment protocols for patients.
Keywords: Adoptive, basal cell carcinoma, imiquimod, immune modulation, Lotka-Volterra, lymphoma, melanoma, predator-prey, tumor infiltrating lymphocytes
Introduction
Mathematical analysis of immune mechanisms in general and of anti-tumor immunity in particular has a rich intellectual history [1-8]. Predator-prey equations have seemed to fit the problem nicely since the time of Bell [4], and remain subject of active investigation in the 21st century[2, 8, 9]. With growth in knowledge about the intricacy of the immune system, complex systems of 10 to 20 coupled differential equations, often nonlinear, have been developed to describe the humoral and cellular immune responses, including changes in cell populations in response to chemical signals arising from hormones, cyto-kines, and cellular debris [5, 10]. There can be separate equations for each subtype of cell and for concentrations of relevant chemical mediators [5]. Details of the immune system and its systematic analysis are reviewed in [3, 5, 7, 10].
Typically mathematical models have dealt with anti-tumor immunity directed toward highly anti-genic tumors arising from a single cell [5, 7]. They have shown the conceptual feasibility of “tumor surveillance” by the immune system and destruction of microscopic nascent tumors of high antigenicity. However, there is a need for models dealing with established tumors that cause clinical cancer, in part because they have evaded early tumor surveillance and have grown to macroscopic sizes. These tumors, almost by definition, are weakly antigenic. The theoretical potential for destruction of such larger, established tumors by treatments that boost the immune response, such as adoptive cell therapy [11-14], immune-modulating drugs [15-18], and anti-cancer vaccinations [19-23] remains a subject of active investigation.
Although complex mathematical models involving many differential equations can provide useful insights into detailed mechanisms, they suffer from the need to specify a large number of parameters. These values are difficult to estimate for cases of human disease, for which relevant data are often non-existent. Some parameter values can be extrapolated from mouse and hapten-carrier systems [5, 24], for which results are often inconsistent among different experiments [7]. Remaining unknown parameters must be set arbitrarily [5]. In this sense there is a long leap from lab bench and laptop to bedside. Hence there may be virtue in studying less complex mathematical systems, for which parameters can be estimated from human clinical observations and experience, and perhaps even individualized to particular molecular subtypes of cancer in particular types of patients [25].
Accordingly, the goals of the present research were to develop a simple and workable mathematical model of immunotherapy directed toward weakly antigenic, macroscopic tumors in human beings and to explore theoretical differences between successful and unsuccessful treatment scenarios and protocols. Ideally such a model has enough terms to provide a reasonable approximation of reality but is simple enough for its functioning and limitations to be fully understood. Here we adopt a classical predator-prey formulation of the tumor immunity problem as a battle between immune cells and tumor cells (predators and prey, respectively). We note that the immune system, like an army, includes soldiers with many ranks and roles, organized into functional units. Although there is, without doubt, virtue in detailed analysis to understand and exploit mechanisms, there is also value in predicting the outcome of a battle in broader terms: the comparative sizes of the opposing armies and their comparative fighting effectiveness. In many cases these factors alone are sufficient to predict the outcome as an easy victory for one side or the other, or perhaps a long, back-and-forth struggle.
Methods
Model formulation
Consider one compartment in which a tumor grows autonomously and in which tumor cells are killed upon contact with cytotoxic immune cells (immunocytes, including lymphocytes and activated macrophages). Let T denote the number of tumor cells and let L denote the number of immune cells. The time rate of change in tumor cell numbers (dT/dt) is increased by cell division and diminished by first-order spontaneous cell death, supplemented to a varying degree by immune mediated cell killing. The rate of change in anti-tumor immune cells (dL/dt) is driven by signals arising from the interaction, represented by the product, TL, of existing tumor cells, T, and immune cells, L. Immune cells also experience half life decay from death and emigration. The corresponding model equations as a function of time, t, are
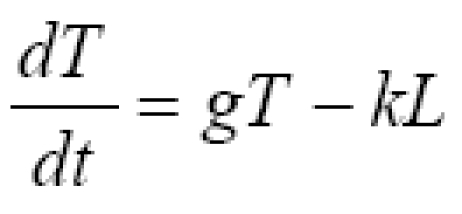
| 1a |
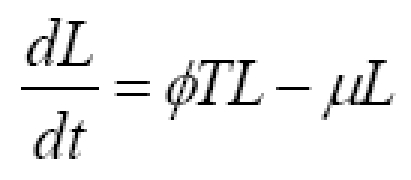
| 1b |
Equation (1a) has the general structure dT/dt = net replication rate in absence of tumor immunity - rate of killing by immunocytes. Equation (1b) has the general structure dL/dt = recruitment from cell-cell signaling - half life removal.
Constants, g, k, ϕ, and μ are lumped parameters representing the overall effectiveness of component processes. Constant, g, represents net tumor cell growth minus decay. That is, g = g1 - g2, where g1 is the first order rate constant for cell division, and g2 is the first order rate constant for spontaneous tumor cell death caused by processes other than immune mediated killing. Constant, k, represents the average killing effectiveness of all immune effector cells, L, that is, an average soldier in the army, including those in non-combat roles. Constant, ϕ), represents positive feedback on lymphocyte recruiting. The positive feedback may result from release of tumor antigens or from release of cytokines by active lymphocytes. The half life decay of immune cells, L, is denoted μ, representing spontaneous death and emigration. Modeling tumor cell killing by immune cells in expression (1a) as kL, rather than a more traditional formulation [1], such as kLT or kLT/(K+L), enhances simplicity and may be more reflective of non-random targeting of tumor cells by lymphocytes. Such purposeful targeting would tend to make killing rates proportional to the number of lymphocytes until all targets are destroyed, at which time killing abruptly ends.
Initial conditions describe the state of the tumor at the time of diagnosis. T0 is the initial pretreatment tumor cell population. L0 is the initial immune cell population within the tumor compartment, where L0 << T0 in un-rejected and clinically troublesome tumors. To normalize for various sizes of tumors at the time of diagnosis (Others have modeled different growth rates and cytokinetics for tumors of grossly different size, ranging from one nascent cell to 107 or more cells. Here the size range is much more restricted to tumors the size that come to clinical attention, say ~ 1 to 100 ml at diagnosis, in which case it is reasonable to consider a single clinical growth rate at this stage.), let y = T/T0 represent the relative tumor size, and let × = L/T0 represent the relative immune cell density within the tumor. Then
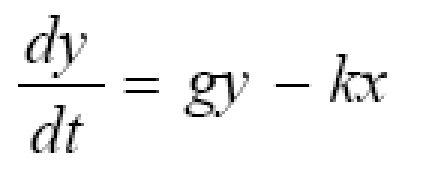
| 2a |
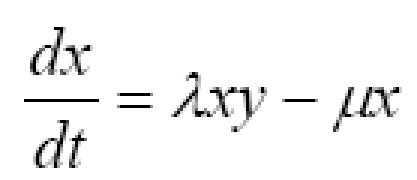
| 2b |
where the new constant, λ = ϕT0, describes the net effects of positive feedback signaling. The initial conditions for equations (2) are y0 = 1, representing the size of the tumor at diagnosis, and x0, representing the initial immune cell density, as determined for example by quantitative microscopic analysis, flow cytometry, or histo-chemistry of excised tumors or biopsy specimens. Here the rate of change in immunity is influenced by four factors: net spontaneous growth of the tumor, g, tumor killing ability of immunocytes, k, the ability of immunocytes, λ, to call for help and increase their numbers in the battle space, and the spontaneous rate, μ, of death or emigration of immunocytes from the battle space.
Limiting cases
When t = 0, then y0 = 1, and when k = 0 (no tumor cell killing), y = egt with unopposed tumor growth. When λ = 0 and k1 0 there is tumor cell killing by the original L0 lymphocytes only, but no recruiting of additional immune cells. In this case, the immunocytes decay exponentially so that x = x0e-μt, and in turn, dy/dt = gy - kx0e-μt, showing slower growth than the unrestricted case, because of time limited tumor killing initially.
Mid-range, reference parameters
A most interesting and useful case is that of an unstable steady-state, in which the tumor neither grows nor shrinks in size. This condition represents a stalemate in which neither the immune system or the tumor gains the upper hand and is a useful starting point for theoretical explorations of strategies and effects. In this case we have

| 3 |
Also, in the steady state we must have no net change in immune cell numbers, hence

| 4 |
These equilibrium values of k0 and λ0 represent the middle of the biologically relevant domain of immune system activity. Their numerical values can be estimated from clinical observations in terms of g, x0, and μ as follows, to obtain a starting point for simulations.
Parameter estimation for conditions prior to treatment
Estimation of g
Rates of disease progression in patients with the same type of cancer vary, even among cancers of the same cell type and stage. Suppose that average tumors are held in check, compared to more aggressive ones, at least partially by immune mechanisms. This state of affairs is suggested by clinical data on the emergence of tumors during immune-suppressive therapy for organs transplants [26, 27], and also by the correlations of tumor associated lymphocyte numbers with clinical prognosis [28-30]. In this case one can estimate the unrestricted growth rate, g, from the doubling time of more rapidly progressing tumors in a given class. For minimally immunogenic tumors dy/dt ≈ gy, or dy/y ≈ gdt, from which, after integration, y ≈ egt. For doubling time t2, it follows that 2 ≈ egt2, or g ≈ ln (2)/t2 ≈ 0.69/t2. For example, if more aggressive tumors of a particular cell type double in 170 days after diagnosis, then we would have g = 0.004 days-1.
Estimation of x0
Parameter x0 can be obtained from biopsies of human tissue, as determined by quantitative microscopic analysis, flow cytometry, or histo-chemistry of excised tumors or biopsy specimens. Microscopically detectable lymphocytes are rare but detectable in many tumors [28-30], suggesting a relative density on the order of 1/1000.
Estimation of k0
For the equilibrium condition (3) we must have k0 = g/x0. For example, if g = 0.004 days-1, x0 = 0.001, this implies k = 4 tumor cells killed per lymphocyte per day. From considerations of practical biology a lymphocyte can only kill a handful of tumor cells per day [5]. Hence values of 1 < k < 10 are quite reasonable.
Estimation of μ
Normal biology and clinical experience set limits on the value of lymphocyte decay, μ. The offset time for moderate to severe viral infections, which are combated by cellular immunity, is on the order of a few days or about one week. The exponential decay of the induration of a PPD (purified protein derivative) test for tuberculosis, also mediated by cellular immunity, is also a few days to one or two weeks [31]. Thus in the absence of stimulation (λxy = 0) we would have dx/dt = -μX or , X ≈ e-μt. For half time t1/2, it follows that 1/2 ≈ e-μt1/2, or μ ≈ ln(2)/t1/2 ≈ 0.69/t1/2. For example, if the offset of a cellular immune response has a half life of 7 days, then μ ≈ 0.1 days-1.
In this way mid-range orders of magnitude for parameters g, x0, and μ, and in turn k0, and λ0 can be determined from clinical data. It is not necessary to have expensive equipment, animal models, cell cultures, large laboratories, or mountains of research money.
Numerical methods
Equations (2) were integrated numerically using the simple Euler method implemented in Visual Basic code within an Excel spreadsheet on an ordinary personal computer. Optionally, necessary computations can be done within spreadsheets themselves using only arithmetic functions. For

| 5 |

| 6 |
Given initial conditions at t = 0, one can trace the evolution of the variables × and y in time, in a “marching solution”, for which stability and accuracy are ensured by using a sufficiently small value of Δt, such as 0.01 day. Increasing or decreasing Δt without effect on the results confirms that a sufficiently small value was chosen for Δt.
Results
Consider a hypothetical human tumor, such as a basal cell carcinoma of the skin, having properties shown in Table 1, estimated from clinical observations, as just described.
Table 1.
Representative model parameters at equilibrium.
| Parameter | Primary value | Description |
|---|---|---|
| y0 | 1 | Relative tumor cell count or size |
| x0 | 0.001 | Relative density of immune cells |
| g | 0.004 days-1 | Unopposed tumor growth constant in y = y0egt |
| κ | 4 days-1 | Immune cell killing effectiveness tumor cells/lymphocyte/day |
| λ | 0.1 days-1 | Immune cell signaling constant lymphocytes/tumor cell/day |
| μ | 0.1 days-1 | Decay constant for immunocytes in x = x0e-μt; λ=0 |
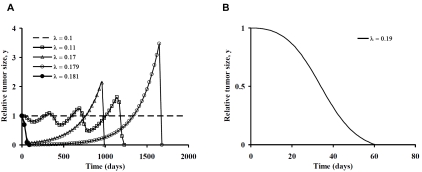
Figure 1A illustrates changes in tumor size as a function of time as the cell signaling parameter, λ, is increased from the steady-state value of 0.1 days-1. The horizontal axis for this model represents 2000 days or about 5.5 years. For simplicity, we assume that average tumor growth rate, g, is not affected by immunotherapy and that the tumor cells are equally susceptible to cytotoxic cells. The dashed horizontal line represents the unstable steady state equilibrium, in which immune mediated tumor cell killing exactly balances spontaneous tumor growth. A 10 percent increase in λ produces an initial decline in tumor cell numbers, followed by three cycles of re-growth, and then a precipitous population crash with tumor elimination. Oscillatory patterns are consistent with classical swings in predator-prey populations [1, 4]. Sharper and earlier population declines happen as λ approaches 1.7 times the steady state value. However, late re-growth to more than double the original volume occurs before the tumor is eliminated by the immune response. Late recurrences at 2 to 5 years for λ near 0.17 are characteristic of many cases of clinical cancer. The recurrences in Figure 1A, however, are not caused by tumor escape mechanisms, tumor cell heterogeneity, or evolution of tumor cell resistance [32, 33]. Instead they result solely from the dynamics of the predator-prey system with a constant state of immune system activation. In all cases shown the tumor is eventually destroyed when cell signaling, λ, is increased above the steady-state equilibrium value.
Figure 1.
A. Tumor growth and decay with departure of cell signaling parameter, λ, from its equilibrium value in the positive direction for the primary model in Table 1. B. Effective tumor elimination in three months with λ = 0.19, less than twice the equilibrium value.
When cell signaling effectiveness, λ, is 0.18 or greater (filled circles) there is steady decline of tumor cell numbers to zero, with complete and irreversible elimination of the tumor. There appears to be a threshold near λ = 0.18, which when crossed causes tumor population to crash promptly without oscillation. When λ = 0.179 (open circles) there is late re-growth. However, when λ = 0.181 there is complete and permanent tumor elimination. The difference in λ between the steady-state with λ = 0.1 and highly effective therapies with λ > 0.18 is less than a factor of two. The trajectory of tumor elimination in three months for λ = 0.19 is illustrated in Figure 1B.
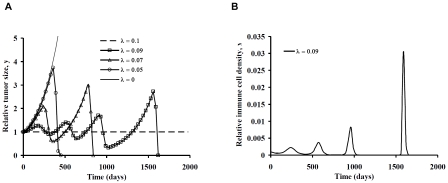
Some interesting and counterintuitive dynamic phenomena happen when the cell signaling parameter, λ, is reduced from its unstable equilibrium value of 0.1 day-1, as shown in Figure 2A. Here, progressive weakening of cell signaling causes accelerated tumor growth initially, as would be expected. However, with continuing nonzero values of feedback, λ, and normal, active immune mechanisms, the tumor size eventually reaches a threshold at which the tumor cell population crashes to zero, with complete tumor elimination. The cost of this indirect strategy is that more tumor growth is needed to trigger or provoke an intense anti-tumor immune response. This phenomenon is explained by the dependence of dx/dt on the product (LT or xy) of both tumor and immunocyte population numbers. Yet such dependence is what would be expected from the biology of immunity in general. The antigen dose matters in provoking effective anti-tumor immunization [34]. Bacterial infections, similarly, must reach a certain size before attracting large numbers of inflammatory cells. The immunocyte population peaks in Figure 2B demonstrate responsiveness of the system to increasing cell numbers. Relatively large changes in immune cell numbers occur in response to relatively modest changes in tumor size. The combined results in Figure 2 suggest the potential robust nature of anti-tumor immunity.
Figure 2.
A. Tumor growth and decay with departure of cell signaling parameter, λ, from its equilibrium value in the negative direction for the primary model in Table 1. B. Time domain trajectories of relative immune cell number, × = L/T0, for the case λ = 0.09, showing classical peaks in response to increasing tumor cell numbers.
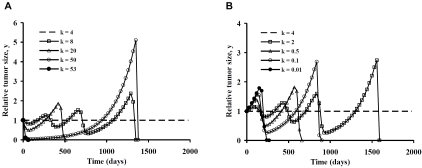
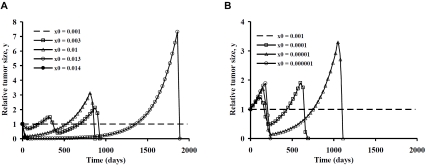
Figures 3 and 4 illustrate similar time trajectories of tumor population numbers for departures of the model parameters k and x0 from the unstable equilibrium state. The patterns of tumor growth and regression are quite similar to those for manipulations of cell signaling strength, λ. Both stronger and weaker cell killing effectiveness can lead to tumor elimination, preceded in some cases by one or more oscillations in population numbers. As before, the robustness of the tumor immunity system is highlighted by the large range of cases in with complete tumor elimination can happen, provided one is willing to tolerate some initial tumor growth.
Figure 3.
A. Tumor growth and decay with departure of killing parameter, k, from its equilibrium value in the positive direction for the primary model in Table 1. B. Tumor growth and decay with departure of killing parameter, k, from its equilibrium value in the negative direction for the primary model in Table 1.
Figure 4.
A. Tumor growth and decay with departure of immunocyte density, x0, from its equilibrium value in the positive direction for the primary model in Table 1. B. Tumor growth and decay with departure of immunocyte density, x0, from its equilibrium value in the negative direction for the primary model in Table 1.
The range of variation in killing effectiveness, k, needed to demonstrate the various dynamic behaviors, however, is much greater than the range of variation in cell signaling, λ. Order of magnitude increases in k (and also x0) are needed to produce similar qualitative effects as achieved by the doubling of λ. However, similar patterns appear. When killing parameter k is increased from the equilibrium state there is an initial fall in tumor cell numbers. However, smaller increases in k that are insufficient to produce tumor elimination directly are followed by oscillations of increasing amplitude until at killing threshold is reached. The killing threshold is lower for larger values of k. Ultimately, as k is increased further, the threshold tumor size is exceeded under the initial conditions. On the other hand, if k is diminished, tumor growth must occur before conditions develop that provoke a lethal trajectory for the tumor. Interestingly, extreme departures of k from its equilibrium value in either direction can provoke prompt tumor elimination. The cost in the case of weaker tumor cell killing is an approximate doubling of the original tumor volume before a population crash.
A similar phenomenon happens in Figure 4 when pre-existing immune cell numbers are altered at time zero. In the thought experiments represented here we assume equilibrium conditions for the primary model with x0 = 0.001, representing one immune cell for every one thousand tumor cells. Then at time zero the number of immune cells is abruptly changed to a different value, either greater or less than 0.001. For example with adoptive immunotherapy [13, 14] the value of anti-tumor immune cells could be suddenly increased. Alternatively, a form of treatment that happened to be toxic to immune cells locally but not to tumor cells could have the opposite effect. After time zero immune cell numbers are free to change in response to cell signaling and half life decay.
A greater than 10 fold increase in initial immunocyte numbers is required to produce complete tumor eradication, starting at the equilibrium state. Amazingly, a strategy of selectively reducing immune cell numbers for a short time, provoking an initial burst of tumor growth, also seems to be effective in triggering tumor eradication. This concept of a strategic retreat, as if drawing the enemy out, followed by a vigorous counterattack, is far from intuitive in clinical oncology, but is suggested as a possible winning strategy by the mathematics. Such a strategy may not be as outlandish as it may at first seem. For the scenarios in Figure 4B, in which tumor growth is required before tumor elimination, tumor cell numbers reach no more than 4 times that at the time of diagnosis. Thus a 1 cm diameter tumor mass need grow only to the cube root of 4 or 1.6 cm diameter before conditions are ripe for its elimination. In many clinical situations this would be an acceptable amount of continued growth, if one had some assurance and understanding that tumor elimination would eventually happen.
Discussion
Immunotherapy is appealing because immune cells efficiently kill target cells with minimum destruction of normal neighboring cells. However, the time course of immunotherapy is unlike that of conventional chemotherapy. Tumor killing happens quickly at the end of the treatment period, rather than gradually over time. With immunotherapy time is required to recruit sufficient numbers of cytotoxic lymphocytes and their allies before the still dividing tumor cells are actively destroyed. A very small population of initial lymphocytes can be sufficient to start a positive feedback cycle that ultimately results in tumor elimination, provided sufficient time is allowed for immune cell recruitment. Indeed, tumor elimination seems quite possible via a variety of strategies that manipulate parameters describing the balance of power in a predator-prey system.
The complex, and sometimes unexpected, behavior of predator-prey systems describing anti-tumor immunity has been noted by others [5-8]. Here we describe several interesting dynamical phenomena, including oscillations in tumor cell numbers, sharp thresholds between failed and completely successful therapy, improved success after weakening of anti-tumor response parameters, initial tumor growth as a prelude to early tumor elimination-even the potential utility of deliberately provoking tumor growth in the presence of a functioning immune system as a strategy for long term cure.
Focusing on the simplest possible predator-prey equations for tumor immunity can help to provide understanding of the relevant cell-cell interactions and their various counterintuitive twists. With only two equations, two variables, four parameters, and reasonable initial conditions one can begin to reconstruct the chains of causation leading to growth, oscillations, or decay in cell population numbers. The phenomena described here are not related to evolution of resistance, escape mechanisms, or any changes in tumor biology. They are simply the result of predator-prey dynamics. The clinically oriented mathematical models of Equations (1) and (2) may help to make such dynamics easier to recognize and also easier to exploit in human cancers.
Adoptive immunotherapy [6, 13, 14], for example, can be represented by a boost in x0 at the beginning of treatment. Drug therapy with immune modifiers such as imiquimod [18] can be represented by a boost in λ. Conventional chemoradiation treatment can be represented approximately by replacing the positive growth constant, g, with g′ = -g. Each cell cycle would then lead to death rather than duplication of the dividing cell. (Strictly, if g = g1 - g2 , then g′ = -(g1 + g2)) Modifying parameters g, k, μ, and λ in a systematic way over time can be done to simulate combined treatment protocols, including various sequences of conventional chemotherapy or radiation, followed by immunotherapy [35, 36], targeted radiation to specific tumor masses that spares systemic damage to the patient's immune system, possible dose fractionation schemes, occasional drug holidays, etc. Initial estimates of model parameters for a particular type of cancer can be refined on the basis of ongoing clinical experience in a particular practice setting.
The robust nature of anti-tumor immunity suggested by Figures 1 through 4, illustrating the wide range of conditions resulting in complete tumor elimination, is contrary to the past reputation of immune therapy for cancer as being hit or miss, only occasionally successful, inconsistent, and most suitable as a last ditch effort when traditional treatments fail [11, 12, 37]. However, the same modeling results can help to explain how thoughtful observers could have reached such conclusions. Equations (1) and (2) imply that it is necessary to maintain consistent immune stimulation for up to several years and in many cases to tolerate noticeable tumor growth before a killing threshold is reached. Based upon experience with conventional chemotherapy, however, oncologists would tend to interpret continued tumor growth as a sign that immunotherapy is not working, and it would be discontinued. Early discontinuation of immune therapy would clearly lead to failure, providing evidence that such therapy is not effective. Mathematical models suggest that continued growth of the tumor may be necessary for immune therapy to work, so that the product xy or LT reaches a critical threshold. Thus predator-prey modeling may have a positive conceptual or intellectual impact by justifying patience and inhibiting the human impulse to stop immune therapy too early.
Simplified predator-prey models may be especially useful if parameter estimation can be customized for particular types of human cancer, for subpopulations of cancer patients with a particular cell type and stage of cancer, or perhaps even for individual patients. Sophisticated and expensive research personnel and equipment are not needed to estimate parameters g, k, λ, x0, and μ in Equations (2). Astute clinical observations, a calendar, and routine histopathological observations available in most hospitals are all that is needed. Both the model and the parameter estimation techniques are easily adapted to various human cancers that evoke an immune response.
References
- 1.Berryman AA. The origins and evolution of predator-prey theory. Ecology. 1992;73:1530–1535. [Google Scholar]
- 2.Andrew SM, Baker TH, Bocharov GA. Rival approaches to mathematical modelling in immunology. Journal of Computational and Applied Mathematics. 2007;205:669–686. [Google Scholar]
- 3.Asachenkov AL, Marchuk GI, Mohler RR, Zuev SM. Immunology and disease control: a systems approach. IEEE Trans Biomed Eng. 1994;41:943–953. doi: 10.1109/10.324526. [DOI] [PubMed] [Google Scholar]
- 4.Bell G. Predator-prey equations simulating an immune response. Mathematical Biosciences. 1973;16:291–314. [Google Scholar]
- 5.De Boer RJ, Hogeweg P, Dullens HF, De Weger RA, Den Otter W. Macrophage T lymphocyte interactions in the anti-tumor immune response: a mathematical model. J Immunol. 1985;134:2748–2758. [PubMed] [Google Scholar]
- 6.Kirschner D, Panetta JC. Modeling immunotherapy of the tumor-immune interaction. J Math Biol. 1998;37:235–252. doi: 10.1007/s002850050127. [DOI] [PubMed] [Google Scholar]
- 7.Mohler RR, Asachenkov AL, Marchuk GI. A systems approach to immunology and cancer. IEEE Transactions on Systems, Man, and Cybernetics. 1994;24:632–642. doi: 10.1109/10.324526. [DOI] [PubMed] [Google Scholar]
- 8.Zhivkov P, Waniewski J. Modelling tumour-immunity interactions with different simulation functions. Int J Appl Math Comput Sci. 2003;13:307–315. [Google Scholar]
- 9.Banerjee S. Immunotherapy with interlukin-2: a study based on mathematical modeling. Int J Appl Math Comput Sci. 2008;18:389–398. [Google Scholar]
- 10.Topalian SL, Weiner GJ, Pardoll DM. Cancer Immunotherapy Comes of Age. J Clin Oncol. 2005;2:115. doi: 10.1200/JCO.2011.38.0899. [DOI] [PMC free article] [PubMed] [Google Scholar]
- 11.Tomita Y, Katagiri A, Saito K, Imai T, Saito T, Tanikawa T, Terunuma M, Nishiyama T, Takahashi K. Adoptive immunotherapy of patients with metastatic renal cell cancer using lymphokine-activated killer cells, interleukin-2 and cyclophosphamide: long-term results. Int J Urol. 1998;5:16–21. doi: 10.1111/j.1442-2042.1998.tb00227.x. [DOI] [PubMed] [Google Scholar]
- 12.Weber J, Atkins M, Hwu P, Radvanyi L, Sznol M, Yee C. White paper on adoptive cell therapy for cancer with tumor-infiltrating lymphocytes: a report of the CTEP subcommittee on adoptive cell therapy. Clin Cancer Res. 2011;17:1664–1673. doi: 10.1158/1078-0432.CCR-10-2272. [DOI] [PubMed] [Google Scholar]
- 13.Robbins PF, Morgan RA, Feldman SA, Yang JC, Sherry RM, Dudley ME, Wunderlich JR, Nahvi AV, Helman LJ, Mackall CL, Kammula US, Hughes MS, Restifo NP, Raffeld M, Lee CC, Levy CL, Li YF, El-Gamil M, Schwarz SL, Laurencot C, Rosenberg SA. Tumor regression in patients with metastatic synovial cell sarcoma and melanoma using genetically engineered lymphocytes reactive with NY-ESO-1. J Clin Oncol. 2011;29:917–924. doi: 10.1200/JCO.2010.32.2537. [DOI] [PMC free article] [PubMed] [Google Scholar]
- 14.Morgan RA, Dudley ME, Wunderlich JR, Hughes MS, Yang JC, Sherry RM, Royal RE, Topalian SL, Kammula US, Restifo NP, Zheng Z, Nahvi A, de Vries CR, Rogers-Freezer LJ, Mavroukakis SA, Rosenberg SA. Cancer regression in patients after transfer of genetically engineered lymphocytes. Science. 2006;314:126–129. doi: 10.1126/science.1129003. [DOI] [PMC free article] [PubMed] [Google Scholar]
- 15.Sznol M, Dutcher JP, Atkins MB, Rayner AR, Margolin KA, Gaynor ER, Weiss GR, Aronson F, Parkinson DR, Hawkins MJ. Review of interleukin-2 alone and interleukin-2/LAK clinical trials in metastatic malignant melanoma. Cancer Treat Rev. 1989;(16 Suppl A):29–38. doi: 10.1016/0305-7372(89)90020-0. [DOI] [PubMed] [Google Scholar]
- 16.Golumbek PT, Lazenby AJ, Levitsky HI, Jaffee LM, Karasuyama H, Baker M, Pardoll DM. Treatment of established renal cancer by tumor cells engineered to secrete interleukin-4. Science. 1991;254:713–716. doi: 10.1126/science.1948050. [DOI] [PubMed] [Google Scholar]
- 17.Golumbek PT, Azhari R, Jaffee EM, Levitsky HI, Lazenby A, Leong K, Pardoll DM. Controlled release, biodegradable cytokine depots: a new approach in cancer vaccine design. Cancer Res. 1993;53:5841–5844. [PubMed] [Google Scholar]
- 18.Ryu J, Yang FC. A review of topical imiquimod in the management of basal cell carcinoma, actinic keratoses, and other skin lesions. Clinical Medicine: Therapeutics. 2009;1:1557–1575. [Google Scholar]
- 19.Pardoll DM. Cancer vaccines. Immunol Today. 1993;14:310–316. doi: 10.1016/0167-5699(93)90051-L. [DOI] [PubMed] [Google Scholar]
- 20.Gajewski TF, Fallarino F. Rational development of tumour antigen-specific immunization in melanoma. Ther Immunol. 1995;2:211–225. [PubMed] [Google Scholar]
- 21.Banchereau J, Ueno H, Dhodapkar M, Connolly J, Finholt JP, Klechevsky E, Blanck JP, Johnston DA, Palucka AK, Fay J. Immune and clinical outcomes in patients with stage IV melanoma vaccinated with peptide-pulsed dendritic cells derived from CD34+ progenitors and activated with type I interferon. J Immunother. 2005;28:505–516. doi: 10.1097/01.cji.0000171292.79663.cb. [DOI] [PubMed] [Google Scholar]
- 22.Romero P. Current state of vaccine therapies in non-small-cell lung cancer. Clin Lung Cancer. 2008;(9 Suppl 1):S28–36. doi: 10.3816/clc.2008.s.005. [DOI] [PubMed] [Google Scholar]
- 23.McLaughlin P, Grillo-Lopez AJ, Link BK, Levy R, Czuczman MS, Williams ME, Heyman MR, Bence-Bruckler I, White CA, Cabanillas F, Jain V, Ho AD, Lister J, Wey K, Shen D, Dallaire BK. Rituximab chimeric anti-CD20 monoclonal antibody therapy for relapsed indolent lymphoma: half of patients respond to a four-dose treatment program. J Clin Oncol. 1998;16:2825–2833. doi: 10.1200/JCO.1998.16.8.2825. [DOI] [PubMed] [Google Scholar]
- 24.Rundell A, DeCarlo R, HogenEsch H, Doerschuk P. The humoral immune response to Haemophilus influenzae type b: a mathematical model based on T-zone and germinal center B-cell dynamics. J Theor Biol. 1998;194:341–381. doi: 10.1006/jtbi.1998.0751. [DOI] [PubMed] [Google Scholar]
- 25.Gajewski TF. Molecular profiling of melanoma and the evolution of patient-specific therapy. Semin Oncol. 2011;38:236–242. doi: 10.1053/j.seminoncol.2011.01.004. [DOI] [PMC free article] [PubMed] [Google Scholar]
- 26.Starzi TE, Porter KA, Iwatsuki S, Rosenthal JT, Shaw BW, Atchison RW, Nalesnik MA, Ho M, Griffith BP, Hakala TR, Hardesty RL, Jaffee R, Bahnson HT. Reversibility of lymphomas and lymphoproliferative lesions developing under cyclosporin-steroid therapy. The Lancet. 1984;322:583–587. doi: 10.1016/s0140-6736(84)90994-2. [DOI] [PMC free article] [PubMed] [Google Scholar]
- 27.Euvrard S, Kanitakis J, Claudy A. Skin cancers after organ transplantation. N Engl J Med. 2003;348:1681–1691. doi: 10.1056/NEJMra022137. [DOI] [PubMed] [Google Scholar]
- 28.Galon J, Costes A, Sanchez-Cabo F, Kirilovsky A, Mlecnik B, Lagorce-Pages C, Tosolini M, Camus M, Berger A, Wind P, Zinzindohoue F, Bruneval P, Cugnenc PH, Trajanoski Z, Fridman WH, Pages F. Type, density, and location of immune cells within human colorectal tumors predict clinical outcome. Science. 2006;313:1960–1964. doi: 10.1126/science.1129139. [DOI] [PubMed] [Google Scholar]
- 29.Gooden MJ, de Bock GH, Leffers N, Daemen T, Nijman HW. The prognostic influence of tumour-infiltrating lymphocytes in cancer: a systematic review with meta-analysis. Br J Cancer. 2011;105:93–103. doi: 10.1038/bjc.2011.189. [DOI] [PMC free article] [PubMed] [Google Scholar]
- 30.Leffers N, Gooden MJ, de Jong RA, Hoogeboom BN, ten Hoor KA, Hollema H, Boezen HM, van der Zee AG, Daemen T, Nijman HW. Prognostic significance of tumor-infiltrating T-lymphocytes in primary and metastatic lesions of advanced stage ovarian cancer. Cancer Immunol Immunother. 2009;58:449–459. doi: 10.1007/s00262-008-0583-5. [DOI] [PMC free article] [PubMed] [Google Scholar]
- 31.Tat D, Polenakovik H, Herchline T. Comparing interferon-gamma release assay with tuberculin skin test readings at 48-72 hours and 144-168 hours with use of 2 commercial reagents. Clin Infect Dis. 2005;40:246–250. doi: 10.1086/426816. [DOI] [PubMed] [Google Scholar]
- 32.Kirkwood JM, Tarhini AA, Panelli MC, Moschos SJ, Zarour HM, Butterfield LH, Gogas HJ. Next generation of immunotherapy for melanoma. J Clin Oncol. 2008;26:3445–3455. doi: 10.1200/JCO.2007.14.6423. [DOI] [PubMed] [Google Scholar]
- 33.Drake CG, Jaffee E, Pardoll DM. Mechanisms of immune evasion by tumors. Adv Immunol. 2006;90:51–81. doi: 10.1016/S0065-2776(06)90002-9. [DOI] [PubMed] [Google Scholar]
- 34.Laursen ML, Laursen K. Dependence on antigen dose and timing in the immune response of C3H mice to malignant ascites cells. Immunology. 1980;40:403–410. [PMC free article] [PubMed] [Google Scholar]
- 35.Wada S, Yoshimura K, Hipkiss EL, Harris TJ, Yen HR, Goldberg MV, Grosso JF, Getnet D, Demarzo AM, Netto GJ, Anders R, Pardoll DM, Drake CG. Cyclophosphamide augments antitumor immunity: studies in an autochthonous prostate cancer model. Cancer Res. 2009;69:4309–4318. doi: 10.1158/0008-5472.CAN-08-4102. [DOI] [PMC free article] [PubMed] [Google Scholar]
- 36.Harris TJ, Hipkiss EL, Borzillary S, Wada S, Grosso JF, Yen HR, Getnet D, Bruno TC, Goldberg MV, Pardoll DM, DeWeese TL, Drake CG. Radiotherapy augments the immune response to prostate cancer in a time-dependent manner. Prostate. 2008;68:1319–1329. doi: 10.1002/pros.20794. [DOI] [PMC free article] [PubMed] [Google Scholar]
- 37.Sznol M. Betting on immunotherapy for melanoma. Curr Oncol Rep. 2009;11:397–404. doi: 10.1007/s11912-009-0053-z. [DOI] [PubMed] [Google Scholar]


