

Abstract
Many molecules regulate synaptogenesis, but intracellular signaling pathways required for their functions are poorly understood. Afadin is a Rap-regulated, actin-binding protein that promotes cadherin complex assembly as well as binding many other cell adhesion molecules and receptors. To examine its role in mediating synaptogenesis, we deleted afadin (mllt1), using a conditional allele, in postmitotic hippocampal neurons. Consistent with its role in promoting cadherin recruitment, afadin deletion resulted in 70% fewer and less intense N-cadherin puncta with similar reductions of β-catenin and αN-catenin puncta densities and 35% reduction in EphB2 puncta density. Its absence also resulted in 40% decreases in spine and excitatory synapse densities in the stratum radiatum of CA1, as determined by morphology, apposition of presynaptic and postsynaptic markers, and synaptic transmission. The remaining synapses appeared to function normally. Thus, afadin is a key intracellular signaling molecule for cadherin recruitment and is necessary for spine and synapse formation in vivo.
Introduction
Synapses are formed at contacts between neurons as a result of intercellular interactions that result in stepwise assembly of synaptic constituents (Waites et al., 2005; Jin and Garner, 2008). Adhesive interactions are early key events in synaptogenesis and appear to be required for synapse formation. Consistent with this, expression of several different cell adhesion molecules in heterologous cells can induce presynaptic or postsynaptic development in apposed neurons. Probably because of redundancy, however, in vertebrates genetic deletion of single adhesion molecules appear to have comparatively minor effects on synapse number in vivo.
Cadherins are a family of adhesion molecules that regulate many steps in neural development, including neurogenesis, neuronal migration, and spine and synapse formation (Takeichi, 2007). In Drosophila, absence of N-cadherin prevents normal synapse formation between photoreceptor axons and their targets (Clandinin and Feldheim, 2009). Probably because vertebrate neurons express multiple cadherins, the absence of single cadherins does not have dramatic effects on synapse formation (Takeichi, 2007).
In epithelial cells, cadherin localization and activation are strongly promoted by a family of Ig superfamily proteins named nectins (Takai et al., 2008). The nectins associate with the cadherin complex through the adaptor protein afadin, which binds nectins and two cadherin-associated proteins, p120–catenin and α-catenin. Afadin provides an essential link between nectins and the cadherin complex and promotes cadherin clustering and activity, thereby regulating adherens junction formation and stability. Both in vitro and in vivo observations indicate that absence of afadin impairs cadherin functions (Takai et al., 2008). Importantly, the PDZ domain of afadin binds several EphB receptors and neurexins, which each promote synapse formation in vitro (Hock et al., 1998; Buchert et al., 1999; Dalva et al., 2007). Thus, afadin may promote synapse formation through promoting association of cadherins with several proteins implicated in synapse formation.
Conventional afadin mutants die at E10 with deficits in epithelial cell adhesion and polarity (Ikeda et al., 1999; Zhadanov et al., 1999). Thus, we generated a conditional allele of afadin to characterize its roles in the nervous system. By limiting deletion of afadin to excitatory neurons, we were able to characterize the function of this gene in neuronal differentiation. Results demonstrate that the absence of afadin results in a striking reduction in excitatory synaptic density without obvious effects on the morphology or function of the remaining synapses in CA1. Absence of afadin reduces the density and intensity of cadherin- and catenin-containing puncta without reducing overall cadherin or catenin levels. Additionally, loss of afadin caused a reduction in EphB2 puncta density consistent with the loss of synapses. Thus, afadin is a key regulator of excitatory synapse number in vivo and may control synapse density, in part, through regulating cadherin localization.
Materials and Methods
Generation of Nex–cre; afadin floxed mice.
A 13.5 kb HindIII fragment was retrieved from an SVJ129 bacterial artificial chromosome by gap repair of pCRII–topo vector containing two 500 bp fragments homologous to the 5′ and 3′ ends of the retrieved fragment. The 5′ loxP site and a HindIII site was incorporated upstream of exon two by PCR and cloned upstream of an enhanced flippase recombinase (flpE) site flanked phosphoglycerate-kinase–Neomycin (PGK–Neo) with a 3′ loxP site (Fig. 1). The 5′ homology arm was cloned as a XmnI–EcoRI fragment upstream of the lone 5′ loxP site. The 3′ homology arm was cloned as an XbaI–ApaI fragment next to a PGK–diphtheria toxin A (dtA) expression cassette. The 5′ homology arm, floxed exon 2, and PGK–Neo cassette was cloned into the vector containing the 3′ homology arm and PGK–dtA cassette by selecting for ampicillin and kanamycin resistance. The resulting plasmid was linearized upstream of the 5′ homology arm and electroporated into the feederless mouse embryonic stem cell line, E14. After several days, transfected cells were selected by treatment with G418. Isolated colonies were selected, expanded, and screened by Southern blotting HindIII-digested genomic DNA. Two clones were expanded and rescreened before injection into C57BL/6J. Both ES cell lines were incorporated in the germ line and produced fertile, chimeric males. Southern blotting HindIII-digested genomic DNA was used to confirm homologous recombination of the afadin locus in mice. Genotyping of the Neo line used a 5′ primer specific to the wild-type (WT) locus (primer 1, 5′-CCT TGG GAA CAA CAG GAC ACC-3′), a 5′ primer that anneals in the Neo cassette (primer 3, 5′-TTG CGG AAC CCT TCG AAG TTC-3′), and a common 3′ primer that anneals in the WT locus (primer 2, 5′-TCA GTA CAG GGG AAC ACC AGG G-3′). Primers 1 and 2 detect the WT allele and produce a 188 bp band by PCR. Primers 2 and 3 detect the targeted locus and produce a 296 bp fragment by PCR. To generate the flox allele, the Neo mice were crossed to β-actin–flp recombinase mice to remove the Neo cassette (Rodríguez et al., 2000). Genotyping for the flox allele used primers 1 and 2, which anneal in the WT genomic DNA but which now produces a 315 bp band by PCR. Loss of the Neo expression cassette was confirmed by PCR, by showing a lack of product with primers 2 and 3 and a band of the correct size with primers 1 and 2. Nex–cre; afadinF/F mutants were generated by mating with Nex–cre mice (Goebbels et al., 2006).
Figure 1.

Creation of a conditional null allele of afadin (mllt-4). A, Schematics from top to bottom of the WT allele, Targeting construct, Neo allele, and flox allele. The WT allele is a schematic of the WT afadin (mllt-4) genomic allele depicting exons 2–5 and important restriction enzyme recognition sites. The targeting construct shows the location of the inserted loxP sites (gray triangles), flpE sites (white triangles), PGK–Neo, and PGK–dtA. The Neo allele depicts the afadin locus after homologous recombination with the targeting construct. The locations of the loxP and Flp sites and PGK–Neo cassette are shown. The flox allele depicts the afadin locus after Flp recombinase-mediated excision of the PGK–Neo cassette. The location of the 5′ and 3′ probes used for Southern blotting and the primers used for PCR genotyping are depicted on all relevant alleles. H3, HindIII; Xm, XmnI; RI, EcoRI; Xh, XhoI; A, ApaI. B, Southern blots using the 5′ and 3′ probes demonstrate homologous recombination of the targeting construct into the genome. HindIII digestion of the WT allele (+) results in a 13.5 kb fragment recognized by either the 5′ or 3′ probes, whereas the Neo allele (N) digested with HindIII results in a 4.5 kb fragment recognized by the 5′ probe and a 8 kb fragment by the 3′ probe. C, PCR-based genotyping of the Neo allele (N, 296 bp) compared with the WT allele (+, 188 bp), using primers 1, 2, and 3. D, PCR-based genotyping of the flox allele (F, 315 bp) compared with the WT allele (+, 188 bp), using only primers 1 and 2. E, Western blot quantification of l/s-afadin protein expression in WT and homozygous Neo mice (Neo/Neo) demonstrated no significant change in Neo allele homozygotes normalized to total protein expression. Error bars depict SD; n = 3 littermate controls and mutants.
Western blotting.
Hippocampi were dissected, placed in microcentrifuge tubes, frozen in a dry ice and ethanol slurry, and stored at −80°C until later use. Frozen tissue was homogenized with an Ultra-Turrax T25 disperser (IKA Works) in a modified RIPA buffer [150 mm sodium chloride, 50 mm Tris, pH 7.5, 10% glycerol, 0.1% SDS, 0.5% sodium deoxycholate, 1% Triton X-100, 1 mm EDTA, and 1 mm EGTA with addition on the day of use: 1 mm sodium orthovanadate, 10 mm sodium fluoride, and Complete Protease Inhibitor Cocktail (Roche Applied Science) and addition of 1 mm PMSF just before homogenization]. The tissue was fully solubilized because centrifuging for 15 min at 15,000 rpm yielded no visible pellet. Protein concentration was quantified by use of a protein assay kit (MicroBCA protein assay kit; Pierce) following the instructions of the manufacturer. A total of 22.5 μg of each protein lysate was fractionated by SDS-PAGE and transferred to nitrocellulose membrane. The membrane was stained for total protein using SyPro Ruby protein blot stain (Lonza Rockland) according to a manufacturer-provided protocol and imaged using a fluorescent imager (FLA-2000; Fujifilm). The following primary antibodies were used: mouse anti-AF6 (anti-afadin) (1:500; BD Biosciences Transduction Laboratories), rabbit anti-pan-Cadherin (1:1000; Sigma), mouse anti-N-Cadherin (1:100; 13A9 cell supernatant kindly provided by Margaret Wheelock), mouse anti-β-catenin (1:1000; Zymed Laboratories), mouse anti-p120 (1:4000; BD Biosciences Transduction Laboratories), rat anti-αN-catenin (1:1000; Developmental Studies Hybridoma Bank), mouse anti-β-tubulin (mABE7) (1:1000; Developmental Studies Hybridoma Bank), goat anti-nectin-1 (1:1000; Santa Cruz Biotechnology), rabbit anti-nectin-3 (1:300; Santa Cruz Biotechnology), and rabbit anti-EphB2 (1:100; Dr. Iryna Ethell, University of California, Riverside, Riverside, CA). Species-specific secondary antibodies tagged with alkaline phosphatase (Jackson ImmunoResearch) were used to detect primary antibodies. The blots were developed with ECF (Invitrogen) according to the guidelines of the manufacturer and imaged with a fluorescent imager (FLA-2000; Fujifilm). For Western blotting EphB2, a horseradish-peroxidase-linked anti-rabbit secondary was used with ECL (GE Healthcare) and exposed to film. The film was scanned and analyzed. All quantifications were done in ImageGuage (Fujifilm), and analysis was done with Microsoft Excel.
Fluorescence and immunofluorescence.
Animals were perfused intracardially in succession with PBS and 4% paraformaldehyde in PBS. The dissected brains were postfixed for 2 h and for immunofluorescence procedures cryopreserved in a series of 10%, 20%, and 30% sucrose in PBS. The brains were trimmed for coronal sectioning, mixed with OCT compound (TissueTek) for several hours to overnight, and frozen on dry ice. Brains were cut into 20 μm sections with a cryostat (Jung Frigocut 2800N; Leica Microsystems), collected serially onto glass slides, and stored at −80°C. A selection of slides from each brain was Nissl stained with cresyl violet to match slides between animals along the rostrocaudal axis of the hippocampus. Blocking buffer (5% normal donkey or goat serum, 0.2% Triton X-100 in PBS) was used throughout the staining procedure. The following primary antibodies were applied overnight: rabbit anti-l/s-afadin (1:1000; Sigma), goat anti-N-cadherin (1:100; Santa Cruz Biotechnology), mouse anti-β-catenin (1:1000; Zymed Laboratories), rat anti-αN-catenin (1:100; Developmental Studies Hybridoma Bank), rabbit anti-nectin-1 (1:100; Santa Cruz Biotechnology), goat anti-nectin-3 (1:100; Santa Cruz Biotechnology), or rabbit anti-EphB2 (1:100; Dr. Iryna Ethell). Sections were washed in blocking buffer, stained with secondary antibodies made in donkey or goat (Invitrogen), again washed in blocking buffer, and then stained with Sytox Blue (1:1000; Invitrogen) in PBS for 15 min. All images were taken with an LSM-Pascal (Carl Zeiss) using a 40× Plan-Apochromat, 63× Plan-Apochromat, or a 100× Plan-Apochromat objective. Image analysis and quantification were performed in NIH ImageJ, with results prepared in Microsoft Excel, and figures were assembled in Adobe Photoshop (Abode Systems). Puncta analysis was based on finding local maxima, using the “Find Maxima…” function, rather than setting an absolute threshold, thereby allowing for comparison of integrated density. Specifically, we used the “Maxima Within Tolerance” setting with the same noise level, chosen to prevent fusing multiple puncta together, applied to all images. Finally, this thresholded image was used to mask the original image, and this masked image was analyzed with the “Analyze Particles…” function by setting a threshold of 1. For images with significant puncta density, we set a threshold at the average peak fluorescence value, with the same setting used for all images, and used the “Find Maxima…” function with “Segmented Particles” setting above the threshold.
Details of the Scholl analysis are listed below (see Golgi staining). For dendritic branching analysis, a Nex–cre; afadinF/F mouse was crossed to a Thy1–YFP line H; afadinF/F mouse to produce mutants and controls carrying the Thy–YFP transgene (Feng et al., 2000). Pyramidal cells of the hippocampus usually extend an apical branch through the stratum radiatum (SR) bifurcating once before reaching the stratum lacunosum-moleculare (SLM). Semaphorin 3A was shown to regulate dendritic branching through examination of this bifurcation of the apical branch, using the marker line Thy1–YFP (Schlomann et al., 2009). Animals were perfused as listed above, but after postfixing, the brains were transferred to PBS with 0.02% sodium azide and stored in the dark at 4°C until sectioned. The brains were sectioned sagittally at 150 μm with a vibratome (VT-1000; Leica Microsystems). A few medial sections were dehydrated in a series of increasing ethanol concentration (50, 70, 95, 100, and100%) and cleared with dropwise addition of methylsalicylate until the ethanol evaporated. The endogenous GFP fluorescence in the sections was imaged through the full thickness of the tissue with an LSM Pascal using a 40× Plan-Apochromat objective. Using NIH ImageJ, the position of the first branch point of the apical dendrite within the SR was measured relative to the thickness of the SR at that point. To aid in identification of this branch point in the z-stack, the z-stack was depth coded by color and then maximally z-projected for either the entire stack or several sections of the stack at a time. The results were averaged and compared using Microsoft Excel.
For stochastic optical reconstruction microscopy (STORM), sections were subjected to heat-induced antigen retrieval: 10 min in pH 6.25, 10 mm sodium citrate at 90–94°C. Sections were blocked and incubated overnight with mouse anti-bassoon (1:200; Assay Designs), rabbit anti-glutamate receptor 1 (1:200; Millipore Bioscience Research Reagents), and rabbit anti-glutamate receptor 2 (1:200; Millipore Bioscience Research Reagents) in 3% BSA and 0.1% Triton X-100 in PBS. Sections were washed and incubated in donkey anti-mouse dual labeled with Alexa Fluor 405 and Alexa Fluor 647 and donkey anti-rabbit dual-labeled with Cy3 and Alexa Fluor 647 (unlabeled secondary antibody from Jackson ImmunoResearch).
STORM image acquisition and analysis.
All sections were mounted in buffer containing PBS, 1 m mercaptoethylamine, pH 8.5, 50% glucose in MilliQ water and oxygen scavenging solution (10 mg of glucose oxidase, 25 μl of catalase in 100 μl of PBS) in the ratio of 80:10:10:1. STORM setup and image acquisition were similar to previous descriptions (Dani et al., 2010), but only two-dimensional imaging was performed. Briefly, images were acquired using a STORM microscope built from a Nikon Eclipse Ti-E inverted microscope with a perfect-focusing system. The microscope was fitted with two activation lasers (405 nm, Stradus 405, Vortran; 561 nm, Sapphire 561-200-CW, Coherent) and one imaging laser (642 nm, Stradus 642; Vortran). The laser beams were aligned, and the expanded, collimated beams were focused at the back focal plane of the 100× Plan Apo VC NA 1.4 objective (Nikon). A quad-pass dichroic (ZT405/488/561/640RPC; Chroma Technology) and a bandpass filter (ET705/70m; Chroma Technology) separated the emission from excitation light. Images were recorded with an EMCCD camera (Ixon DU897E-CS0-BV; Andor).
The region of interest was identified by observing the slide at low magnification (using a 10× objective) and under dark-field mode. Two-color STORM data were acquired after switching to 100× objective and then performing imaging at 60 Hz with one frame of illumination with activation lasers (405 nm for Alexa Fluor 405–647 or 561 nm for Cy3–Alexa Fluor 647) alternating with three frames of illumination with imaging laser (642 nm) (Dani et al., 2010). The focus on the slide was determined, and the out-of-focus signal was reduced by illuminating with imaging laser (642 nm) and deactivating the fluorophores in the samples above and below the focal plane. STORM movie of 40,000–50,000 frames was acquired at constant powers for activation (1–5 μW) and imaging laser (30 mW).
STORM analysis was performed using custom software. Two-color imaging, correction to the sample drift in the lateral direction during acquisition, and subtraction of the crosstalk between the two imaging channels were done using algorithms described previously (Dani et al., 2010). The high-resolution images were exported as pictures with 50-nm-sized pixels by counting the number of localization points in each pixel and were further analyzed by a custom-written macro in NIH ImageJ, entitled “Synaptic Co-Localization-STORM.” The macro identifies and analyzes synapses by finding apposing presynaptic and postsynaptic puncta of sufficient size and signal intensity, automatically and objectively processing all images with the same settings. The macro is to be submitted to the NIH ImageJ website simultaneously with publication.
Golgi staining.
Golgi staining was performed using a rapid Golgi-Cox kit (FD Neurotechnologies) on freshly dissected brain trimmed to include only the forebrain. The protocol was followed in detail, although the following specifics are lacking from the protocol. The tissue was incubated in solution AB for 2 weeks. The tissue was embedded in Tissue Freezing Medium (Triangle Biomedical Sciences) and frozen in a bath of dry ice and isopentane. The tissue was sectioned into 100 μm sections in a cryostat at −22°C. The sections were dried for 3–4 d after sectioning. The sections were protected from light during all stages of the procedure. For counting spines, the sections were imaged with a Carl Zeiss Axiovert 200M using a 63× LCI Plan-Neofluar objective in glycerol mode, using a 1.6× optovar, and images were collected as a z-stack using Slidebook software (Intelligent Imaging Innovations). For increased resolution, images were collected using a Nikon E600 with a 60× Plan-Apo water-immersion objective by a Carl Zeiss AxioCam HRc and Axiovision software.
For Scholl analysis, the full thickness of the Golgi-stained section was imaged by confocal reflectance using an LSM Pascal with a 20× Plan-NeoFluar objective. In brief, the confocal was set to illuminate the section with the 458 nm laser line, which gives the best z-resolution, and to collect the same wavelength. The resulting z-stack was analyzed in Imaris (Bitplane) to trace apical dendrites of individual pyramidal neurons and to compute the Scholl analysis in three dimensions. Microsoft Excel was used for collating and analyzing the results.
Electron microscopy.
Mice were perfused transcardially with 0.9% sodium chloride, followed by fixative (2.5% glutaraldehyde and 1% paraformaldehyde in 0.1 m cacodylate buffer, pH 7.4). Brains were postfixed overnight and cut into thick 100 μm sections with a vibratome. Sections were trimmed to include CA1, CA3, and the dentate gyrus to allow for identification of a similar region in the electron microscope. The sections were dehydrated, fixed in osmium tetroxide, and embedded in Epon-Araldite. Semithin sections were cut and stained with toluidine blue to ensure proper orientation of the tissue block. Ultrathin sections were cut and stained with lead citrate and uranyl acetate. Sections were imaged and photographed using the electron microscope core in the University of California, San Francisco Department of Anatomy. Specifically, images were taken at random within CA1–SR dorsal to the dentate gyrus, approximately two times the thickness of the stratum pyramidal (SP) from the SP. Eight films, corresponding to 512 μm2, were scanned and further analyzed in NIH ImageJ. Specifically, synapses were identified by apposition of a postsynaptic density (PSD) and a presynaptic bouton with at least four synaptic vesicles. At least 110 synapses were identified in each animal. Shaft synapses were distinguished by the presence of microtubules and as appearing on a large-diameter fiber. The PSD was directly measured on all identified synapses. The bouton was outlined and measured as the region of the enlarged axon with synaptic vesicles and cytoplasmic material with limited microtubules. Bouton analysis was done using the synapses from four micrographs and at least 50 synapses per animal.
Electrophysiology.
Transverse hippocampal slices were prepared from control and mutant littermate mice of either sex, 5–7 weeks of age. Animals were anesthetized with isoflurane, and the whole brain was removed and transferred into ice-cold cutting solution containing the following (in mm): 75 sucrose, 87 NaCl, 25 glucose, 25 NaHCO3, 2.5 KCl, 1.25 NaH2PO4, 7 MgCl2, and 0.5 CaCl2 (equilibrated with 95% O2/5% CO2). The brain was glued onto the stage of a vibratome slicer, and 450 μm slices were cut and then allowed to recover for at least 1 h at 34°C in an incubation chamber with artificial CSF (ACSF) containing the following (in mm): 125 NaCl, 25 NaHCO3, 2.5 KCl, 1.25 NaH2PO4, 1 MgCl2, 2 CaCl2, and 25 glucose (equilibrated with 95% O2/5% CO2). Recordings were performed in a submerged bath recording chamber continuously superfused with ACSF at a flow rate of 2 ml/min at 32–34°C using a MultiClamp 700A amplifier (Molecular Devices) and pClamp acquisition software. Field EPSPs (fEPSPs) were evoked with a bipolar platinum stimulating electrode (FHC) placed to stimulate Schaffer collateral afferents and were detected using glass electrodes filled with 2 m NaCl placed in the CA1 SR ∼50–100 μm away from the stimulation site. fEPSPs were evoked with electrical pulses of duration 100 μs and amplitude 15–70 μA delivered at intersweep intervals of 0.067 Hz. Data were acquired at 10 kHz using pClamp 10.2 (Molecular Devices), filtered at 2 kHz, and analyzed using Clampfit software (Molecular Devices).
Results
Conditional loss of afadin in hippocampal pyramidal neurons
To address the role of afadin in neuronal morphogenesis and synaptogenesis, we generated a conditional allele of afadin (mllt-4) in which loxP sites surround exon 2 (Fig. 1A,B). Cre-mediated deletion of exon 2 results in a frame shift and premature stop codon within exon 3 that should result in mRNA destabilization (Mendell et al., 2004). Additionally, exon 2 encodes part of the first Ras association domain, essential for afadin function, that is present in all known afadin isoforms (Takai et al., 2008). Both the Neo and flox allele homozygotes were viable and did not detectably reduce afadin expression (Fig. 1E and data not shown). The flox allele of afadin was used for additional studies (Fig. 1A).
For this study, the afadin flox allele was crossed with the forebrain-specific Nex–cre knock-in (Goebbels et al., 2006). This cre line promotes efficient recombination in excitatory postmitotic neurons and intermediate neural progenitors in the cortex and hippocampus but not neural epithelial cells or astroglia (Wu et al., 2005; Goebbels et al., 2006; Mulder et al., 2008). Because of the heterogeneity of synapses in the cortex, we focused on the hippocampus, examining the synapses formed by CA3 pyramidal cells onto CA1–SR. Western blot analysis of adult hippocampal extracts demonstrated a fourfold reduction in afadin in the mutant (Fig. 2A,B). The remaining expression likely reflects afadin expression in glia, inhibitory neurons, and endothelia. By immunofluorescence, we observed substantial loss of afadin expression in the mutant CA1–SR, with some expression remaining in the SP (Fig. 2C,D).
Figure 2.

Afadin expression is reduced in the hippocampus after Nex–cre-mediated deletion. A, Western blots for afadin in control (Con) and mutant (Mut) hippocampal lysates demonstrate a significant loss of both the long and short afadin isoforms. Molecular weights are listed in kilodaltons. B, Quantification of afadin protein blots in mutant (Mut) versus control (Con). Individual blots were normalized to total protein. Error bars depict SEM; *p < 0.0001; n = 6. C, D, Decreased afadin expression in mutant (D) versus control (C) demonstrated by immunocytochemical visualization of l/s-afadin (red) and nuclei (blue) in CA1–SR and CA1–SP. Scale bar, 25 μm.
Loss of afadin impairs N-cadherin, β-catenin, and αN-catenin clustering
To determine whether absence of afadin results in impaired cadherin localization within the CA1 hippocampus, we examined N-cadherin localization by immunofluorescence in control and mutant (Fig. 3A,B) sections. Quantification of N-cadherin puncta density indicated that the mutant contained only 30% of the puncta present in the control (Fig. 3C). Although the remaining mutant puncta appeared normal in area (Fig. 3D), the average total fluorescence intensity within each puncta was reduced by 30% in the mutant (Fig. 3E). To determine whether the reductions in N-cadherin puncta density were accompanied by similar reductions in the densities of cadherin-associated proteins, we also examined and quantified the densities of β-catenin and αN-catenin puncta. Results, presented in Figure 3F–O, show that absence of afadin resulted in loss of approximately two-thirds of the β-catenin puncta and 60% of the αN-catenin puncta. Because one potential explanation for these data would be reduced expression of these proteins, we also determined whether cadherin and catenin protein levels were altered in the mutant by protein blot (Fig. 3P). Results indicate that absence of afadin did not alter the total expression levels of N-cadherin, total cadherins, αN-catenin, β-catenin, or p120–catenin (Fig. 3Q). Thus, absence of afadin results in reduced clustering of N-cadherin, β-catenin, and αN-catenin without affecting cadherin and catenin levels. The most likely explanation of these observations is that absence of afadin impairs formation of cadherin clusters that in turn results in reduced clustering of cytoplasmic cadherin-associated proteins.
Figure 3.
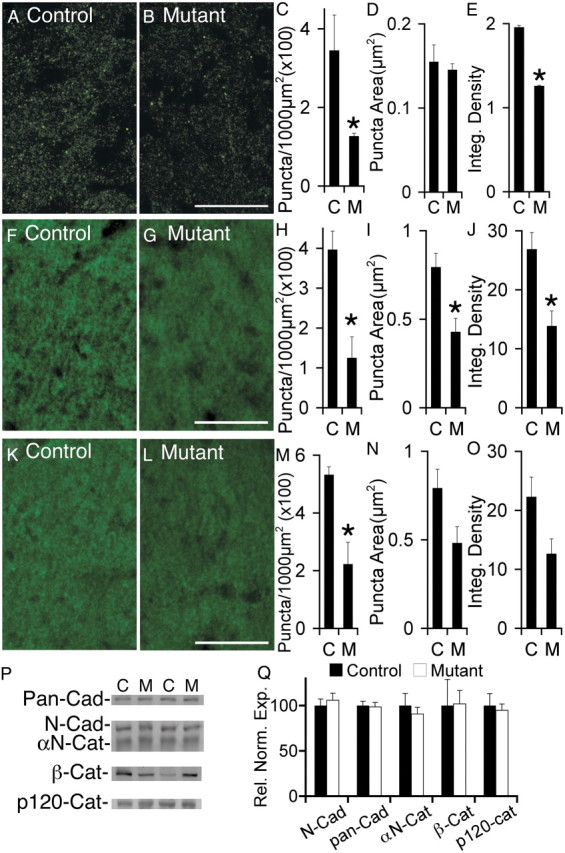
Loss of afadin results in reduced N-cadherin puncta density without a change in total expression of cadherin, catenins, nectins, or EphB2. A, B, Visualization of N-cadherin in control (A) and mutant (B). C–E, Significant reduction in N-cadherin puncta density (C) and integrated density (F) in mutant (M) versus control (C). No significant difference was detected in puncta size, as determined by average area (D). In C–E, *p < 0.005, n = 3 littermate controls and mutants. F, G, Visualization of β-catenin in control (F) and mutant (G). H–J, Significant reduction in β-catenin puncta density (H), puncta area (I), and integrated density (J) in mutant (M) versus control (C). In H–J, *p < 0.02. K, L, Visualization of αN-catenin in control (K) and mutant (L). M–O, Significant reduction in αN-catenin puncta density (M) in mutant (M) versus control (C). No significant differences were detected in puncta size (N) or integrated density (O). In M, *p < 0.05. In H–J and M–O, n = 4 littermate controls and mutants. P, Protein blot analyses of cadherin and catenin expression in hippocampal lysates from control (C) and mutant (M) demonstrated no significant changes. Shown are representative lanes from blots using anti-pan-cadherin (Pan-Cad), anti-N-cadherin (N-Cad), anti-αN-catenin (αN-Cat), anti-β-catenin (β-Cat), and anti-p120–catenin. Q, Quantification of blots for cadherin and catenin protein expression in mutant versus control. Blots were normalized to total protein. n = 4 controls, 5 mutants. Scale bars, 20 μm. Error bars depict SEM.
Afadin is known to bind through its PDZ domain several cell surface receptors, including nectins and Eph receptors (Buchert et al., 1999; Takahashi et al., 1999), and nectins acting through afadin have been shown to strongly promote cadherin clustering and activation (Takai et al., 2008). Interestingly, when we examined the effects of the absence of afadin on localization of nectin-1 or nectin-3, we observed little change in clustering of either protein (Fig. 4A–F), consistent with the likelihood that the nectins function upstream of afadin in controlling clustering of cadherins and catenins. In contrast, we did observe a significant reduction of 35% in EphB receptor puncta density (Fig. 4G–I). Additionally, we tested the expression level of nectin-1, nectin-3, and EphB2 in hippocampal lysates of controls and mutants (Fig. 4J). We observed that absence of afadin did not alter total expression levels of any of these three proteins (Fig. 4K).
Figure 4.
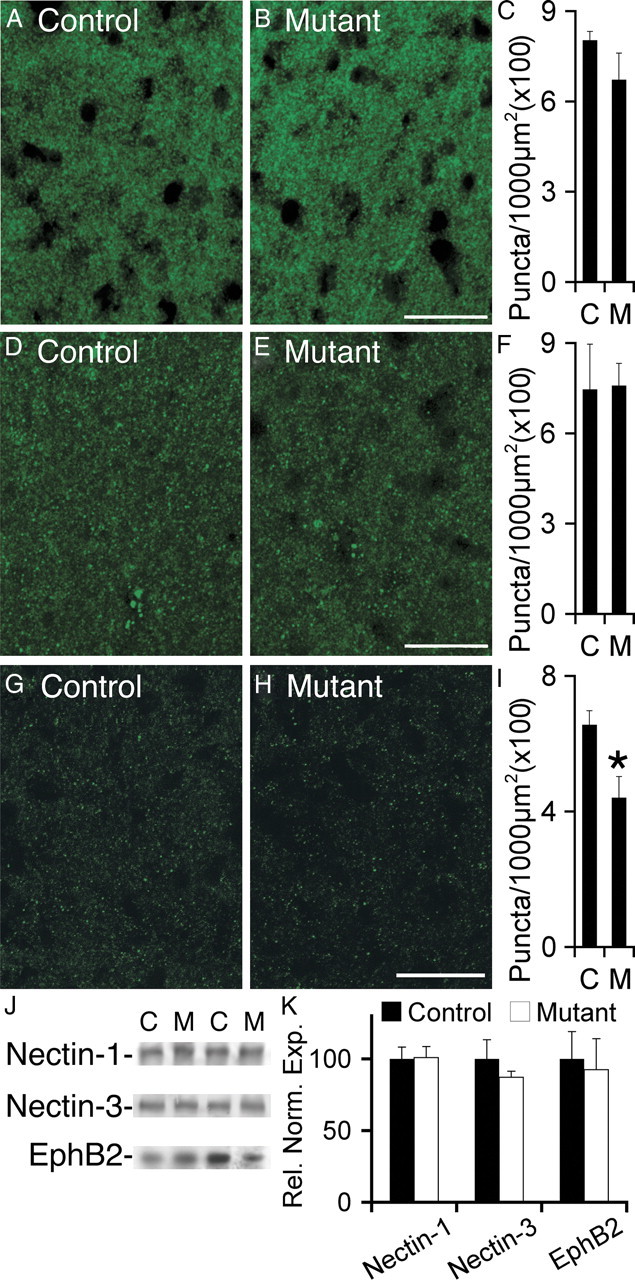
Loss of afadin results in reduced EphB2 puncta density without a change in nectin-1 or nectin-3 puncta density or total expression of nectins and EphB2. A–C, Visualization of nectin-1 in control (A) and mutant (B) demonstrated no significant reduction in puncta density (C) in mutant (M) versus control (C). D–F, Visualization of nectin-3 in control (D) and mutant (E) demonstrated no significant reduction in puncta density (F) in mutant (M) versus control (C). G–I, Visualization of EphB2 in control (G) and mutant (H) demonstrated a significant (*p < 0.05) reduction in puncta density (I) in mutant (M) versus control (C). In C, F, and I, n = 4 littermate controls and mutants. J, Blot analyses in hippocampal lysates from control (C) and mutant (M) demonstrated no significant changes in nectin-1, nectin-3, or EphB2 expression levels. Shown are representative lanes from blots for nectin-1, nectin-3, and EphB2. K, Quantification of blots for nectin-1, nectin-3, and EphB2 in mutant versus control. Blots were normalized to β-tubulin or total protein expression. For nectin-1 and nectin-3, n = 4 controls, 5 mutants; for EphB2, n = 6 controls, 5 mutants. Scale bars, 20 μm. Error bars depict SEM.
Altered lamination but normal dendritic development in mutant CA1
Cadherins regulate cell sorting and migration (Takeichi, 2007, 2011). Additionally, loss of αN-catenin results in mislocalization and dispersion of CA1 and CA3 pyramidal cells (Park et al., 2002). Although hippocampal lamination was not perturbed (data not shown), a small number of CA1 pyramidal cell bodies were mislocalized to the stratum oriens (SO) (10%) or SR (5%) in the mutant compared with virtually no mislocalization in controls (Fig. 5). Nonetheless, dendrite development appeared comparatively normal. We observed no difference in the location of the first apical branch of pyramidal cells in the mutant (Fig. 6A–C). Using Scholl analysis, we found no difference in the dendritic length or pattern of branching within the SR (Fig. 6D). In addition, we found no obvious change in the dendritic branching patterns of the misplaced pyramidal cells. In summary, despite previous in vitro studies suggesting roles for the catenins and N-cadherin in regulating dendritic growth, dendrites appear comparatively normal in the afadin mutant (Takeichi, 2007).
Figure 5.

Localization of hippocampal CA1 pyramidal cells after Nex–cre-mediated deletion of afadin. A, B, Loss of afadin results in mislocalization of ∼15% of cre-expressing neurons. In the control (A, afadinF/+; Nex–cre), these neurons are exclusively localized to the SP. In the mutant (B, afadinF/F; Nex–cre), 15% are found in the adjacent SO and SR layers. Neurons were identified by expression of cre recombinase. Scale bar, 50 μm. C, Quantification of the percentage of Cre-expressing cells in the SO and SP in controls (white bars) and mutants (black bars). Error bars depict SD. *p < 0.05, n = 3 littermate controls and mutants.
Figure 6.

Analysis of dendritic branching in the Nex–cre; afadin mutant. A, B, The location of the bifurcation of the apical dendrite (arrowhead) of Thy1–YFP–H-labeled, CA1 pyramidal cells was analyzed in control (A) and Nex–cre mutant (B) relative to the thickness of the SR. The image stack was pseudocolored by depth before performing a maximal z-projection. Scale bar, 50 μm. C, Average position of the first bifurcation of the apical dendrite relative to the thickness of the SR demonstrated no significant difference between control (C) and mutant (M). Error bars depict SD. n ≥ 60 neurons analyzed from 3 mice. D, Scholl analysis revealed no difference in complexity of the dendritic tree between control and mutant mice. Error bars depict SEM. n = 6 neurons from 3 littermate controls and mutants.
Spine density is reduced in afadin mutant hippocampus
Because most excitatory synapses are localized on spines, synapse number can be altered as a result of changes in spine number, as is observed in compound EphB null mice (Kayser et al., 2006). Additionally, cadherins and catenins have been implicated in spine morphogenesis in vivo and in vitro (Takeichi, 2007). To examine the role of afadin in regulating spine formation by CA1 pyramidal neurons, we used Golgi analysis to visualize and quantify their dendritic spines in the CA1–SR of controls and mutants (Fig. 7A,B). Interestingly, the afadin null pyramidal neurons exhibited a 43% decrease in spine density (Fig. 7C). The reduced density of spines may be a consequence of the 70% reduction in cadherin puncta density, because substantial previous work in vitro has implicated cadherins, especially N-cadherin, in spine formation and stability (Takeichi, 2007).
Figure 7.

Reduced spine density on pyramidal cell dendrites in CA1 SR in the afadin mutant. A, B, Representative Golgi-stained images of spine densities in mutant (B) and control (A). Scale bar, 10 μm. C, Quantification of spine densities in control (Con) and mutant (Mut). Error bars depict SD. *p < 0.05, n = 3.
Ultrastructural analysis of excitatory synapses in the SR of the afadin mutant
To determine whether the absence of afadin results in reduced synapse density, we quantified CA1–SR synapse density by EM. Synapses were identified as having a presynaptic density plus synaptic vesicles juxtaposed to a PSD (Fig. 8A–D). Few inhibitory synapses, identified by PSD appearance, were observed. We observed a 31% lower density of excitatory synapses in the mutant (22.9 ± 2.7/100 μm2) versus control (33.3 ± 3.5/100 μm2) (Fig. 8E). We also observed a 30% increase in average presynaptic terminal area in the mutant compared with control (Fig. 8F), consistent with synaptophysin puncta area quantification by immunofluorescence (data not shown). We detected no increase in the number of split PSDs (Fig. 8G) or changes in PSD length in the mutant (Fig. 8H), suggesting that postsynaptic structure is normal in the mutant. In summary, the 43% reduction in spine density correlated well with a similar reduction of 31% in the density of excitatory synapses in the afadin mutant.
Figure 8.
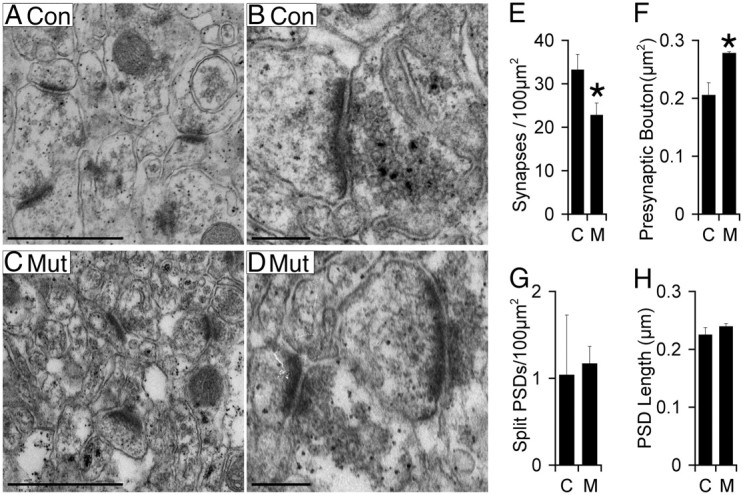
Reduced synapse density in CA1–SR in the afadin mutant. A–D, Images of synapses in control (A, C) and mutant (B, D). Scale bars: A, C, 1 μm; B, D, 0.25 μm. E–H, Significant reduction in synapse density (E) in mutant (M) versus control (C). In addition, presynaptic bouton area (F) is significantly increased in mutant (M) versus control (C). No significant differences between control and mutant were seen in the density of split PSDs (G) or average length of the PSD (H). Error bars depict SD. *p < 0.05, n = 3.
Loss of afadin results in reductions in presynaptic and postsynaptic protein colocalization
To further address the role of afadin in regulating synaptic structure, we initially quantified the densities of puncta from synapse-associated proteins, synaptophysin, bassoon, and glutamate receptors, by immunofluorescence and confocal imaging (data not shown). Surprisingly, we did not observe a puncta density reduction in the mutant, most likely because of the limited spatial resolution of confocal microscopy. To extend this analysis, we used subdiffraction limit imaging by STORM to determine synapse density, defining synapses as apposed clusters of presynaptic bassoon and postsynaptic AMPA glutamate receptors (GluR1/2) (Dani et al., 2010). Consistent with 3D-reconstructive EM, control mice had an average of 2.4 synapses/μm3 (Mishchenko et al., 2010). In contrast, mutants had a 35% reduction in synapse density (Fig. 9A–D). Intriguingly, although mutants had a 35% reduction in the density of bassoon puncta, there was no significant reduction in the density of AMPA glutamate receptor 1/2 puncta (Fig. 9E–H). Consistent with data presented above suggesting that the remaining synapses are normal, the average size and intensity of bassoon puncta were not altered in the mutant (Fig. 9I,J), nor was the average amount of AMPA glutamate receptor 1/2 at synapses changed (Fig. 9L).
Figure 9.

STORM demonstrates loss of synapses in mutants. A, B, Original high-resolution STORM image from a control (A) and mutant (B) showing puncta of bassoon (purple) and glutamate receptor 1/2 (green). Scale bar, 1 μm. C, D, STORM image from a control (C) and mutant (D) masked to show only the apposed bassoon and AMPA glutamate receptor 1/2 puncta. E–H, Average puncta density is significantly reduced in mutants (M) versus controls (C) for all bassoon puncta (E), bassoon puncta apposed to a glutamate receptor puncta (F), and glutamate receptor puncta apposed to a bassoon puncta (G). There was not a statistically significant reduction in total AMPA glutamate receptor (GluR1/2) puncta (H) (p = 0.19). n = 6 control, 7 mutant. Error bars are SEM. *p < 0.005. I–K, Unlike puncta density, controls and mutants had changes <5% in average synaptic bassoon size (I), average synaptic bassoon intensity (J), average number of glutamate receptor puncta per bassoon punctum (K), and average total glutamate receptor integrated density per bassoon punctum (L). n > 8500 puncta per genotype. Error bars are SEM.
Reduced synaptic transmission in afadin mutant hippocampus
To determine whether the absence of afadin from CA3 and CA1 neurons resulted in synaptic transmission deficits, we examined the fEPSP responses. CA1–SR basal synaptic transmission was assessed by stimulating Schaffer collateral afferents with increasing intensity and measuring the rise slope of the fEPSP in control (Fig. 10A) and mutant (Fig. 10B). The input–output linear fit of the fiber volley amplitude to the fEPSP rise slope demonstrated a nearly twofold decrease in synaptic strength in afadin mutants (Fig. 10C,D). Although consistent with the loss of synapses shown by EM and STORM, reduced Schaffer collateral innervation of CA1 could also explain this observation. To determine this, we plotted the evoked fiber volley amplitude as a function of stimulus intensity (Fig. 10E) and found no difference, indicating that mutants have normal numbers of Schaffer collateral axons that innervate CA1.
Figure 10.

Reduced excitatory synaptic transmission in the mutant hippocampus. Recordings of fEPSPs in CA1 from control (A) and mutant (B) mice. Traces of field potential responses to increasing evoked stimulus intensity by 5 μA every three sweeps; range, 20–50 μA. C, The linear fit of the fEPSP rise slope (millivolts per milliseconds) to fiber volley amplitude (millivolts) plot demonstrates reduced synaptic strength in mutant mice; the data in the histogram plot in D is the average across multiple animals (n = 5) and shows that synaptic strength in mutant animals (slope, 1.0 ± 0.1) is significantly reduced compared with control (slope, 1.8 ± 0.2). E, Fiber volley amplitudes evoked by a range of stimulus intensities were not different between control and mutant. Paired-pulse responses of fEPSPs (F, G) in control and mutant were measured at intervals of 10, 25, 50, 75, 100, 200, and 400 ms and were not statistically different. H, Examples of traces of fEPSP responses to 40 stimuli pulses delivered at 100 Hz. I, Summary histogram of fEPSP responses to 40 stimuli pulses delivered at 10 or 100 Hz. The ratios of the fEPSP rise slope of the 40th pulse to the first pulse were not significantly different between control and mutant at either frequency.
We further characterized synaptic transmission using a series of evoked stimulus protocols. To check for changes in presynaptic release probability by the afadin-deficient CA3 presynaptic neurons, we measured the paired-pulse ratio at varying stimulus intervals (Fig. 10F) (Zucker, 1989). We found no change in paired-pulse facilitation at any interval (Fig. 10G), suggesting that the probability of release is normal in the afadin mutant. To determine whether absence of afadin affects the size of the readily releasable pool (RRP), consequences of repetitive high-frequency stimulation (Fig. 10H), capable of exhausting the RRP without allowing for replenishment from the reserve pool, was assessed. The ratio of the size of the 40th fEPSP to the first fEPSP was unchanged between genotypes, indicating that absence of afadin does not affect the size of the RRP. Last, we examined the consequences of repetitive low-frequency stimulation to determine whether the absence of afadin results in changes in the reserve pool. Likewise, this parameter was unchanged (Fig. 10I). Thus, we found no changes in the responses of the mutant CA3 presynaptic neurons, indicating that absence of afadin does not perturb presynaptic function. In summary, the electrophysiology data show reduced excitatory synaptic transmission in afadin mutants. These results indicate that the density of synapses formed by CA3 axons on CA1 dendrites is reduced in the mutant, a conclusion completely consistent with the lower synaptic density determined by EM and STORM.
Discussion
By specifically deleting afadin in hippocampal excitatory neurons before synapse formation, we were able to examine the role of this scaffold protein in regulating neuronal differentiation in the presence of normal glia and other cells. Much of the differentiation of mutant hippocampal CA1 pyramidal neurons proceeded comparatively normally. A few neuronal cell bodies were mislocalized, but most were localized appropriately in the SP. Similarly, dendrite growth and branching appeared comparatively normal in the mutant neurons. Three significant phenotypes were observed in the mutant neurons. Spine formation was impaired because only 60% the normal density was observed in the mutant CA1–SR. A similar reduction in density of excitatory synapses in the SR was also observed. Finally, the mutants exhibited a dramatic loss of 70% of the N-cadherin puncta and similar reductions in the densities of β-catenin and αN-catenin puncta with no changes in total expression of either N-cadherin or these catenins, documenting the role of afadin in cadherin recruitment. It seems likely that many of the residual cadherin and catenin puncta are expressed in cells not targeted by Nex–cre. Notably, these synaptic deficits appear much more dramatic than that observed after targeted deletion of N-cadherin (Kadowaki et al., 2007). Those authors observed the continued presence of β-catenin at synapses, indicating that other classical cadherins remained at these synapses. Previous work has suggested that afadin promotes the recruitment and activation of all of the classical cadherins (Takai et al., 2008). Interestingly, we did not observe effects of afadin deletion on the density or properties of nectin-1 and nectin-3 puncta or on total expression levels of either nectin, consistent with the possibility that these proteins function upstream of afadin in controlling cadherin and catenin localization and function. In contrast, absence of afadin does result in mislocalization of nectins in the dentate gyrus and intestinal epithelium (Majima et al., 2009; Tanaka-Okamoto et al., 2011). The reason for this discrepancy is not clear but suggests that there are cell-type-specific mechanisms that control localization of the nectins, possibly involving other scaffold proteins, such as synaptic scaffolding molecule (S-SCAM) (Yamada et al., 2003). Overall, our data is consistent with the possibility that afadin promotes synapse formation/maintenance through recruitment of cadherins and catenins but does not significantly perturb presynaptic or postsynaptic function.
In synaptic structure analyses, both light-level immunofluorescence (data not shown) and EM analysis detected a small but significant increase in the size of presynaptic nerve terminals in mutant compared with control CA3 neurons. Analyses of presynaptic function—probability of release and sizes of the RRPs and reserve vesicle pools—indicates that the mutant CA3 presynaptic nerve terminals functioned normally. Additionally, absence of afadin did not affect the average amount of bassoon associated with each synapse as determined by STORM. Similarly, postsynaptic morphology as assessed by appearance and length of the PSD appeared normal as assessed by EM and AMPA receptor GluR1/2 content at these synapses was normal as assessed by STORM. Quantification of CA3 fiber volley amplitude indicated that normal numbers of mutant CA3 pyramidal cell axons invaded the CA1–SR. Postsynaptic responses were reduced by approximately the same percentage as the reductions in synapse density quantified by EM and STORM. Mutant synapses had similar number of glutamate receptors juxtaposed to bassoon. Perhaps the increase in bouton size is an indirect result of fewer synapses and/or spines. Together, these analyses indicate that the synapses formed in the absence of afadin function normally.
These findings contrast with previous mouse genetic models for cadherin complex function, but comparisons are complicated by the presence of several functional homologs for the cadherins and catenins. Animals lacking N-cadherin clearly form CNS synapses in vitro, but synaptic density has not been quantified in this mutant in vivo and other cadherins almost certainly remain at these synapses (Kadowaki et al., 2007). Similarly, absence of αN-catenin does not prevent synapse formation in vivo, although, similar to cadherin inhibition, this results in spine and synapse instability in culture (Park et al., 2002; Togashi et al., 2002; Abe et al., 2004). Absence of β-catenin results in a small increase in CA1 synapse density with a small but significant deficit in the synaptic vesicle reserve pool (Bamji et al., 2003). Possible compensation of the αN-catenin and β-catenin mutants by other α-catenin family members and the β-catenin homolog plakoglobin were not examined in these studies. Mice with a targeted deletion of p120–catenin had reduced numbers of dendritic spines and synapses in CA1–SR and a reduction in N-cadherin expression (Elia et al., 2006; Takeichi, 2007). In vitro analysis suggested that the loss of spines in this mutant is attributable to misregulation of Rac and Rho, whereas normal maturation of spines does require interactions of cadherins with p120–catenin (Elia et al., 2006; Ishiyama et al., 2010). In contrast, deletion of the p120–catenin homolog δ-catenin results in deficits in synaptic transmission and plasticity without detectable alterations of synapse density (Israely et al., 2004). Importantly, absence of this gene also results in premature loss of synaptic transmission, synapses, spines, and dendrites in the adult cortex (Matter et al., 2009). Considering these phenotypes, that of the p120–catenin mutant appears most similar to that of the afadin mutant, consistent with the role of p120–catenin in mediating an interaction between afadin and cadherins.
Through its PDZ domain, afadin also binds at least three other families of cell surface receptors: the nectins, EphB receptors, and neurexins (Beaudoin, 2006). Interestingly, mice with triple mutants of neuroligin or α-neurexin have profoundly impaired synaptic transmission with only small alterations in numbers of inhibitory and excitatory synapses (Missler et al., 2003; Varoqueaux et al., 2006). In contrast, the triple EphB1/B2/B3 null mice exhibit an ∼50% decrease in the density of spines in CA1 with a reduced number of spine and increased number of shaft synapses as well as striking reductions in spine maturation and postsynaptic compartment maturation (Henkemeyer et al., 2003). Thus, absence of afadin may impair EphB receptor function because we found a reduction in EphB2 puncta density, but these receptors clearly have additional functions because the triple EphB receptor mutant has phenotypes not observed in the afadin mutant. In contrast to mutants lacking EphB receptors, neuroligins, or α-neurexins, afadin appears to promote synapse density without having major effects on synapse structure or function.
This study focused on afadin because it lacks close structural homologs, thereby preventing compensation by other proteins. Nonetheless, a significant number of synapses form in its absence. As a possible explanation, a recent report raises the possibility that the PDZ-domain-containing protein S-SCAM acts as a functional homolog of afadin through mediating association of N-cadherin with Neuroligin-1 (Stan et al., 2010). Additionally, recent studies also suggest that N-cadherin function can be promoted through extracellular interactions with nectin-2 and protocadherin-19 (Biswas et al., 2010; Morita et al., 2010). It is not clear whether the resulting stimulation of N-cadherin function depends on afadin, p120–catenin, or other members of the cadherin complex. Thus, other cytoplasmic scaffold and surface proteins may promote cadherin function in the absence of afadin.
Additional interactions of afadin may also promote synapse formation. For example, its RA domain binds Rap1 (Takai et al., 2008). Previous studies in cortical cultures have provided evidence that afadin may function in a pathway through which NMDA receptors control spine maturation and AMPA receptor recruitment through Rap1 (Xie et al., 2005). Additionally, afadin may promote N-cadherin-dependent spine growth and Rac activation by recruiting the Rac–GEF, kalirin-7 (Xie et al., 2008). However, because loss of kalirin-7 causes no hippocampal spine or synaptic abnormalities, it is unlikely to underlie the defects seen in the afadin null hippocampus seen in our study (Cahill et al., 2009; Xie et al., 2011). Although afadin interacts with N-cadherin and p120–catenin, misregulation or mislocalization of Rho family GTPases may still contribute to the reduction in spine density observed in the mutant in vivo.
In conclusion, our data provide strong evidence that absence of afadin results in significant reductions in cadherin puncta, spine, and excitatory synapse density in the CA1–SR without affecting function of those synapses, which are formed in its absence. The data suggest that impaired clustering and activity of cadherins contributes to the phenotypes observed after neuron-specific deletion of afadin. The results do not exclude possible additional contributions to the afadin mutant phenotype from misregulation of neurexin, EphB, or nectin activity within the brain.
Footnotes
This work was supported by That Man May See (E.M.U.), National Institutes of Health Grant F32-MH079661 (G.M.J.B.), the University of California, San Francisco Program for Breakthrough Biomedical Research, Searle Scholarship, and Packard Fellowship (B.H.), and the Simons Foundation (E.M.U., L.F.R.). We thank the Reichardt laboratory members for discussions, J. A. Mercer, M. Wheelock, and K. A. Nave for reagents, and the Developmental Studies Hybridoma Bank for NCAT2 and E7 hybridomas.
The authors declare no competing financial interests.
References
- Abe K, Chisaka O, Van Roy F, Takeichi M. Stability of dendritic spines and synaptic contacts is controlled by alpha N-catenin. Nat Neurosci. 2004;7:357–363. doi: 10.1038/nn1212. [DOI] [PubMed] [Google Scholar]
- Bamji SX, Shimazu K, Kimes N, Huelsken J, Birchmeier W, Lu B, Reichardt LF. Role of beta-catenin in synaptic vesicle localization and presynaptic assembly. Neuron. 2003;40:719–731. doi: 10.1016/s0896-6273(03)00718-9. [DOI] [PMC free article] [PubMed] [Google Scholar]
- Beaudoin GM., 3rd Con-nectin axons and dendrites. J Cell Biol. 2006;174:7–9. doi: 10.1083/jcb.200606024. [DOI] [PMC free article] [PubMed] [Google Scholar]
- Biswas S, Emond MR, Jontes JD. Protocadherin-19 and N-cadherin interact to control cell movements during anterior neurulation. J Cell Biol. 2010;191:1029–1041. doi: 10.1083/jcb.201007008. [DOI] [PMC free article] [PubMed] [Google Scholar]
- Buchert M, Schneider S, Meskenaite V, Adams MT, Canaani E, Baechi T, Moelling K, Hovens CM. The junction-associated protein AF-6 interacts and clusters with specific Eph receptor tyrosine kinases at specialized sites of cell-cell contact in the brain. J Cell Biol. 1999;144:361–371. doi: 10.1083/jcb.144.2.361. [DOI] [PMC free article] [PubMed] [Google Scholar]
- Cahill ME, Xie Z, Day M, Photowala H, Barbolina MV, Miller CA, Weiss C, Radulovic J, Sweatt JD, Disterhoft JF, Surmeier DJ, Penzes P. Kalirin regulates cortical spine morphogenesis and disease-related behavioral phenotypes. Proc Natl Acad Sci U S A. 2009;106:13058–13063. doi: 10.1073/pnas.0904636106. [DOI] [PMC free article] [PubMed] [Google Scholar]
- Clandinin TR, Feldheim DA. Making a visual map: mechanisms and molecules. Curr Opin Neurobiol. 2009;19:174–180. doi: 10.1016/j.conb.2009.04.011. [DOI] [PMC free article] [PubMed] [Google Scholar]
- Dalva MB, McClelland AC, Kayser MS. Cell adhesion molecules: signalling functions at the synapse. Nat Rev Neurosci. 2007;8:206–220. doi: 10.1038/nrn2075. [DOI] [PMC free article] [PubMed] [Google Scholar]
- Dani A, Huang B, Bergan J, Dulac C, Zhuang X. Superresolution imaging of chemical synapses in the brain. Neuron. 2010;68:843–856. doi: 10.1016/j.neuron.2010.11.021. [DOI] [PMC free article] [PubMed] [Google Scholar]
- Elia LP, Yamamoto M, Zang K, Reichardt LF. p120 catenin regulates dendritic spine and synapse development through Rho-family GTPases and Cadherins. Neuron. 2006;51:43–56. doi: 10.1016/j.neuron.2006.05.018. [DOI] [PMC free article] [PubMed] [Google Scholar]
- Feng G, Mellor RH, Bernstein M, Keller-Peck C, Nguyen QT, Wallace M, Nerbonne JM, Lichtman JW, Sanes JR. Imaging neuronal subsets in transgenic mice expressing multiple spectral variants of GFP. Neuron. 2000;28:41–51. doi: 10.1016/s0896-6273(00)00084-2. [DOI] [PubMed] [Google Scholar]
- Goebbels S, Bormuth I, Bode U, Hermanson O, Schwab MH, Nave KA. Genetic targeting of principal neurons in neocortex and hippocampus of NEX-Cre mice. Genesis. 2006;44:611–621. doi: 10.1002/dvg.20256. [DOI] [PubMed] [Google Scholar]
- Henkemeyer M, Itkis OS, Ngo M, Hickmott PW, Ethell IM. Multiple EphB receptor tyrosine kinases shape dendritic spines in the hippocampus. J Cell Biol. 2003;163:1313–1326. doi: 10.1083/jcb.200306033. [DOI] [PMC free article] [PubMed] [Google Scholar]
- Hock B, Böhme B, Karn T, Yamamoto T, Kaibuchi K, Holtrich U, Holland S, Pawson T, Rübsamen-Waigmann H, Strebhardt K. PDZ-domain-mediated interaction of the Eph-related receptor tyrosine kinase EphB3 and the ras-binding protein AF6 depends on the kinase activity of the receptor. Proc Natl Acad Sci U S A. 1998;95:9779–9784. doi: 10.1073/pnas.95.17.9779. [DOI] [PMC free article] [PubMed] [Google Scholar]
- Ikeda W, Nakanishi H, Miyoshi J, Mandai K, Ishizaki H, Tanaka M, Togawa A, Takahashi K, Nishioka H, Yoshida H, Mizoguchi A, Nishikawa S, Takai Y. Afadin: a key molecule essential for structural organization of cell-cell junctions of polarized epithelia during embryogenesis. J Cell Biol. 1999;146:1117–1132. doi: 10.1083/jcb.146.5.1117. [DOI] [PMC free article] [PubMed] [Google Scholar]
- Ishiyama N, Lee SH, Liu S, Li GY, Smith MJ, Reichardt LF, Ikura M. Dynamic and static interactions between p120 catenin and E-cadherin regulate the stability of cell-cell adhesion. Cell. 2010;141:117–128. doi: 10.1016/j.cell.2010.01.017. [DOI] [PubMed] [Google Scholar]
- Israely I, Costa RM, Xie CW, Silva AJ, Kosik KS, Liu X. Deletion of the neuron-specific protein delta-catenin leads to severe cognitive and synaptic dysfunction. Curr Biol. 2004;14:1657–1663. doi: 10.1016/j.cub.2004.08.065. [DOI] [PubMed] [Google Scholar]
- Jin Y, Garner CC. Molecular mechanisms of presynaptic differentiation. Annu Rev Cell Dev Biol. 2008;24:237–262. doi: 10.1146/annurev.cellbio.23.090506.123417. [DOI] [PubMed] [Google Scholar]
- Kadowaki M, Nakamura S, Machon O, Krauss S, Radice GL, Takeichi M. N-cadherin mediates cortical organization in the mouse brain. Dev Biol. 2007;304:22–33. doi: 10.1016/j.ydbio.2006.12.014. [DOI] [PubMed] [Google Scholar]
- Kayser MS, McClelland AC, Hughes EG, Dalva MB. Intracellular and trans-synaptic regulation of glutamatergic synaptogenesis by EphB receptors. J Neurosci. 2006;26:12152–12164. doi: 10.1523/JNEUROSCI.3072-06.2006. [DOI] [PMC free article] [PubMed] [Google Scholar]
- Majima T, Ogita H, Yamada T, Amano H, Togashi H, Sakisaka T, Tanaka-Okamoto M, Ishizaki H, Miyoshi J, Takai Y. Involvement of afadin in the formation and remodeling of synapses in the hippocampus. Biochem Biophys Res Commun. 2009;385:539–544. doi: 10.1016/j.bbrc.2009.05.097. [DOI] [PubMed] [Google Scholar]
- Matter C, Pribadi M, Liu X, Trachtenberg JT. Delta-catenin is required for the maintenance of neural structure and function in mature cortex in vivo. Neuron. 2009;64:320–327. doi: 10.1016/j.neuron.2009.09.026. [DOI] [PMC free article] [PubMed] [Google Scholar]
- Mendell JT, Sharifi NA, Meyers JL, Martinez-Murillo F, Dietz HC. Nonsense surveillance regulates expression of diverse classes of mammalian transcripts and mutes genomic noise. Nat Genet. 2004;36:1073–1078. doi: 10.1038/ng1429. [DOI] [PubMed] [Google Scholar]
- Mishchenko Y, Hu T, Spacek J, Mendenhall J, Harris KM, Chklovskii DB. Ultrastructural analysis of hippocampal neuropil from the connectomics perspective. Neuron. 2010;67:1009–1020. doi: 10.1016/j.neuron.2010.08.014. [DOI] [PMC free article] [PubMed] [Google Scholar]
- Missler M, Zhang W, Rohlmann A, Kattenstroth G, Hammer RE, Gottmann K, Südhof TC. Alpha-neurexins couple Ca2+ channels to synaptic vesicle exocytosis. Nature. 2003;423:939–948. doi: 10.1038/nature01755. [DOI] [PubMed] [Google Scholar]
- Morita H, Nandadasa S, Yamamoto TS, Terasaka-Iioka C, Wylie C, Ueno N. Nectin-2 and N-cadherin interact through extracellular domains and induce apical accumulation of F-actin in apical constriction of Xenopus neural tube morphogenesis. Development. 2010;137:1315–1325. doi: 10.1242/dev.043190. [DOI] [PMC free article] [PubMed] [Google Scholar]
- Mulder J, Aguado T, Keimpema E, Barabás K, Ballester Rosado CJ, Nguyen L, Monory K, Marsicano G, Di Marzo V, Hurd YL, Guillemot F, Mackie K, Lutz B, Guzmán M, Lu HC, Galve-Roperh I, Harkany T. Endocannabinoid signaling controls pyramidal cell specification and long-range axon patterning. Proc Natl Acad Sci U S A. 2008;105:8760–8765. doi: 10.1073/pnas.0803545105. [DOI] [PMC free article] [PubMed] [Google Scholar]
- Park C, Falls W, Finger JH, Longo-Guess CM, Ackerman SL. Deletion in Catna2, encoding alpha N-catenin, causes cerebellar and hippocampal lamination defects and impaired startle modulation. Nat Genet. 2002;31:279–284. doi: 10.1038/ng908. [DOI] [PubMed] [Google Scholar]
- Rodríguez CI, Buchholz F, Galloway J, Sequerra R, Kasper J, Ayala R, Stewart AF, Dymecki SM. High-efficiency deleter mice show that FLPe is an alternative to Cre-loxP. Nat Genet. 2000;25:139–140. doi: 10.1038/75973. [DOI] [PubMed] [Google Scholar]
- Schlomann U, Schwamborn JC, Müller M, Fässler R, Püschel AW. The stimulation of dendrite growth by Sema3A requires integrin engagement and focal adhesion kinase. J Cell Sci. 2009;122:2034–2042. doi: 10.1242/jcs.038232. [DOI] [PubMed] [Google Scholar]
- Stan A, Pielarski KN, Brigadski T, Wittenmayer N, Fedorchenko O, Gohla A, Lessmann V, Dresbach T, Gottmann K. Essential cooperation of N-cadherin and neuroligin-1 in the transsynaptic control of vesicle accumulation. Proc Natl Acad Sci U S A. 2010;107:11116–11121. doi: 10.1073/pnas.0914233107. [DOI] [PMC free article] [PubMed] [Google Scholar]
- Takahashi K, Nakanishi H, Miyahara M, Mandai K, Satoh K, Satoh A, Nishioka H, Aoki J, Nomoto A, Mizoguchi A, Takai Y. Nectin/PRR: an immunoglobulin-like cell adhesion molecule recruited to cadherin-based adherens junctions through interaction with Afadin, a PDZ domain-containing protein. J Cell Biol. 1999;145:539–549. doi: 10.1083/jcb.145.3.539. [DOI] [PMC free article] [PubMed] [Google Scholar]
- Takai Y, Ikeda W, Ogita H, Rikitake Y. The immunoglobulin-like cell adhesion molecule nectin and its associated protein afadin. Annu Rev Cell Dev Biol. 2008;24:309–342. doi: 10.1146/annurev.cellbio.24.110707.175339. [DOI] [PubMed] [Google Scholar]
- Takeichi M. The cadherin superfamily in neuronal connections and interactions. Nat Rev Neurosci. 2007;8:11–20. doi: 10.1038/nrn2043. [DOI] [PubMed] [Google Scholar]
- Takeichi M. Self-organization of animal tissues: cadherin-mediated processes. Dev Cell. 2011;21:24–26. doi: 10.1016/j.devcel.2011.06.002. [DOI] [PubMed] [Google Scholar]
- Tanaka-Okamoto M, Hori K, Ishizaki H, Itoh Y, Onishi S, Yonemura S, Takai Y, Miyoshi J. Involvement of afadin in barrier function and homeostasis of mouse intestinal epithelia. J Cell Sci. 2011;124:2231–2240. doi: 10.1242/jcs.081000. [DOI] [PMC free article] [PubMed] [Google Scholar]
- Togashi H, Abe K, Mizoguchi A, Takaoka K, Chisaka O, Takeichi M. Cadherin regulates dendritic spine morphogenesis. Neuron. 2002;35:77–89. doi: 10.1016/s0896-6273(02)00748-1. [DOI] [PubMed] [Google Scholar]
- Varoqueaux F, Aramuni G, Rawson RL, Mohrmann R, Missler M, Gottmann K, Zhang W, Südhof TC, Brose N. Neuroligins determine synapse maturation and function. Neuron. 2006;51:741–754. doi: 10.1016/j.neuron.2006.09.003. [DOI] [PubMed] [Google Scholar]
- Waites CL, Craig AM, Garner CC. Mechanisms of vertebrate synaptogenesis. Annu Rev Neurosci. 2005;28:251–274. doi: 10.1146/annurev.neuro.27.070203.144336. [DOI] [PubMed] [Google Scholar]
- Wu SX, Goebbels S, Nakamura K, Nakamura K, Kometani K, Minato N, Kaneko T, Nave KA, Tamamaki N. Pyramidal neurons of upper cortical layers generated by NEX-positive progenitor cells in the subventricular zone. Proc Natl Acad Sci U S A. 2005;102:17172–17177. doi: 10.1073/pnas.0508560102. [DOI] [PMC free article] [PubMed] [Google Scholar]
- Xie Z, Huganir RL, Penzes P. Activity-dependent dendritic spine structural plasticity is regulated by small GTPase Rap1 and its target AF-6. Neuron. 2005;48:605–618. doi: 10.1016/j.neuron.2005.09.027. [DOI] [PubMed] [Google Scholar]
- Xie Z, Photowala H, Cahill ME, Srivastava DP, Woolfrey KM, Shum CY, Huganir RL, Penzes P. Coordination of synaptic adhesion with dendritic spine remodeling by AF-6 and kalirin-7. J Neurosci. 2008;28:6079–6091. doi: 10.1523/JNEUROSCI.1170-08.2008. [DOI] [PMC free article] [PubMed] [Google Scholar]
- Xie Z, Cahill ME, Radulovic J, Wang J, Campbell SL, Miller CA, Sweatt JD, Penzes P. Hippocampal phenotypes in kalirin-deficient mice. Mol Cell Neurosci. 2011;46:45–54. doi: 10.1016/j.mcn.2010.08.005. [DOI] [PMC free article] [PubMed] [Google Scholar]
- Yamada A, Irie K, Deguchi-Tawarada M, Ohtsuka T, Takai Y. Nectin-dependent localization of synaptic scaffolding molecule (S-SCAM) at the puncta adherentia junctions formed between the mossy fibre terminals and the dendrites of pyramidal cells in the CA3 area of the mouse hippocampus. Genes Cells. 2003;8:985–994. doi: 10.1046/j.1356-9597.2003.00690.x. [DOI] [PubMed] [Google Scholar]
- Zhadanov AB, Provance DW, Jr, Speer CA, Coffin JD, Goss D, Blixt JA, Reichert CM, Mercer JA. Absence of the tight junctional protein AF-6 disrupts epithelial cell-cell junctions and cell polarity during mouse development. Curr Biol. 1999;9:880–888. doi: 10.1016/s0960-9822(99)80392-3. [DOI] [PubMed] [Google Scholar]
- Zucker RS. Short-term synaptic plasticity. Annu Rev Neurosci. 1989;12:13–31. doi: 10.1146/annurev.ne.12.030189.000305. [DOI] [PubMed] [Google Scholar]