

Abstract
A physical theory explaining the anisotropic dispersion of water and solutes in biological tissues is introduced based on the phenomena of Taylor dispersion, in which highly diffusive solutes cycle between flowing and stagnant regions in the tissue, enhancing dispersion in the direction of microvascular flow. An effective diffusion equation is derived, for which the coefficient of dispersion in the axial direction (direction of capillary orientation) depends on the molecular diffusion coefficient, tissue perfusion, and vessel density. This analysis provides a homogenization that represents three-dimensional transport in capillary beds as an effectively one-dimensional phenomenon. The derived dispersion equation may be used to simulate the transport of solutes in tissues, such as in pharmacokinetic modeling. In addition, the analysis provides a physically based hypothesis for explaining dispersion anisotropy observed in diffusion-weighted imaging (DWI) and diffusion-tensor magnetic resonance imaging (DTMRI) and suggests a means of obtaining quantitative functional information on capillary vessel density from measurements of dispersion coefficients. It is shown that a failure to account for flow-mediated dispersion in vascular tissues may lead to misinterpretations of imaging data and significant overestimates of directional bias in molecular diffusivity in biological tissues. Measurement of the ratio of axial to transverse diffusivity may be combined with an independent measurement of perfusion to provide an estimate of capillary vessel density in the tissue.
Background and Theory
Water diffuses anisotropically in several tissues. Apparent inhomogeneity and anisotropy in the diffusivity of water in biological tissues are exploited in diffusion tensor magnetic resonance imaging (DTMRI) and diffusion-weighted imaging (DWI) to map the architecture and function of brain (Minematsu, Li et al. 1992; Le Bihan and van Zijl 2002; Huisman 2003; Partridge, Mukherjee et al. 2004) and other tissues in vivo. Clinical applications of this technology arise in the functional imaging of cerebral ischemia, such as in brain injuries including stroke (Sotak 2002). It is observed clinically and in animal models that the apparent diffusivity of water is markedly reduced in affected regions with the onset of ischemia, and recovers to normal or near-normal values when flow is restored to the injured region (Sotak 2002). When the full diffusion tensor is measured, it is observed that the reduction in overall diffusivity that is coincident with reduction in flow is due to an anisotropic reduction of the diffusivity in the direction that coincides with the greatest diffusivity, or largest eigenvalue of the diffusion matrix. Although the physical mechanism of changes in diffusivity and the anisotropy of dispersion of water is not well characterized, this imaging technology is widely used in clinical and research settings.
The conventional and accepted explanation for changes in apparent diffusivity with flow is that in normal white matter, for example, diffusion is severely restricted in the direction perpendicular to the fiber orientation by microscopic structures such as cell membranes and myelin fibers (Beaulieu 2002; Sotak 2002; Hrabe, Hrabetova et al. 2004). It is assumed that the microscopic geometry is altered during ischemia which causes local edema (Beaulieu 2002; Sotak 2002). However, the physical link between edema and restricted diffusivity of water is tenuous.
Here we present an alternative biophysical theory that, at least in part, explains the observed phenomenon as a manifestation of Taylor dispersion (Taylor 1953), and use the developed theory to suggest how additional functional information may be obtained from MRI-based measures of apparent diffusion coefficient and dispersion anisotropy in vivo. We propose that as water or solute in the cellular and extracellular fluid exchanges with advecting water or solute in the microvascular space, the advection in capillaries contributes to the overall dispersion in the tissue. This theory is developed by approximating the observed diffusivity as a manifestation of coupled molecular diffusion and advection in the microvasculature.
To derive a governing equation for dispersion of labeled water or solute in a biological tissue, consider an idealized geometry for the tissue in which the majority of capillary exchange vessels are oriented in the axial direction, as illustrated in Fig. 1A. Capillaries, shown in cross section in the figure, are distributed with a fixed density ρ—the number of capillaries per unit cross-sectional area.
Figure 1.

A. A cross section through tissue in the transverse plane, perpendicular to the direction of capillary blood flow, is illustrated. The velocity in a capillary is indicated by vz, which is treated as a random variable. Advective transport is directed in the axial direction z, the direction in which the capillaries are aligned. B. Illustration of Krogh cylinder geometry. Outer tissue cylinder had radius Ro; capillary region has radius Ri.
Next, each capillary along with a portion of its surrounding tissue is modeled using an idealized radial geometry, or Krogh cylinder (Krogh 1919), as illustrated in Fig. 1B. The idealized Krogh geometry allows us to derive an expression approximating the concentration of a labeled solute in the vicinity of a given capillary. Transport of a non-reacting solute in a Krogh cylinder is governed by the familiar advection-diffusion equation:
| (1) |
where c is the solute concentration, v(r) is the fluid velocity in the axial direction, and D is the molecular diffusion coefficient. Here we assume that the fluid velocity is specified
| (2) |
where Ri and Ro are the radii of the vessel and the stagnant tissue, respectively, and vz is the constant velocity in the capillary. Under this standard Krogh-cylinder approximation, the tissue space Ri < r < Ro is treated as a cylindrical annulus. However, our analysis below does not make the familiar assumptions that the flows in neighboring capillaries are equal and that there is no mass flux out of the outer boundary at r = Ro.
The appropriate value for the outer radius of the Krogh cylinder is determined by the capillary density using the relation . Equation (2) assumes plug flow in capillaries, a reasonable approximation due to the tight packing of red blood cells which inhibits the development of significant velocity gradients (Pries, Secomb et al. 1996). The familiar no-slip condition may be complicated by the presence of gel-like glycocalyx on the inner surface of the capillary wall (Damiano 1998; Secomb, Hsu et al. 1998; Feng and Weinbaum 2000).
We assume that the vessel velocities are randomly distributed with probability distribution P (vz), so that we can define the cross-sectional average concentration:
| (3) |
where we have defined the brackets operator ⟨•⟩ to indicate cross-sectional averaging. The mean capillary blood velocity v̄ is related to the Krogh cylinder radii via the relationship , where F is the flow per unit volume in the tissue (typically measured in volume per unit time per unit volume of tissue perfused) and l is the length of the capillaries. From the definition of c̄ (z,t) we can express
| (4) |
where ⟨c′⟩ = 0. Substituting Equation (4) into Equation (1), we have
| (5) |
Taking the cross-sectional average of Equation (5) yields
| (6) |
Noting that the second term on the right-hand side of this equation is zero if mass is conserved in the system and subtracting (6) from (5), we obtain
| (7) |
Assuming that the solute concentration rapidly equilibrates (i.e., ∂c′/ ∂t ≈ 0 at sufficiently large time) in the radial direction and that c̄ ≫ c′, Equation (7) is simplified:
| (8) |
If blood flows in all the capillaries in the same direction then the mean blood velocity in the tissue is ⟨v⟩ = Fl, where F is the flow per unit volume in the tissue and l is the length of the capillaries. (That is, ⟨v⟩ is the velocity averaged over the tissue cross section and v̄ is the average velocity in a capillary.) Furthermore, it is assumed (Taylor 1953) that radial gradients in c′ are much larger than axial gradients, yielding an equation for c′:
| (9) |
The boundary conditions for solving Equation (9) are
The assumption that concentration profiles rapidly equilibrate in the transverse plane requires that radial diffusion time is significantly smaller than the time required for advection of the concentration wave. Characteristic time for diffusion, given by , is less than one second for all cases explored below, while the mean transit time, given by τT = F−1, is on the order of one minute.
Given the velocity profile of Equation (2), and the two boundary conditions that the concentration and its r-component gradient are continuous at r = Ri, Equation (9) has solution:
| (10) |
where co is an arbitrary function independent of r. Integrating Equation (10) results in co = 0 to satisfy ⟨c′⟩ = 0. This solution assumes no permeability barrier across the capillary wall. The case where a permeability barrier exisits is described below.
Note that the derived concentration profile does not assume that there is no diffusive flux in the radial direction at r = Ro. Only for the case where vzRi2 / Ro2 = Fl, for which the velocity in a capillary is equal to the ensemble average capillary velocity, is there no mass flux across the outer radial boundary of the Krogh cylinder.
If we assume that the vessel velocity probability distribution is , then Equation (6), the continuity equation for c̄ (z, t), is:
| (11) |
Evaluating the integral in Equation (11) yields:
| (12) |
where the Taylor dispersion coefficient D̃ is computed:
| (13) |
or
| (14) |
Equation (12) is the equation governing dispersion of solute in the axial direction. A hallmark of the Taylor dispersion mechanism is that solute is dispersed with an effective dispersion coefficient that is inversely proportional to the molecular diffusion coefficient, as in Equations (13) and (14). Here we have used the identity v̄ = Fl Ro2 / Ri2 and introduced the following parameters: ρ, the density of capillaries in the transverse cross section, and θ = σv /v̄. The capillary vessel density is related to the geometric parameter Ro via the relationship and the parameter; θ is a measure of the relative variability in capillary flows. The range of parameters values employed in this study is listed in Table 1. The capillary radius is set at 2.0 μm and the length is set a 1000 μm, a reasonable value for the functional capillary length (Bassingthwaighte and Goresky 1984). All other parameters are varied over a physiologically reasonable range in the analysis presented below.
Table 1.
Parameter values and ranges employed
| Parameter | Value or range of values |
|---|---|
| Assigned parameters: | |
| Tissue flow, F | 0.25-2.0 ml min-1 ml-1 |
| Capillary length, l | 1000 μm |
| Capillary radius, Ri | 2.0 μm |
| Capillary density, ρ | 0-800 mm-2 |
| Standard deviation of capillary velocity, σv | 0-0.5Fl |
| Molecular diffusion coefficient, D | 600-1000 μm2 sec-1 |
| Permeability, p | ≥250 μm sec-1 |
| Computed parameters: | |
| Krogh radius, Ro | ≥20 μm |
| Tissue flow relative dispersion, θ | 0-0.5 |
The total effective dispersion coefficient (molecular diffusion coefficient plus Taylor dispersion coefficient) is expressed:
| (15) |
Using the above relations, Dz may be computed as an explicit function of D, Fl, ρ, Ri, and θ. If the microvascular flows are uniform, then θ = 0 and the Taylor dispersion coefficient reduces to
| (16) |
The above equations demonstrate that the apparent dispersion coefficient and the diffusion anisotropy are flow-mediated effects. When there is no flow to the tissue, the axial dispersion coefficient is equal to the molecular diffusion coefficient, and Dz / Dx = 1—i.e., there is no anisotropy. The quadratic dependence of Dz on perfusion is consistent with observations that the apparent diffusion constant and the degree of anisotropy are reduced in ischemia (Moseley, Kucharczyk et al. 1990; Beaulieu 2002) and the strong correlation between degree of anisotropy and stimulus in the brain (Toosy, Ciccarelli et al. 2004).
When there exists a finite permeability across the vessel wall, the Taylor dispersion coefficient is expressed:
| (17) |
where p is the permeability of the vessel wall. As the permeability and/or the molecular diffusivity of a solute decreases, the Taylor dispersion effect is increased. This is a (perhaps nonintuitive) hallmark of Taylor dispersion (Taylor 1953). A derivation of Equation (17) is provided in the appendix.
Results and Validation
Plotted in Fig. 2 are predicted values of the ratio of axial to transverse dispersion coefficients, as a function of capillary density, for different values of tissue perfusion. (See Table 1 and figure legend for physiological parameter values.) In the top left panel (Fig. 2A) the ratio of axial to transverse diffusivity—computed according to Equations (14) and (15) with the transverse diffusion coefficient Dx equal to the molecular diffusion coefficient D—is plotted for the case where the in vivo molecular diffusion coefficient is relatively high and close to the value for water diffusion in dilute solution. For these calculations D was set to 1000 μm2 sec-1, a value which is approximately twice the values measured for the direction perpendicular to the direction of greatest dispersion in the brain (Beaulieu 2002). In this case, the axial dispersion is significantly enhanced for capillary densities less than 400 mm-2 and/or flows of 1 ml min-1 per ml of tissue and greater. With this value of molecular diffusion coefficient in cerebral tissue, with capillary densities in the range of 400-600 mm-2, we would expect to see measurable dispersion anisotropy only where flow significantly exceeded 1 ml min-1 per ml of tissue.
Figure 2.
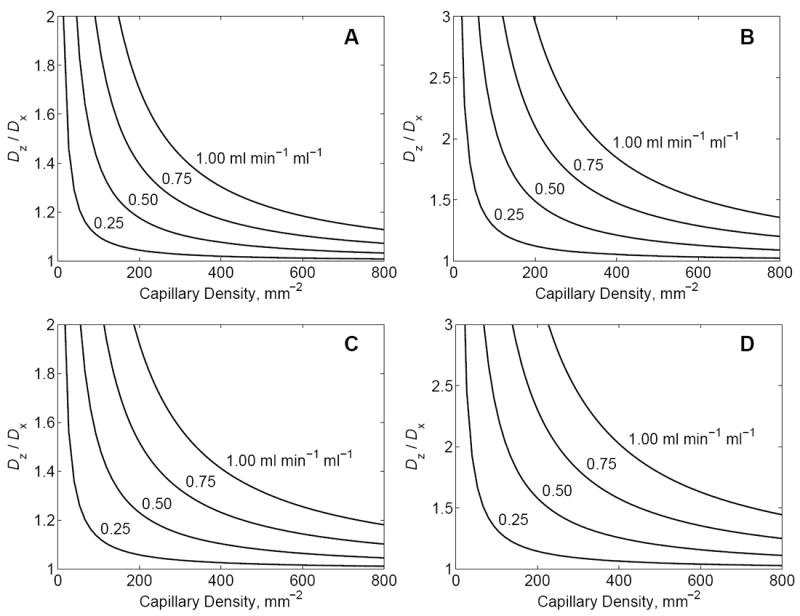
The ratio Dz / Dx, predicted by Equations (14) and (15) and Equations (17) and (15), is plotted as a function of capillary density, for several values of tissue perfusion. The four curves in each panel correspond to flows of F = 0.25, 0.50, 0.75, and 1.0 ml min-1 per ml of tissue, as indicated in the figure. In A and B the dispersion coefficient is computed by Equation (14), with no permeability barrier across the capillary wall. In C and D the dispersion coefficient is computed by Equation (17), assuming p = 250 μm sec-1. The capillary radius is set to Ri = 2.0 μm; capillary length is set to l = 1000 μm; the velocity standard deviation is assumed to be one half of the mean velocity:σv = 0.5v̄. A. For these curves the tissue molecular diffusion coefficient D = Dx is assumed to have a value of 1000 μm2 sec-1, approximately equal to that of water in vitro. B. For these curves the transverse molecular diffusion coefficient D = Dx is assumed to have a value of 600 μm2 sec-1, corresponding to a significant reduction in molecular diffusion coefficient in vivo compared to in vitro. Curves in C and D assume the same values of molecular diffusion coefficient as in A and B, respectively.
Since the dispersion coefficient varies with the inverse of the molecular diffusion coefficient, the axial dispersion and the level of anisotropy will be enhanced if the molecular diffusivity is retarded in vivo. The curves plotted in Fig. 2B were obtained by setting D to 600 μm2 sec-1, a value close to the transverse diffusivity reported for white matter in premature newborns (Maas, Mukherjee et al. 2004; Partridge, Mukherjee et al. 2004) and similar to the apparent diffusion coefficients measured for the perpendicular direction in a variety of nervous tissues (Beaulieu 2002). In this case, the degree of anisotropy predicted for reasonable values of flow and vessel density for cerebral tissue agree with measurements reported for in vivo dispersion anisotropy in the brain (Beaulieu 2002; Partridge, Mukherjee et al. 2004), in which the ratio Dz / Dx is reported to range from approximately 2 to 4.
Figs. 2C and 2D plot Dz / Dx computed assuming a finite permeability using Equation (17) for the Taylor dispersion coefficient. Here the permeability is set to p = 250 mm sec-1, a reasonable for the apparent permeability of oxygen (Beard, Schenkman et al. 2003). All other parameters in 2C and 2D are set the same as in 2A and 2B, respectively. Even at this relatively high permeability value, the apparent axial dispersion is enhanced compared to the case with no permeability barrier (p = ∞).
To demonstrate the validity of Equation (16), we performed a detailed three-dimensional transport simulation based on the geometry illustrated in Fig. 3A. The system simulated consists of 12 parallel capillaries, arranged hexagonally in the plane perpendicular to the capillary direction, with a capillary density of 800 mm-2. To simulate transport in this system, the advection-diffusion equation is solved in the region illustrated with dimensions 132 × 114 × 1000 μm. Velocity is assumed to be zero outside of capillaries. Each capillary has diameter of 6 μm, with uniform flow in the axial (z) direction. Capillary velocities are chosen from a normal distribution with θ = 0.50, with total perfusion in the region of F = 2 ml min-1 ml-1. Given D = 600 μm2 sec-1, the computed axial dispersion coefficient is Dz = 1454 μm2 sec-1. Solute concentration and the r-component of concentration gradients are assumed to be continuous across the capillary wall.
Figure 3.
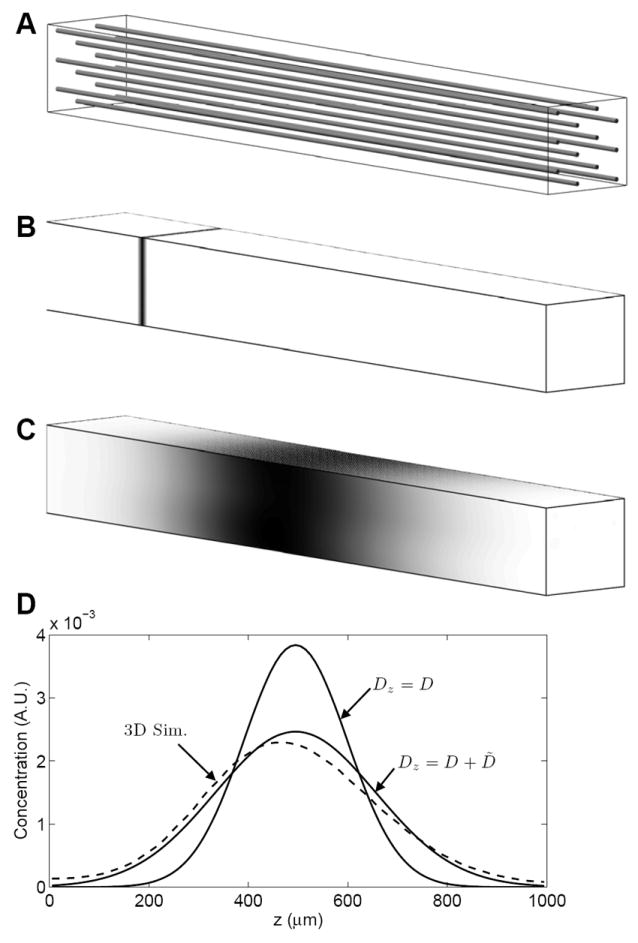
Comparison of three-dimensional transport simulation to predictions of the one-dimensional Taylor-dispersion model. A. The simulation domain is 132 × 114 × 1000 μm region with 12 parallel capillaries oriented in the z direction. Capillary flow is in the positive (left-to-right) direction, with total flow to the region of F = 2 ml min-1 ml-1. B. At time t = 0, labeled solute is introduced over the x-y plane at z = 200 μm. C. The predicted concentration field on domain surface at t = 9 sec. is indicated. Solute concentrations in B and C are indicated by gray scale using an arbitrary scale. D. The average solute concentration in the x-y plane as a function of z position is plotted in arbitrary units as a dashed line. The one-dimensional concentration fields predicted using the molecular diffusion coefficient Dz = D and the dispersion coefficient Dz = D + D̃ are compared to the three-dimension simulation result.
Simulation results are illustrated in panels B, C, and D of Fig. 3 for a single realization of random capillary velocities. All simulations were performed using a finite volume algorithm (Beard 2001) with periodic boundary conditions on the surfaces parallel to the capillary direction. In the z-plane perpendicular to the capillaries (at z = 0 and z = 1000 μm) a zero-flux condition is imposed on the extracapillary domain and zero concentration is imposed on the capillary inflow at z = 0. Tracer labeled solute is initially introduced into the tissue at the z = 200 μm location, as illustrated in Fig. 3B. After 9 seconds of simulation time, the solute bolus advects and is dispersed in the z direction, as illustrated in Fig. 3C. When different realizations of the random capillary velocities are used, the results are not significantly different from those shown here.
To compare the simulation results to those predicted by Equations (12) and (16), we use the theoretical prediction
| (18) |
which corresponds to the solution to the one-dimensional advection-diffusion equation in an infinite domain where boundary effects are ignored. Here zo is the initial bolus location and z̄ represents the mean advection distance.
Predictions of Equation (18) are compared to the simulation results in Fig. 3D, as solid lines for the case where the dispersion coefficient is set to the molecular diffusion coefficient and the case where the dispersion coefficient of Equation (18) is used. The simulation result is indicated by the dashed line. It is apparent that the case Dz = D + D̃ best matches the three-dimensional simulation results and that the Taylor dispersion model accurately captures the important transport phenomena for this system.
Discussion
This report has shown how Taylor dispersion represents a reasonable and plausible explanation for dispersion anisotropy observed, for example, in diffusion weighted MRI and diffusion tensor MRI. In addition to capturing the underlying physics, this theory suggests that additional quantitative functional information may be obtained from measurements of dispersion anisotropy. Given independent measures of Dz, D, and F, it is possible to invert Equations (14) and (15) to provide a measurement of vessel density ρ. However, these equations are derived from a simplified geometrical model and prove inadequate for application to vessel geometries found, for example, in brain. The degree of accuracy to which these or related equations can be used to determine ρ from MRI-based measurements of anisotropic dispersion remains to be experimentally investigated.
Since the validity of the major assumption in deriving the above expression for anisotropic dispersion of water in tissue—that blood flows through the capillaries primarily in one direction—varies between different tissue types, the utility of this approach to functionally image vessel density is expected to vary as well. This main assumption is certainly reasonable in muscle tissues, in which the myofibers and capillaries tend to be oriented parallel to one another, and perhaps in certain regions of the brain. Thus the theory presented above may be suited to using diffusion tensor MRI to measure capillary vessel density in vivo in these and other tissues with similar microvascular morphometry. For other vessel architectures the geometrical assumptions and the resulting calculation of the dispersion coefficients will require modification.
Treatment of molecular diffusivity as isotropic in tissue represents an assumption that is not a fundamental requirement of the above analysis and may readily be revised. In fact biological tissues are anisotropic. The degree of apparent diffusion anisotropy is not entirely diminished in fixed and in vitro preparations of nervous tissue (Beaulieu 2002); diffusion tensor MRI has been shown to detect fiber direction in fixed cardiac tissue (Scollan, Holmes et al. 1998; Scollan, Holmes et al. 2000; Chen, Song et al. 2003). Thus, molecular diffusion is directionally biased even in the absence of Taylor dispersion. Still, failure to account for flow-mediated dispersion in vascular tissues can lead to significant overestimates of a directional bias in molecular diffusivity in biological tissues. Anisotropy in molecular diffusivity may be unambiguously measured in only non-perfused tissue.
The homogenization developed here of a three-dimensional transport process to a description as an essentially one-dimensional phenomenon has the potential for simplification of blood-tissue exchange modeling, particularly where three-dimensional models are used to simulate transport of highly-diffusive solutes such as oxygen and water (Secomb and Hsu 1994; Beard, Schenkman et al. 2003). It may be possible to reduce the complexity of such models by accounting for Taylor dispersion in the direction of capillary flow. The dispersion coefficients derived here may be applied to simulation of blood-tissue transport of solutes in pharmacokinetics and indicator-dilution experiments (Bassingthwaighte and Goresky 1984).
Acknowledgments
This work was supported by NIH grant HL072011. We are grateful to the anonymous reviewer who helped us to make our derivation of the dispersion coefficient more rigorous than it was in an earlier version of the manuscript.
Appendix
When a permeability barrier exists across the vessel wall, there is a finite concentration difference across the vessel wall. Assuming that the flux across the wall is linearly proportional to the concentration difference, Equation (9) can be solved with the finite-permeability boundary conditions at:
| (A1) |
and
| (A2) |
where p is the vessel permeability. Given these conditions and the velocity given in Equation (2), the concentration profile of Equation (10) is replaced by
| (A3) |
Note that Equation (A3) reduces to Equation (10) in the limit p → ∞.
Substitution of this result into Equations (11) and (12) yields the Taylor dispersion coefficient
| (A4) |
or
| (A5) |
Equations (A4) and (A5) reduced to Equations (13) and (14) in the limit p → ∞.
References
- Bassingthwaighte JB, Goresky CA. Modeling in the analysis of solute and water exchange in the microvasculature. In: Renkin EM, Michel CC, editors. Handbook of Physiology Sect 2, The Cardiovascular System. Vol IV, The Microcirculation. Bethesda, MD: Am Physiol Soc; 1984. pp. 549–626. [Google Scholar]
- Beard DA. Computational framework for generating transport models from databases of microvascular anatomy. Ann Biomed Eng. 2001;29(10):837–43. doi: 10.1114/1.1408920. [DOI] [PubMed] [Google Scholar]
- Beard DA, Schenkman KA, et al. Myocardial oxygenation in isolated hearts predicted by an anatomically realistic microvascular transport model. Am J Physiol Heart Circ Physiol. 2003;285(5):H1826–36. doi: 10.1152/ajpheart.00380.2003. [DOI] [PubMed] [Google Scholar]
- Beaulieu C. The basis of anisotropic water diffusion in the nervous system - a technical review. NMR Biomed. 2002;15(7-8):435–55. doi: 10.1002/nbm.782. [DOI] [PubMed] [Google Scholar]
- Chen J, Song SK, et al. Remodeling of cardiac fiber structure after infarction in rats quantified with diffusion tensor MRI. Am J Physiol Heart Circ Physiol. 2003;285(3):H946–54. doi: 10.1152/ajpheart.00889.2002. [DOI] [PubMed] [Google Scholar]
- Damiano ER. The effect of the endothelial-cell glycocalyx on the motion of red blood cells through capillaries. Microvasc Res. 1998;55(1):77–91. doi: 10.1006/mvre.1997.2052. [DOI] [PubMed] [Google Scholar]
- Feng J, Weinbaum S. Lubrication theory in highly compressible porous media: the mechanics of skiing, from red cells to humans. Journal of Fluid Mechanics. 2000;422:281–317. [Google Scholar]
- Hrabe J, Hrabetova S, et al. A model of effective diffusion and tortuosity in the extracellular space of the brain. Biophys J. 2004;87(3):1606–17. doi: 10.1529/biophysj.103.039495. [DOI] [PMC free article] [PubMed] [Google Scholar]
- Huisman TA. Diffusion-weighted imaging: basic concepts and application in cerebral stroke and head trauma. Eur Radiol. 2003;13(10):2283–97. doi: 10.1007/s00330-003-1843-6. [DOI] [PubMed] [Google Scholar]
- Krogh A. The number and distribution of capillaries in muscle with calculations of the oxygen pressure head necessary for supplying the tissue. J Physiol (Lond) 1919;52:409–415. doi: 10.1113/jphysiol.1919.sp001839. [DOI] [PMC free article] [PubMed] [Google Scholar]
- Le Bihan D, van Zijl P. From the diffusion coefficient to the diffusion tensor. NMR Biomed. 2002;15(7-8):431–4. doi: 10.1002/nbm.798. [DOI] [PubMed] [Google Scholar]
- Maas LC, Mukherjee P, et al. Early laminar organization of the human cerebrum demonstrated with diffusion tensor imaging in extremely premature infants. Neuroimage. 2004;22(3):1134–40. doi: 10.1016/j.neuroimage.2004.02.035. [DOI] [PubMed] [Google Scholar]
- Minematsu K, Li L, et al. Diffusion-weighted magnetic resonance imaging: rapid and quantitative detection of focal brain ischemia. Neurology. 1992;42(1):235–40. doi: 10.1212/wnl.42.1.235. [DOI] [PubMed] [Google Scholar]
- Moseley ME, Kucharczyk J, et al. Diffusion-weighted MR imaging of acute stroke: correlation with T2-weighted and magnetic susceptibility-enhanced MR imaging in cats. AJNR Am J Neuroradiol. 1990;11(3):423–9. [PMC free article] [PubMed] [Google Scholar]
- Partridge SC, Mukherjee P, et al. Diffusion tensor imaging: serial quantitation of white matter tract maturity in premature newborns. Neuroimage. 2004;22(3):1302–14. doi: 10.1016/j.neuroimage.2004.02.038. [DOI] [PubMed] [Google Scholar]
- Pries AR, Secomb TW, et al. Biophysical aspects of blood flow in the microvasculature. Cardiovasc Res. 1996;32(4):654–67. [PubMed] [Google Scholar]
- Scollan DF, Holmes A, et al. Histological validation of myocardial microstructure obtained from diffusion tensor magnetic resonance imaging. Am J Physiol. 1998;275(6 Pt 2):H2308–18. doi: 10.1152/ajpheart.1998.275.6.H2308. [DOI] [PubMed] [Google Scholar]
- Scollan DF, Holmes A, et al. Reconstruction of cardiac ventricular geometry and fiber orientation using magnetic resonance imaging. Ann Biomed Eng. 2000;28(8):934–44. doi: 10.1114/1.1312188. [DOI] [PMC free article] [PubMed] [Google Scholar]
- Secomb TW, Hsu R. Simulation of O2 transport in skeletal muscle: diffusive exchange between arterioles and capillaries. Am J Physiol. 1994;267(3 Pt 2):H1214–21. doi: 10.1152/ajpheart.1994.267.3.H1214. [DOI] [PubMed] [Google Scholar]
- Secomb TW, Hsu R, et al. A model for red blood cell motion in glycocalyx-lined capillaries. American Journal of Physiology-Heart and Circulatory Physiology. 1998;43(3):H1016–H1022. doi: 10.1152/ajpheart.1998.274.3.H1016. [DOI] [PubMed] [Google Scholar]
- Sotak CH. The role of diffusion tensor imaging in the evaluation of ischemic brain injury - a review. NMR Biomed. 2002;15(7-8):561–9. doi: 10.1002/nbm.786. [DOI] [PubMed] [Google Scholar]
- Taylor GI. Dispersion of solute matter in solvent flowing slowly through a tube. Proc Roy Soc (London), Series A. 1953;219:186–203. [Google Scholar]
- Toosy AT, Ciccarelli O, et al. Characterizing function-structure relationships in the human visual system with functional MRI and diffusion tensor imaging. Neuroimage. 2004;21(4):1452–63. doi: 10.1016/j.neuroimage.2003.11.022. [DOI] [PubMed] [Google Scholar]