Abstract
Diabetic nephropathy is a serious, long-term complication of diabetes and the leading cause of end-stage renal disease throughout the world. Although this disease is progressively imposing a heavier burden on the health care system, in many aspects it remains poorly understood. In addition to environmental influences, there is abundant evidence in support of genetic susceptibility to microvascular complications of nephropathy in diabetic patients. Familial clustering of phenotypes such as end-stage renal disease, albuminuria and kidney disease have been reported in large scale population studies throughout the world demonstrating strong contribution of inherited factors. Recent genome-wide linkage scans identified several chromosomal regions that are likely to contain diabetic nephropathy susceptibility genes, and association analyses have evaluated positional candidate genes under linkage peaks. In this review we have extracted from the literature the most promising candidate genes thought to confer susceptibility to diabetic nephropathy and mapped them to affected pathways by using network-centric analysis. Several of the top susceptibility genes have been identified as network hubs and bottlenecks suggesting that they might be important agents in the onset of diabetic nephropathy.
Keywords: diabetes, ECM, gene ontology, networks, nephropathy, renal structural changes, review
Diabetic nephropathy (DN), also known as Kimmelstiel- Wilson syndrome, or nodular diabetic glomerulosclerosis and intercapillary glomerulonephritis, is a serious, long-term complication of diabetes and the leading cause of end-stage renal disease throughout the world1. Although this disease is progressively imposing a heavier burden on the health care system, it remains poorly understood in many aspects. The pathogenesis of DN is clearly multifactorial and several genes, proteins and environmental factors are likely to contribute to its onset. Due to the growing disease burden of diabetes and its complications, and due to the fact that early detection has been associated with improved outcomes, it is important to identify DN predictors, in order to facilitate its diagnosis and treatment. Control of traditional danger factors (hypertension, hyperlipidemia, smoking, obesity) has had a modest effect in this regard, especially for the group of diabetic patients with nephropathy. In recent years, scientists have therefore focused on the genome and its role in DN2,3. In this review, we examine recent research efforts and discuss the most important genes which have been indentified as potential contributors to DN.
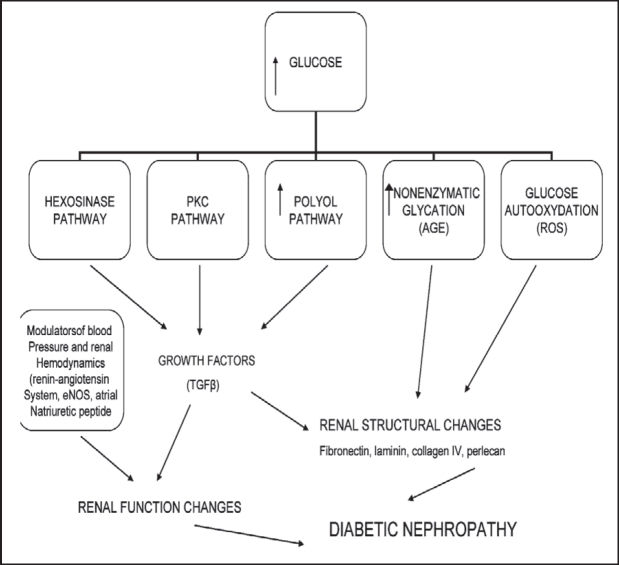
The renal lesions of DN are mainly related to the accumulation of extracellular matrix (ECM), including the thickening of the glomerular basement membrane (GMB) and later the tubular basement membrane, and the expansion of mesangium. This altered matrix composition seems to be an imbalance between ECM synthesis and its degradation4. Several metabolic, haemodynamic and intracellular causes have been proposed to explain the linkage between high glucose concentration and ECM accumulation5. As a primary initiator of DN, high glucose levels are associated with increased synthesis of cytokines and growth factors and with the diversion of glucose metabolism into at least three metabolic pathways, as shown in Figure 16. Thus, the key change in the onset of DN is accumulation of extracellular material. According to proposed mechanisms, hyperglycemia through several pathways induces the expression of transforming growth factor-beta (TGF%) in the glomeruli. TGF% probably is causative of cellular hypertrophy and increased synthesis of collagen, both being features that correlate well with the observed accumulation of extracellular material7.
Figure 1. Pathways operative in diabetic nephropathy.
It was previously thought that individuals who had diabetes and developed progressive diabetic nephropathy were simply victims of chronic diabetes with relatively poor glycemic control8. The concept that select individuals with diabetes were at differential risk for developing nephropathy was initially reported in 1989 but has only recently gained broad acceptance among nephrologists and diabetologists9. Epidemiological studies indicate that the prevalence of diabetic nephropathy increases during the first 15-20 years after the onset of diabetes and then reaches a plateau, suggesting that only a subset of patients is susceptible to the development of kidney disease. Indeed, only 20-40% of patients with microproteinuria go on to develop DN independent of treatment10. On the other hand, family studies show that diabetics with a family history with DN or hypertension or cardiovascular disease11,12 have a greater risk of developing kidney disease than those with no family history. Interestingly, the incidence of disease appears to be significantly influenced by the ethnic origin of patients with DN13. These findings suggest that genes play a role in the development of DN.
Genetic and genomic approaches to finding suscepti-bility genes for DN
The persistence of diabetic complications, including nephropathy especially in individuals who have undergone treatment for diabetes, could be due to genetic susceptibility to complications that cannot be prevented by improved glycemic control. Familial studies of diabetic families in Sweden and in the US have demonstrated that in families with two or more siblings, the presence of clinically defined diabetic nephropathy in one sibling is associated with a fourfold increase in the risk of other siblings to develop diabetic nephropathy14. Several studies have sought to discover alleles that contribute to genetic susceptibility by using gene linkage analysis and single nucleotide polymorphism discovery within or close to particular genes of interest, such as angiotensin converting-enzyme (ACE) or angiotensinogen (AGT) genes 15. Less biased strategies include the discovery of single nucleotide polymorphisms within the genome and the identification of haplotypes associated with disease-associated alleles16. In spite of these efforts, genetic approaches have failed to find a diseaseassociated haplotype that confers a greater than threefold risk of kidney disease either in, or between different ethnic groups with diabetes.
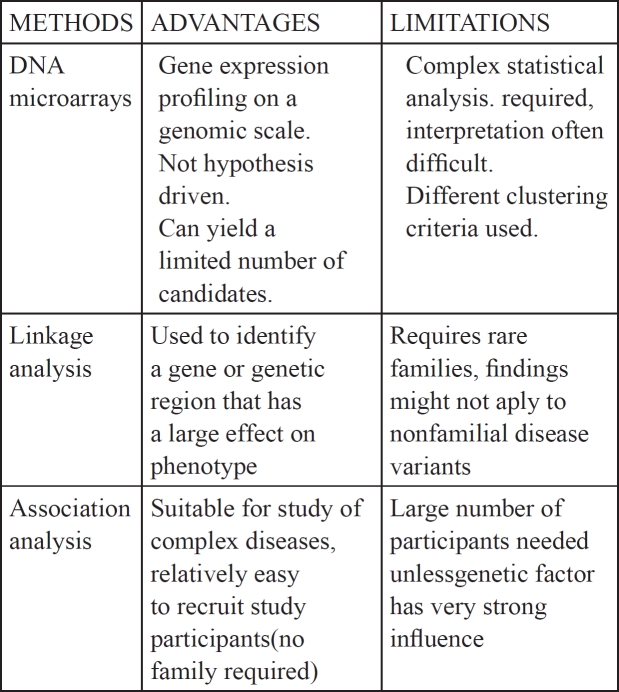
The development of genomic and proteomic methods has expanded our ability to analyze predisposition to various human diseases and to form plausible hypotheses based on familial histories. The use of PCR and of genome-wide expression analysis such as microarrays of nucleic acids and proteins along with the ability to identify and characterize single nucleotide polymorphisms allows us to not only characterize gene alterations on a genomic scale but also, and perhaps more importantly, it permits the association of patterns of genomic changes with clinical entities whose etiology is driven by subtle gene variations. Two strategies have been employed in the identification of chromosomal and gene regions that may confer susceptibility to DN: Linkage analysis on familial genetic diseases and Genome Wide Association Studies (comparing groups of unrelated DN patients with healthy controls). Identification of the genes involved in a complex disease can be facilitated by initially focusing on familial forms of the disease. This approach can take the form of linkage or association analysis. The advantages and disadvantages of these studies are summarized in Table 117.
Table 1. Advantages and limitations of genetic tools for identifying susceptible genes.
In general, linkage studies are more suitable for identifying rare gene variants that have a large effect on disease susceptibility. Markers that are distributed across the genome are genotyped in large family pedigrees. The frequencies of alleles transmitted or not transmitted to affected children are then compared. This method requires the availability of genetic material from large families, which is often a significant limitation. Nevertheless, more recent studies derived from cohorts in the Pima Indians and African-American ethnic group, who statistically show high percentage not only of diabetes but also to DN, have revealed four genetic loci (18q22-23, 7q35-36, 7q15, 10q26) thought to confer predisposition to DN18,19.
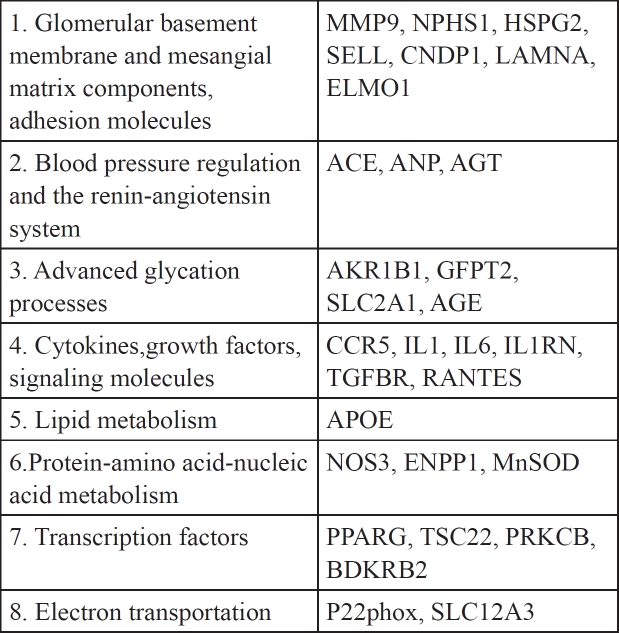
Significant effort has also been directed at Genome Wide Association Studies that compare the frequencies of polymorphisms/ SNPs between a population of unrelated, affected individuals and a control population. The genes identified are subsequently studied with regard to their position in the genome, their function and how their products may mediate the pathogenesis of DN20. Through this analysis, much attention has been focused on genes involved in the synthesis and degradation of glomerular basement membranes and mesangial matrix components. In addition genes involved in components of metabolic pathways affecting glucose metabolism, transport genes affecting blood pressure regulation and the renin-angiotensin system. Also genes encoding cytokines, growth factors, signaling molecules, and transcription factors and finally genes involved in advanced glycation processes. Genetic analyses of DN are complicated due to several factors. First, DN has late onset and therefore long-term follow-up is necessary and second, even within afflicted families, it is impossible to predict which family members are likely to develop diabetes.
Gene Ontology (GO) Analysis
Development of DN is associated with progressive functional and structural changes in affected nephrons that result from hemodynamic and metabolic pathway interactions that appear to contribute equally to the appearance of DN. While hemodynamic alterations due to complex interactions between mediators, such as prostanoids, NO, ROS, VEGF, TGFβ1 and RAAS, allow increased filtration of albumin at the glomerular level, metabolic changes due to growth factors and cytokines, such as PKC, MAPK, NFκB and those mediated by high glucose, ACEs and ROS lead to renal hypertrophy and accumulation of extracellular matrix components5,6. Although these processes are interlinked, it remains unclear how they are connected and, especially, how mutations in many different genes lead to signalling that contributes to DN.
We have mined from the PubMed and AceView databases (AceView database: http://www.ncbi.nlm.nih.gov/IEB/Research/Acembly/index.html) (Table 2 and in Supplementary file see sheet titled GeneList for DN) several different putative DN susceptibility genes, and the processes that they influence. The chief criterion used for selecting genes as candidates was specific and definitive association (p<0.05) of these genes with DN development or inhibition. For example it has been reported that use of angiotensin- converting-enzyme (ACE) inhibitors is associated with reduced risk of progression to end-stage renal disease. Also, Angiotensin-II-receptor blockers (ARBs) are renoprotective (but not cardioprotective) in patients with type 2 diabetes, overt nephropathy or microalbumenemia15 (For example, see Tables 4 and 5 within ref. 15). The pr*ducts of these genes affect different pathways whose deregulation might be critical for DN onset, however, it remains unknown how they interact and how known risk factors influence their functions. This imposes serious obstacles that hinder the identification of key regulators of onset and prompted us to seek different approaches in order to evaluate candidate genes and the interacting pathways that might be instrumental in orchestrating the onset of DN in diabetic patients. These genes have been classified in at least eight different groups (Table 2). Group 1 contains genes which encode products such as MMP9, a metalloproteinase, NPHS1, nephrin and HSPG2, a glucosaminoglycan. These products affect the glomerular basement membrane and its function which constitutes a key event in the development of DN. Group 2 contains genes that affect blood pressure and group 3 genes that mediate glycation products. The other groups contain genes whose products affect signaling pathways that influence structural and permeability properties of the glomerular basement membrane mediated by genes in groups 1 and 2.
Table 2. DN Candidate genes.
In order to reduce their functional complexity we re-analyzed these gene groups by extracting their gene ontology (GO) classification enrichment using the GATHER website21. GATHER uses a Bayes approach in order to evaluate the statistical significance of enriched functional terms associated with the gene list of interest using functional GO categories listed in the GO site (http://amigo.geneontology.org/cgi-bin/amigo/go.cgi), KEGG pathways, MeSH, transcription factor binding sites etc, combined with evolutionary homolog and network-predicted annotations for proteins related through literature or protein interactions. A p value and a Bayes number are used to indicate significance. The larger the (positive) Bayes value the higher the probability that the GO term is associated with the gene.
GO enrichment analysis employs a controlled vocabulary to compare a gene list, for example the DN susceptibility genes, with random lists of genes in order to find the most enriched functional annotations for the former list. Three general levels of annotations are used for each gene/gene product: a) Biological function, b) molecular/ biochemical function and c) sub-cellular localization. Functional annotation enrichment (reduction of functional complexity to statistically a few top terms) within the GATHER site provides clues for novel functions of gene groups by also using annotation information derived from evolutionary homologs of the putative DN susceptibility genes. The GATHER algorithm, which uses a Bayes approach, compares a list of genes that share measures of similarity, for example genes that are co-regulated or are candidates for DN predisposition, with a random list of genes in the genome and allows the retrieval of gene ontology classification for the former group using the aforementioned controlled vocabulary in the gene ontology (GO) database (http://www.geneontology.org), pathway terms in the KEGG database (http://www.genome.jp/kegg/pathway.html) and MeSH terms in the MeSH database (http://www.nlm.nih.gov/mesh/). We have confirmed the GATHER enrichment by performing a hyper-geometric distribution of annotations associated with DN susceptibility gene list within the GENECODIS site (http://genecodis.dacya.ucm.es/). The hypergeometric approach is a discrete probability distribution that describes the number of successes in a sequence of n draws from a finite population without replacement. For example, if "n" functional terms are drawn without replacement from a list (GO, KEGG etc) containing "N" genes in total, "m" of which have function n, the hypergeometric distribution describes the distribution of the number n drawn from the list. Based on this it then calculates a p value for each category (Table 3). The top functional categories that might contribute to a pathological condition can thus be identified and the genes that are highly associated (low p value or high Bayes number from GATHER) with them can be further analyzed computationally. Therefore, in order to reduce the gene list in Table 2 to the top three, most represented functional categories that are enriched in DN susceptibility and to associate these genes with pathways involved in DN, we have used the GATHER algorithm to retrieve their top GO pathways. As shown in Table 3, the top gene candidates for DN susceptibility in table 2 are enriched for two pathways: The cytokine-cytokine receptor interaction signalling pathways (groups 1 and 3 with p values 0.0001 and 0.006 respectively) which contain genes such as CCR5, Il1a and TGFβ1 and the Jak-Stat pathway with a p value of 0.004. We therefore hypothesized that genetic and functional interactions between genes belonging to the cytokine-cytokine and Jak-Stat pathways and derived from subtle alterations in genes that function in these pathways might play a crucial role for DN onset in diabetes. DN susceptibility might be increased by signalling that leads to altered remodelling of the ECM in the glomerulus, thus influencing blood pressure and eventually leading to nephropathy. Alternatively, high blood pressure in collaboration with altered glucose sensitivity might facilitate ECM remodelling leading to subtle alterations in the glomerulus. How these pathways interact with abnormal glucose metabolism is unknown and remains an interesting and crucial question to be answered experimentally.
Table 3. Top GO categories enrichmed for DN susceptibility candidate genes shown in Table 2.
A network-based approach to analyze DN susceptibility
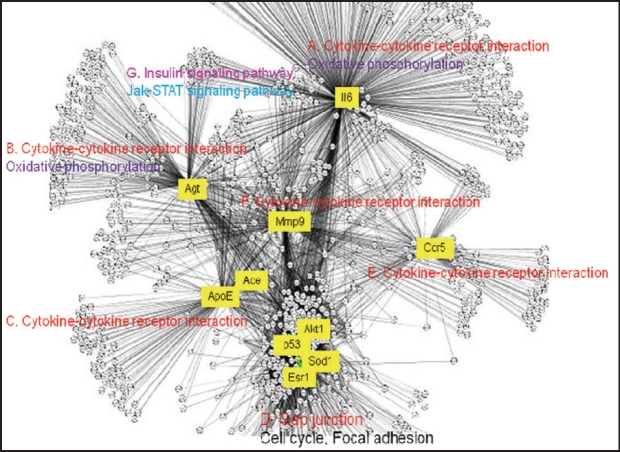
In order to gain a deeper understanding of the interactions between these pathways and to map key candidate genes in Table 2 onto network modules of interacting pathways, we applied a network-centric approach in order to 1) identify the top hubs in the DN network and 2) to evaluate top network modules that regulate DN via these pathways by re-constructing a DN network. The reconstruction of biological networks, many of which are scale-free, permits the analysis of data within the context of a specific disease network and helps to evaluate specific genes and gene products by taking into account all interactions and interrelationships between candidate genes22. In scale-free biological networks a few nodes (hubs) have many connections to other nodes but most nodes possess few connections (Figure 2). Hubs typically organize networks in sub-networks and in functional modules whose member genes might code for proteins that can be co-complexed in intracellular complexes. Other proteins or genes that are called bottlenecks may act as links between functional network modules and they may facilitate signaling. Moreover, proteins that share a large number of neighbors in a genetic-physical interaction network tend to be in the same complex and similarly, proteins that are functional in the same complex will tend to be coexpressed, to be network neighbors and found in network motifs. We therefore were interested in identifying top hubs and bottlenecks and how they organized the DN network.
Figure 2. DN network reconstructed as described in text: Major modules and pathways.
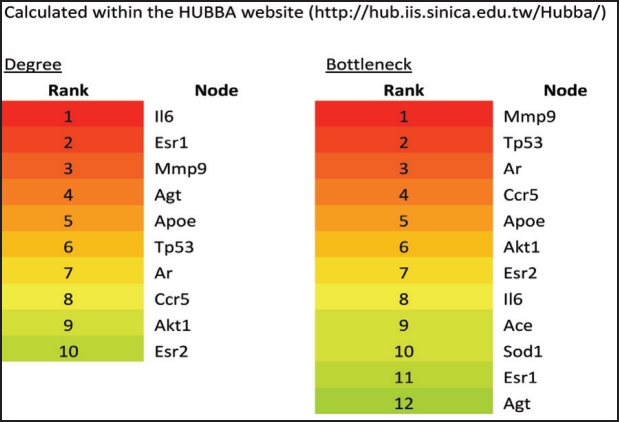
Using as queries the genes in Table 2, we mined 1) their interactors from the human reference (HPRD, http:// www.hprd.org/) and the STRING (http://www.bork.emblheidelberg.de/STRING/) databases and 2) all interrelationships between them using text-mining within the CONRAD database (http://conrad.licr.org/). We then re-constructed a DN network (Supplementary file 1*) using the Cytoscape (http://www.cytoscape.org/) and Hubba programs (http://hub.iis.sinica.edu.tw/Hubba/) (Figure 2) and analyzed the network by identifying top hubs and bottleneck nodes (genes/proteins). Hubs are genes and gene products that possess the highest number of connections (interactions/ interrelationships) and are therefore likely to control overall biological network functions, and top bottlenecks are genes/gene products that link functional network modules and are critical for inter-module communication and are therefore critical for pathway communications23.
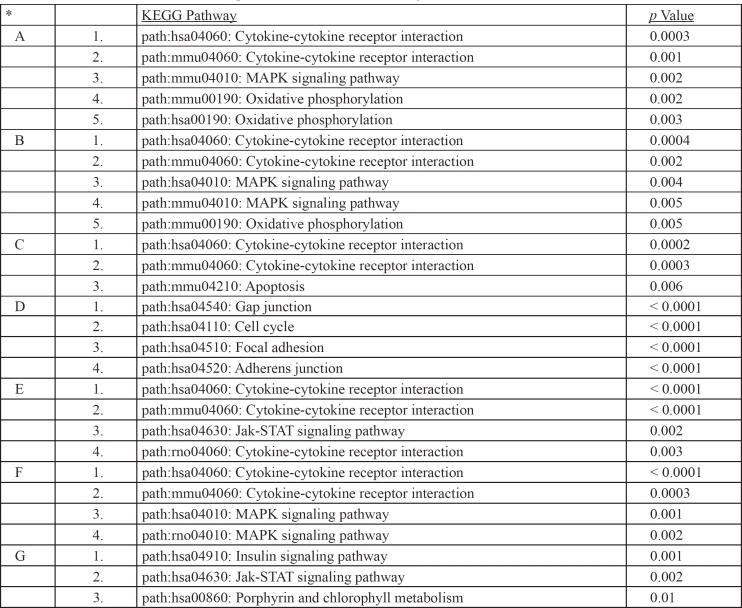
Using this analysis we have identified several of the candidate genes in Table 2 as top hubs and bottlenecks in the DN network (Figure 2 and Figure 3) and mapped them to major network modules and pathways that appear to be operative in DN onset (Table 4). The reconstructed DN network is scale-free (Figure 2) and several of the literature-identified genes, such as Il6, Agt, Mmp9, Ccr5 and ApoE, are top hubs and bottlenecks. The most prominent network module is represented by the cytokine-cytokine pathway having as hubs IL6, AGT, ACE/ ApoE, CCR5 and MMP9 (Figure 2). Also, these genes are top bottlenecks (Figure 3) suggesting that they play major roles in DN susceptibility. Two more network modules and interconnected pathways, which were not apparently represented by member genes in the literature-derived DN susceptibility genes, appear to be important. They are the gap junction/cell cycle/focal adhesion and insulin signalling pathways (Figure 2). These pathways contain genes whose products are likely to be functional in ECM remodelling seen in DN onset. The oxidative phosphorylation pathway is also enriched in representative genes in module B (Figure 2 and Table 4) and probably accounts for the role of the reported ACE and SOD genes in DN susceptibility. The cytokine Il6 which is the top hub in module A (Figure 2 and Table 4) and AGT belong to modules A and B which are enriched in genes that function in the cytokine-cytokine, MAPK and oxidative phosphorylation pathways, suggesting that signalling activated by changes in these genes are critical for DN onset resulting from interactions between these pathways. Notably also, DN network modules A and B are linked with module G which is enriched in genes functioning in insulin signalling (Figure 2 and Table 4) thus linking elevated glucose and therefore activated insulin signalling to cytokine signalling. Integration of these pathways with cell cycle/focal adhesion events (module D) probably contributes to ECM in the glomerulus thus accounting for the structural changes seen in diabetic kidneys with DN. MMP9 (module G in Figure 2) is a likely contributor to ECM remodelling and structural changes in the glomerulus.
Figure 3. Top hubs and bottlenecks in the DN network. Top hubs and bottlenecks were identified as described in the text and listed by rank. Except for Ace and Sod1, all bottlenecks also are hubs (in red), suggesting that they play important roles in DN network structure.
Table 4. Major enriched modules identified with network analysis for DN network and their gene ontology associations. *A-G refer to network modules with respective hubs as indicated in Figure 2.
Conclusion
Earlier investigations that focused on genetic mapping and analysis of specific candidate genes provided the foundation for current studies that target linkage peaks and specific genes on a genomic scale. In this work we suggest that while single candidate gene analysis in theory allows for the study of both major and minor gene effects, in practice it generally yields conflicting results primarily because, like several other human diseases or syndromes, DN can develop form the interactions between several hundred genes that, alone, would have no effect but which when subtly altered could predispose to DN. Additionally, observed discrepancies can be partly explained by the relatively small size of study cohorts. Nevertheless, the use of genome wide association studies and SNP analysis of complex disease phenotypes remains a promising approach, especially as microarrays are now used to identify up-regulated and down-regulated gene groups that distinguish between diabetic yet healthy kidneys and diabetic kidneys with DN. As our understanding of DN increases, the sophistication of our approaches, and the size and cost of association studies is also likely to increase. Combining network analysis to identify top hubs that control network behaviour and more classical approaches might reveal key genes and gene products that predispose to DN development. At the moment, no single gene with a large effect has been identified in the emergence, progression and/ or severity of DN.
Conflict of Interest Statement: The authors declare no competing interests.
*Contact corresponding author for file.
References
- 1.Cameron JS. The discovery of diabetic: from small print to centre stage. J Nephrol. 2006;19:75–87. [PubMed] [Google Scholar]
- 2.Gross JL, de Azevedo MJ, Silveiro SP, Canani LH, Caramori ML, Zelmanovitz T. Diabetic nephropathy: diagnosis, prevention, and treatment. Diabetes Care. 2005;28:164–176. doi: 10.2337/diacare.28.1.164. [DOI] [PubMed] [Google Scholar]
- 3.Susztak K, Bottinger EP. Diabetic nephropathy: a frontier for personalized medicine. J Am Soc Nephrol. 2006;17:361–367. doi: 10.1681/ASN.2005101109. [DOI] [PubMed] [Google Scholar]
- 4.Salinas-Madrigal L, Pirani CL, Pollak VE. Glomerular and vascular "insudative" lesions of diabetic nephropathy: electron microscopic observations. Am J Pathol. 1970;59:369. [PMC free article] [PubMed] [Google Scholar]
- 5.Schrijvers BF, De Vriese AS, Flyvbjerg A. From hyperglycemia to diabetic kidney disease: the role of metabolic, hemodynamic, intracellular factors and growth factors/cytokines. Endocr Rev. 2004;25:971. doi: 10.1210/er.2003-0018. [DOI] [PubMed] [Google Scholar]
- 6.Brownlee M. Biochemistry and molecular cell biology of diabetic complications. Nature. 2001;414:813. doi: 10.1038/414813a. [DOI] [PubMed] [Google Scholar]
- 7.Huang J, Kim Y, Caramori ML, Fish A, Rich S, Miller M, et al. The transforming growth factor-beta system and diabetic nephropathy lesions in type 1 diabetes. Diabetes. 2002;51:3577. doi: 10.2337/diabetes.51.12.3577. [DOI] [PubMed] [Google Scholar]
- 8.Retinopathy and nephropathy in patients with type 1 diabetes four years after a trial of intensive therapy. The Diabetes Control and Complications Trial/Epidemiology of Diabetes Intervention and Complications Research Group. N Engl J Med. 2000;342 [Google Scholar]
- 9.Seaquist ER, Goetz FC, Rich SS, Barbosa J. Familial clustering of diabetic kidney disease: Evidence for genetic susceptibility to diabetic nephropathy. N Engl J Med. 1989;320:1161. doi: 10.1056/NEJM198905043201801. [DOI] [PubMed] [Google Scholar]
- 10.Krolewski AS, Warram JH, Christlieb AR, Busick EJ, Kahn CR. The changing natural history of nephropathy in type I diabetes. Am J Med. 1985;78:785. doi: 10.1016/0002-9343(85)90284-0. [DOI] [PubMed] [Google Scholar]
- 11.Borch-Johnsen K, Norgaard K, Hommel E, Mathiesen ER, Jensen JS, Deckert T, et al. Is diabetic nephropathy an inherited complication? Kidney Int. 1992;41:719. doi: 10.1038/ki.1992.112. [DOI] [PubMed] [Google Scholar]
- 12.Quinn M, Angelico MC, Warram JH, Krolewski AS. Familial factors determine the development of diabetic nephropathy in patients with IDDM. Diabetologia. 1996;39:940. doi: 10.1007/BF00403913. [DOI] [PubMed] [Google Scholar]
- 13.Karter AJ, Ferrara A, Liu JY, Moffet HH, Ackerson LM, Selby JV. Ethnic disparities in iabetic complications in an insured population. JAMA. 2002;287:2519. doi: 10.1001/jama.287.19.2519. [DOI] [PubMed] [Google Scholar]
- 14.Tonna S, El-Osta A, Cooper M, Tikellis C. Metabolic memory and diabetic nephropathy: potential role for epigenetic mechanisms. Nat Rev Nephrol. 2010;6:332. doi: 10.1038/nrneph.2010.55. [DOI] [PubMed] [Google Scholar]
- 15.Ewens KG, George RA, Sharma K, Ziyadeh FN, Spielman RS. Assessment of 115 candidate genes for diabetic nephropathy by transmission/disequilibrium test. Diabetes. 2005;54:3305. doi: 10.2337/diabetes.54.11.3305. [DOI] [PubMed] [Google Scholar]
- 15.Vardarli I, Baier L, Hanson RL, Janssen JA, Akkoyun I, Fisher C, et al. Gene for susceptibility to diabetic nephropathy in type 2 diabetes maps to 18q22.3-23. Kidney Int. 2002;62:2176–2183. doi: 10.1046/j.1523-1755.2002.00663.x. [DOI] [PubMed] [Google Scholar]
- 17.Borst MH, Benigni A, Remuzzi G. Primer: Strategies for Identifying Genes Involved in Renal Disease. J Immunol. 2008;181:1460–1469. doi: 10.1038/ncpneph0785. [DOI] [PubMed] [Google Scholar]
- 18.Bowden DW, Colicigno CJ, Langefeld CD, Sale MM, Williams A, Anderson PJ, et al. A genome scan for diabetic nephropathy in African Americans. Kidney Int. 2004;66:1517. doi: 10.1111/j.1523-1755.2004.00915.x. [DOI] [PubMed] [Google Scholar]
- 19.Imperatore G, Hanson RL, Pettitt DJ, Kobes S, Bennett PH, Krowler WC. Sib-pair linkage analysis for susceptibility genes for microvascular complications among Pima Indians with type 2 diabetes. Pima Diabetes Genes Group. Diabetes. 1998;47:821–830. doi: 10.2337/diabetes.47.5.821. [DOI] [PubMed] [Google Scholar]
- 20.Granier C, Makni K, Molina L, Jardin-Watelet B, Ayadi H, Jarraya F. Gene and protein markers of diabetic nephropathy. Nephrol Dial Transplant. 2008;23:792. doi: 10.1093/ndt/gfm834. [DOI] [PubMed] [Google Scholar]
- 21.Chang JT, Nevins JR. GATHER: A Systems Approach to Interpreting Genomic Signatures. Bioinformatics. 2006;22:2926. doi: 10.1093/bioinformatics/btl483. [DOI] [PubMed] [Google Scholar]
- 22.Barabasi AL, Oltvai ZN. Network biology: Understanding the cell's functional organization. Nat Rev Genet. 2004;5:101–111. doi: 10.1038/nrg1272. [DOI] [PubMed] [Google Scholar]
- 23.Zhu X, Gerstein M, Snyder M. Getting connected: analysis and principles of biological networks. Genes Development. 2007;21:101. doi: 10.1101/gad.1528707. [DOI] [PubMed] [Google Scholar]


