Abstract
We present an analytical method that yields the real and imaginary parts of the refractive index (RI) from low coherence interferometry measurements, leading to the separation of the scattering and absorption coefficients of turbid samples. The imaginary RI is measured using time-frequency analysis, with the real part obtained by analyzing the non-linear phase induced by a sample. A derivation relating the real part of the RI to the non-linear phase term of the signal is presented along with measurements from scattering and non-scattering samples that exhibit absorption due to hemoglobin.
Substantial efforts have been made to quantitatively measure absorption of biological chromophores in vivo for diagnosis [1–3]. Unfortunately, several drawbacks have been encountered, primarily dealing with the limitation of the number of physical parameters that may be independently measured and determined using analytical models. For example, in spectroscopic optical coherence tomography (SOCT), some promising results for quantifying absorption in vivo have been reported [2–4], but these have been limited owing to the fact that SOCT measures the total attenuation coefficient and the absorption and scattering contributions have not been separated without a priori information. Consequently, in order to assess absorption, models must include additional parameters, such as packing factors and anisotropic coefficients, which results in low confidence intervals, thereby hindering quantification [5]. Rather than using attenuation, some researchers have used phase information as means of obtaining concentrations of chromophores [6]. These methods, however, are often confined to thin, transparent samples and thus are not well suited for in vivo measurements.
In this letter, we analyze the dispersion of turbid samples using low coherence interferometric (LCI) signals, in combination with time-frequency (TF) analysis, to retrieve the real and imaginary parts of the RI independently of scattering contributions and without a priori information. Using a supercontinuum broadband light source, we demonstrate that this method yields wide-band absorption spectral profiles with high spectral resolution, and wavelength-dependent RI profiles. By isolating the contribution due to absorption, the wavelength-dependent scattering coefficient is also obtained.
To understand how the real and imaginary parts of the RI may be obtained, consider a Michelson interferometer with a reference field described as Er(ω)=S(ω)exp[i(ω/c0)2zr], and a sample field returned by m scatterers written as
| (1) |
where zr, zd, zs are the distances from the beamsplitter to the reference mirror, dispersive medium, and scatterer, respectively; S(ω) is the spectrum of the source field, co is the speed of light in vacuum, and n(ω) is the real part of the RI of the sample [7]. For simplicity, we assume that there is a single scatterer (m = 1), and that the sample can be described by bulk absorption and scattering coefficients μa and μs, respectively; such that, the sample field intensity may be written as, Is(ω) =|S(ω)|2 exp[−(μa+μs) 2(zs−zd)]. Thus, the interferometric signal, after elimination of dc background terms, is given by,
| (2) |
where Ir = |S|2, μtot = μa + μs, z′ = zr − zd, and d = zs − zd. Then, to analyze the information contained in the dispersion of the signal, we consider a Taylor series expansion of n(ω), n(ω) = n(ω0) +Δn(ω), where n(ω0) may be evaluated at an arbitrary frequency or wavelength (e.g., at λ = 800nm, n0 =1.392 for hemoglobin [8]), and Δn incorporates all the terms dependent on ω from the Taylor series expansion. Thus, Eq. 2 may be rewritten as,
| (3) |
As Eq. 3 describes, the measured signal contains three parts: The first part modulates the intensity, which yields spectroscopic information and, if scattering is negligible, the imaginary part of the RI, κ=cμa/(2ω), may be directly measured. The second part linearly modulates the phase of the interference signal, which can be processed to yield depth resolved information by simply taking a Fourier transform, as is commonly done in spectral domain OCT. Lastly, the third term describes dispersion due to the sample. This term shows a non-linear modulation of the phase, which can degrade the resolution of the axial information in OCT, but also contains the wavelength-dependent changes in the real part of the RI. Previous efforts to quantify absorption [2–4] and scattering [9], have only used the intensity and the linear phase term and have ignored the information contained in the dispersive term.
Algorithms have been developed for removing dispersion inherent in an optical system or due to a sample, based on removing the phase terms that are non-linear with respect to ω [10]. One such algorithm, presented by Zhu et al. [10], fits the unwrapped phase of the signal to a line of the form φ = (ω/c0)L−2πm, where m is a positive integer and L is the wavelength-independent, best estimate of the constant 2(z′ − dn0) in Eq 3. The residual phase, Δφ, which is the difference between the unwrapped phase and φ, is then subtracted from the phase of subsequent acquisitions to obtain dispersion free signals. Therefore, the residual phase is related to the real part of the RI by Δφ =(ω/c0)2dΔn(ω). Then, by principles of causality, and using Kramers-Kroning (KK) relations, the real part of the RI may be expressed in terms of the imaginary part, which is proportional to the absorption coefficient. Note that Δn and μa are quantities linearly-dependent on concentration.
Let us consider the quantification of hemoglobin (Hb) concentration for two cases. In the case where the scattering coefficient is negligible (case A), the real and imaginary parts of the RI may be calculated simultaneously. This case is highly idealized and only serves as a base of comparison for case B, where scattering is not negligible. In case A, μtot = μa = 2κω/c0, and the imaginary part of the RI (κ) can be directly obtained using TF analysis, while the real part of the RI can be calculated from Δφ. Both independent measurements may be used to measure the concentration of chromophores. However, in a more biologically relevant case, where μs is not negligible and unknown (case B), the measured attenuation, obtained from TF analysis, will overestimate chromophore concentrations. Erroneous estimations may be avoided by introducing other free parameters, but this process yields results with low confidence intervals [5]. On the other hand, for case B,Δφ will give the same results as in the idealized case A, for equal chromophore concentrations, regardless of the influence of scattering. Thus, because the real RI of the absorber is calculated from Δφ, the imaginary part of the RI, which is proportional to the absorption coefficient (μa), may be determined independently of scattering using the KK relation. Lastly, by using the determined μa and the measured total attenuation coefficient, μtot, for case B, the scattering coefficient may also be obtained, simply by subtraction, μs = μtot − μa.
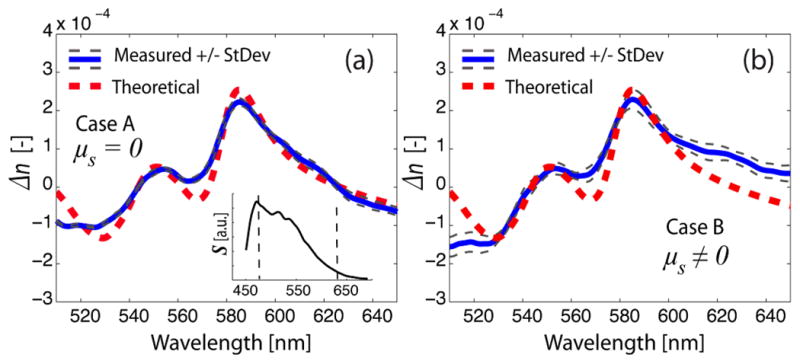
To demonstrate the validity of this approach, LCI signals from scattering and non-scattering Hb phantoms were analyzed. The system used a typical Michelson interferometer geometry, where broadband light from a supercontinuum source (Fianium, Eugene, OR), is focused onto the sample. A series of filters are used to shape the source spectrum, thus delivering a total power of ~1.5mW, with a spectral range from ~450nm to 700nm, onto the sample (see inset of Fig. 2). Scattered light returned from the sample is mixed with a reference field and relayed to a spectrometer for detection. With the center wavelength λ0=575nm, spectral resolution δλ=0.2nm, and bandwidth Δλ=240nm, we operate in a spectral region where the light experiences high degrees of absorption from Hb, which in turn results in significant changes in the real part of the RI.
Fig. 2.

Measured change in the real part of the refractive index of the Hb phantoms without scattering (case A) (a), and with scattering (case B) (b). The theoretical change in the real part of the refractive index of Hb, with a concentration of 40 g/L, is also plotted. The inset illustrates the source’s spectrum, S, with the dotted lines denoting the bandwidth used for estimating concentration using the real part of the RI.
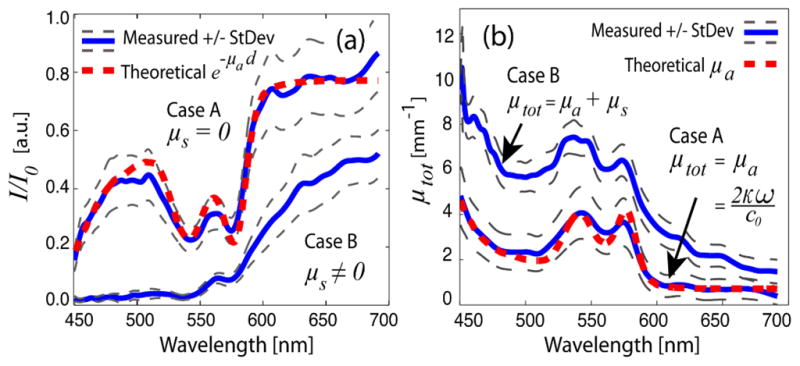
First, the absorption due to the sample is analyzed to obtain the imaginary part of the RI. For case A, fully oxygenated Hb (Sigma-Aldrich, St. Louis, MO), diluted to 40 g/L in water, was used. For case B, 10.75% by volume of the aqueous solution in the phantom was made up of 10%-Intralipid (IL), which possesses a scattering coefficient four orders of magnitude greater than its absorption coefficient. The solutions were then placed between microscope slides with spacers used to set the sample thickness to 400 μm. For comparison, the total Hb absorption from these samples is approximately equivalent to a 100 μm thick sample of whole blood (150 g/L Hb) or a few millimeters of tissue (~2–7 g/L). Depth resolved spectral profiles were acquired from the interferometric data using the dual window method as described in [4]. To obtain concentration values, individual Hb spectra were acquired and normalized by a reference spectrum obtained from the average of 10 acquisitions of a pure water sample. The logarithm of the ratio was taken, yielding, ln(I/I0) = −μad = −Cdε(ω)/MW, where ε(ω) is the molar extinction coefficient, which is independent of Hb concentration (C), I0 is the reference water spectrum, and MW is the molecular weight of Hb (MW = 64,500 g/mole). Since ε(ω) is known [11], a linear least squared method was used to estimate C. The average of 10 measurements for case A, gave C = 40.48 +/− 2.30 g/L, in good agreement with the known concentration. For case B, C = 58.13 +/− 4.35 g/L, which, as expected, overestimates the actual Hb concentration due to the contribution to attenuation from scattering, which is not accounted for in this simple model. The measured cumulative absorption for cases A and B, and theoretical absorption from Hb are shown in Fig 1(a). Fig 1(b) shows the measured total attenuation coefficients along with the theoretical absorption coefficient of Hb.
Fig. 1.

Measured cumulative absorption (a) and total attenuation coefficient (b) of the Hb phantoms without scattering (case A) and with scattering (case B). The theoretical absorption with d = 400μm and C = 40 g/L (a), and absorption coefficient with C = 40 g/L (b), are also plotted.
Next, the non-linear phase term was analyzed to determine the real part of the RI. After dispersion effects inherent in the system and resulting from a water phantom were accounted for, the residual phase, Δφ, from Hb phantoms, was obtained using the method described above. Then, using a subtractive KK relation [8], Δn values, which depend linearly on concentration, were determined; thus allowing assessment of Hb concentrations via a linear least squares fitting method. Here, a limited bandwidth was used to avoid regions of low intensity, due to the source, as seen in the inset of Fig. 2, and due to regions of substantial Hb attenuation at the lower wavelengths, as seen in Fig. 1. Based on analysis of the nonlinear phase, we obtained C = 39.80 +/− 1.00 g/L for case A, and C = 41.09 +/− 1.93 g/L for case B; both are in excellent agreement with the known Hb concentration. The measured and theoretical Δn values are shown in Fig. 2(a) for case A and in Fig. 2(b) for case B. Note that the theoretical and measured real RI profiles are in good agreement for both cases; however, some discrepancies are observed at the edges of the range of analysis for case B, which need further investigation. From these results, the imaginary part of the RI, and hence μa, may be determined independently of scattering. Since the calculated concentrations for both cases are approximately equal, the absorption coefficient for case B (not shown) is the same as μtot= μa for case A in Fig. 1(b).
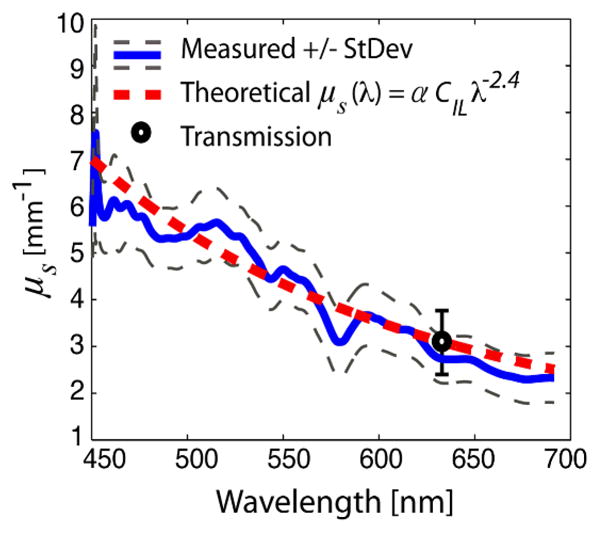
The scattering coefficient of the scattering sample (case B) can now be determined from the imaginary part of the RI. The obtained μa is subtracted from the total attenuation coefficient, μtot, to give μs (Fig. 3). These results were then compared to a model of the form μs = αCIL λ−2.4, which has been shown to be an adequate model of 10%-IL scattering for a wavelength range of 400nm–1100nm and concentrations of 4%–17% [12]. Here, the concentration of 10%-IL, CIL, is defined as the ratio between the volume of 10%-IL and the total aqueous solution. Further, α is a concentration-independent factor, which, in part, accounts for inconsistencies in the manufacturing process and must therefore be experimentally measured for each batch of 10%-IL. To obtain α, a HeNe laser was used in a transmission experiment, where 10%-IL was diluted to different concentrations in 5mm-thick glass cuvettes. The average valueα = 9.62 +/− 2.8 was used to determine a best-fit 10%-IL concentration from the measured μs, for case B. This analysis gave CIL = 10.40 +/− 1.40%, in very good agreement with the actual 10%-IL concentration (10.75%). Note that by using the average α for CIL =10.75%, we obtain an ideal μs = 3.10 +/− 0.9 mm−1 at λ=632.8nm: this value is used as a calibration point to assess the theoretical μs illustrated in Fig. 3.
Fig. 3.

Measured and theoretical scattering coefficient of 10% IL with a 10.75% concentration.
In conclusion, we have derived a relation that yields the real part of the RI from the non-linear phase term of interferometric signals in LCI. Using this relation, in combination with TF analysis, the absorption and scattering coefficients may be separated for samples that both scatter and absorb light, without a priori information. We validated the approach by analyzing the composition of Hb phantoms with and without scattering present. The results show that this method may help overcome the issues that currently prevent depth-resolved interferometric techniques from quantifying absorption in turbid samples. Further, this method may be readily extended to SOCT for imaging, in addition to allowing quantification of chromophores in blood and tissue in vivo.
Acknowledgments
This research has been supported by grants from the National Institutes of Health (NIH) (NCI 1 R01 CA138594-01).
References
- 1.Friebel M, Roggan A, Müller G, Meinke M. Determination of optical properties of human blood in the spectral range 250 to 1100nm using Monte Carlo simulations with hematocrit-dependent effective scattering phase functions. J Biomed Opt. 2006;11:034021. doi: 10.1117/1.2203659. [DOI] [PubMed] [Google Scholar]
- 2.Hermann B, Hofer B, Meier C, Drexler W. Spectroscopic measurements with dispersion encoded full range frequency domain optical coherence tomography in single and multilayered non-scattering phantoms. Opt Express. 2009;17:24162. doi: 10.1364/OE.17.024162. [DOI] [PubMed] [Google Scholar]
- 3.Faber D, Mik E, Aalders M, van Leeuwen T. Toward assessment of blood oxygen saturation by spectroscopic optical coherence tomography. Opt Lett. 2005;30:1015–1017. doi: 10.1364/ol.30.001015. [DOI] [PubMed] [Google Scholar]
- 4.Robles F, Graf RN, Wax A. Dual window method for processing spectroscopic optical coherence tomography signals with simultaneously high spectral and temporal resolution. Opt Express. 2009;17:6799–6812. doi: 10.1364/oe.17.006799. [DOI] [PMC free article] [PubMed] [Google Scholar]
- 5.Faber DJ, van Leeuwen T. Are quantitative attenuation measurements of blood by optical coherence tomography feasible? Opt Lett. 2009;34:1435. doi: 10.1364/ol.34.001435. [DOI] [PubMed] [Google Scholar]
- 6.Park Y, Yamauchi T, Choi W, Dasari R, Feld MS. Spectroscopy phase microscopy for quantifying hemoglobin concentrations in intact red blood cells. Opt Lett. 2009;34:3668. doi: 10.1364/OL.34.003668. [DOI] [PMC free article] [PubMed] [Google Scholar]
- 7.Izatt JA, Choma MA. Theory of Optical Coherence Tomography. In: Drexler W, Fujimoto JG, editors. Optical Coherence Tomography: Technology and Applications. Springer; 2008. pp. 47–72. [Google Scholar]
- 8.Faber D, Aalders M, Mik E, Hooper B, van Gemert M, van Leeuwen T. Oxygen saturation-dependent absorption and scattering of blood. Phys Rev Lett. 2004;93:28102. doi: 10.1103/PhysRevLett.93.028102. [DOI] [PubMed] [Google Scholar]
- 9.Robles F, Wax A. Measuring morphological features using light-scattering spectroscopy and Fourier-domain low-coherence interferometry. Opt Lett. 2010;35:360. doi: 10.1364/OL.35.000360. [DOI] [PMC free article] [PubMed] [Google Scholar]
- 10.Zhu Y, Terry N, Wax A. Scanning fiber angle-resolved low coherence interferometry. Opt Lett. 2009;34:3196–3198. doi: 10.1364/OL.34.003196. [DOI] [PMC free article] [PubMed] [Google Scholar]
- 11.Prahl S. Optical Absorption of Hemoglobin. http://omlc.ogi.edu/spectra/hemoglobin/
- 12.van Staveren HJ, Moes JM, van Marle J, Prahl SA. Light scattering in Intralipid-10% in the wavelength range of 400–1100 nm. App Opt. 1991;30:4507–4514. doi: 10.1364/AO.30.004507. [DOI] [PubMed] [Google Scholar]


