Abstract
In this report, the model proteins staphylococcal nuclease and ubiquitin were used to test the applicability of two new hydrogen/deuterium exchange (HX) electrospray ionization mass spectrometry (ESI-MS) methods for estimating protein folding energies. Both methods use the H/D exchange of globally protected amide protons (amide protons which are buried in the hydrophobic core) to elucidate protein folding energies. One method is a kinetic-based method and the other is equilibrium-based. The first method, the HX ESI-MS kinetic-based approach is conceptually identical to SUPREX (stability of unpurified proteins from rates of H/D exchange) method but is based on ESI-MS rather than MALDI-MS (matrix assisted laser desorption mass spectrometry). This method employs the time-dependence of H/D exchange using various denaturant concentrations to extract folding energies. Like SUPREX, this approach requires the assumption of EX2 exchange kinetics. The second method, which we call a protein equilibrium population snapshot (PEPS) by HX ESI-MS uses data collected only for a single time point (usually the shortest possible) to obtain a snapshot of the open and closed populations of the protein. The PEPS approach requires few assumptions in the derivation of the equations used for calculation of the folding energies. The extraction of folding energies from mass spectral data is simple and straightforward. The PEPS method is applicable for proteins that follow either EX1 or EX2 HX mechanisms. In our experiments the kinetic-based method produced less accurate ΔGH2O and mGdHCl values for wild-type staphylococcal nuclease and mutants undergoing H/D exchange by EX1, as would be expected. Better results were obtained for ubiquitin which undergoes HX by an EX2 mechanism. Using the PEPS method we obtained ΔGH2O and mGdHCl values that were in good agreement with literature values for both staphylococcal nuclease (EX1) and ubiquitin (EX2). We also show that the observation of straight lines in linear extrapolation method (LEM) plots is not a reliable indicator of the validity of the data obtained using the LEM approach.
1. Introduction
Typically a specific conformation of a folded protein is biologically active and an unfolded or misfolded state is less so. Unfolding or misfolding may thus be associated with disease when biologically important proteins have less than the necessary function needed for full health [1]. Protein folding is significantly influenced by noncovalent interactions such as hydrogen bonding, ionic interactions, van der Waals’ forces and hydrophobic effects [2,3]. While the protein is constantly folding and unfolding, bonding forces generally ensure that the native state is more strongly populated than any other conformation. Any changes in the protein’s environment that disrupt these forces and increase the extent of unfolding may also denature the protein. Agents such as urea or guanidine hydrochloride (GdHCl), as well as pH and temperature changes have been used to deliberately denature proteins [4,5,6,7,8]. Such deliberate modifications to the protein’s environment have been used to determine protein folding energies [4]. In the literature, most protein denaturation studies have been monitored using spectroscopic probes. Typically these are based on tryptophan or tyrosine fluorescence, or circular dichorism (CD) [4,5,6,9].
While these approaches are widely used, they have some disadvantages. Tryptophan residues are relatively rare in protein sequences and the resulting fluorescence changes only convey information about local changes. Tyrosines are more common, but also only report local structure. Tyrosine fluorescence is difficult to follow if tryptophan is also present. Circular dichroism signals from helices and sheets are more global in nature with respect to protein structure, but measuring the comparatively weak CD signal requires a large amount of protein present in high concentration. Thus, these techniques are not ideally suited for measurement of folding energies in complex environments where other proteins or compounds contribute similar and overlapping spectroscopic signals [10,11,12,13,14,15,16].
Mass spectrometry, on the other hand, is well suited for studying proteins at low levels and in complex mixtures. Most often MALDI and ESI are the approaches of choice. Examples from recent literature include MS-based studies of protein folding, protein structure, mapping changes associated with mutations, protein-ligand interactions and protein-protein interactions. H/D exchange [17,18], chemical modification, and limited proteolysis [19] are among the techniques most frequently coupled with MS for this purpose. Of these, H/D exchange has been the most popular and when carefully applied, can accurately reflect biologically relevant solution-phase properties including binding and folding [20, 21, 22, 23,24, 25, 26, 27, 28,29,30,31,32]. Most of these methods are kinetics-based. The widely used SUPREX [25,27] and related technique SPROX [32] (stability of proteins from rates of oxidation) extract folding and binding properties for proteins and protein-ligand complexes. More recently, methods have been developed specifically for probing complex bimolecular interactions involving proteins. For example PLIMSTEX (protein-ligand interactions by mass spectrometry, titration, and H/D exchange) [31] can be used to measure protein-ligand and protein-protein interactions. A modification of PLIMSTEX called SIMSTEX (self-association interactions using mass spectrometry, self-titration and H/D exchange) [30] can also be used to measure self-association of proteins associated with protein aggregation.
The two primary MS-based methods which have been used to extract protein folding energies are SUPREX and SPROX. SUPREX involves the study of H/D exchange of the globally protected amide protons using MALDI HX-MS [25,27]. SPROX is based on chemical oxidation of globally protected methionines using H2O2 [32] Both MALDI and ESI have been used with SPROX [32]. The SUPREX and SPROX approaches are conceptually similar and can be utilized to measure protein stability in complex environments. The application of both of these methods requires a number of assumptions. SUPREX relies on the assumption of EX2-HX kinetics while SPROX assumes that the protein folding equilibrium is not affected by time dependent protein oxidation. In this work we show that SUPREX may be extended from MALDI to ESI. Our ESI method is sufficiently different from SUPREX that we refer to it herein as the kinetic-based method rather than as ESI/SUPREX. By comparison, we also demonstrate the advantages of an equilibrium based approach that samples the equilibrium population of the folded and unfolded states using H/D exchange. We call this approach a protein equilibrium population snapshot or PEPS. This PEPS approach requires fewer assumptions and can be used to extract protein folding energies and mGdHCl values. Using several examples from two types of proteins the ΔGH2O and mGdHCl values obtained using both ESI based approaches (the kinetic-based method and PEPS) are compared to each other and with previously reported values.
2. Experimental and Theory
2.1 Chemicals
The construction of the mutants of staphylococcal nuclease used in this study has been described elsewhere [3,5]. Bovine ubiquitin, sodium hydrogen phosphate, and acetonitrile (ACN) were purchased from Sigma-Aldrich. Trifluoroacetic acid (TFA) was purchased from Halocarbon. Guanidine hydrochloride (GdHCl), omni pure, was purchased from VWR. Sodium phosphate and sodium chloride were purchased from Mallinckrodt. Deuterium oxide (D2O; 99.8% atom D) was purchased from Cambridge Isotope Laboratories. The GdHCl solution (6 M, 100 mM NaCl, 25 mM sodium phosphate, pH 7.0) used in these experiments was prepared carefully to maintain the correct concentration and pH as described previously [5, 6]. H2O and D2O solutions were also prepared using the same buffers described above. All protein samples were dissolved in the H2O buffer to achieve a final protein concentration of about 2 mg/ml. The pH measurements were not adjusted for deuterium. The HPLC mobile phases were 0.1% TFA (A) and 0.1% TFA in ACN (B).
2.2 Instrumentation
The mass spectrometer was a Bruker Esquire 2000 (Billerica, MA) LC ion trap equipped with an electrospray ionization source. It was operated in positive ion mode with a nebulizing gas pressure (N2) of 30 Psi and a drying gas flow of 12 ml/min maintained at 250ºC. The mass spectrometer was optimized at m/z 1000 with low skimmer voltage (instrument default for this mass). The HPLC was a Hewlett Packard (Palo Alto, CA) 1100 series instrument equipped with an autosampler. HPLC (desalting) was accomplished using a Supelco C18 column (4.5 mm × 50 mm, 5 μm) at a flow rate of 0.8 ml/min using a rapid gradient from 5%B–100B% over 3 minutes.
2.3 Kinetic-Based H/D Exchange Method
The ESI kinetic-based experiments, very similar to MALDI based SUPREX, were carried out at room temperature, ~ 25ºC. H/D exchange (wild-type staphylococcal nuclease, a mutant, or ubquitin) was initiated by 10-fold dilution of protein stock solution into a solution made from the D2O buffer, H2O buffer and the 6 M GdHCl stock solution. For staphylococcal nuclease this solution (100 μl) had the desired GdHCl concentration of 0 to 1.5 M and was always 70% D2O v/v. For ubiquitin, D2O had to be adjusted to 60% v/v to achieve higher concentrations of 0 to 2.2 M GdHCl. Mixing was accomplished by vortexing the sample for about 5 seconds. Exchange times (1–120 min) were controlled using the HPLC autosampler which was started immediately on mixing. Samples were loaded into the autosampler tray after mixing, thus slight differences in the time taken to place the vial into the tray did not affect the timing sequence, initiated before vortex mixing. We assume H/D exchange is quenched on injection of 5–10 μl of sample into the acidic mobile phase (with 0.1% TFA) where both the mobile phase and column were kept at 0°C. A 3 minute RP-HPLC separation was used for desalting to improve ESI spectra for the H/D exchanged samples. The resulting spectra of samples corresponding to specific H/D exchange times and GdHCl concentrations were used to obtain folding energies as described in section 2.5 below.
2.4 PEPS HX ESI-MS method
These experiments were similar to the kinetic-based experiments described above with the following differences. The equilibrium protein folded and unfold populations were first established by mixing 5–10 μl of protein stock solution with specific volumes of 6 M GdHCl stock and H2O buffer to achieve final concentrations of between 0 to 2.5 M for staphylococcal nuclease and 0 to 4.2M for ubiquitin in 100 μl total volume. Sufficient time, on the order of 5–10 minutes, was allowed to insure proper equilibration of the native and denatured states after denaturant addition and before the H/D exchange. Then, in contrast to the ESI SUPREX method, only a single (shortest possible) time of H/D exchange was employed to minimize the number of folding/unfolding cycles. In this study we report data for PEPS in separate experiments using the shortest (17 ± 3 s) and longer (45s, and 60 ± 3 s) times for comparison. H/D exchange was again accomplished by a 10 fold dilution of the protein (5 μl) into an H/D exchange buffer (45 μl) identical to the one described in section 2.3. In this experiment the GdHCl was also present in the exchange buffer, in the same concentration as in the protein sample, to avoid dilution and thus maintain constant ionic strength. Because of the higher concentration of GdHCl used with ubiquitin the range of volumes possible for mixing needed to be adjusted, and in this case the v/v ratio for the percentage D2O was maintained at 30%. The total time for exchange was measured in seconds rather than 1–120 min. Because of the very short time frame, the autosampler was not used for MS analysis. Instead 25 μl of sample was injected manually using a Rheodyne injector for HPLC/MS analysis.
2.4 Spectral Data Processing
For the kinetic-based method ΔGH2O and mGdHCl values are derived from C1/2 and t1/2 values. These are the concentration and time where 50% of the maximum number of globally protected amide protons that can be detected in the experiment have exchanged. The PEPS method uses the ratio of closed and open state populations for the calculations. All of these parameters are derived from mass values, changes in mass, or peak intensity differences resulting from controlled H/D exchange. The accuracy of these measurements is dependent on the control of the experimental conditions as well as the ability to obtain accurate mass assignments and or intensity values. Mass values for the protein, denatured protein and H/D exchange products (including both folded and unfolded forms if differentiable) were obtained by deconvolution of ESI spectra using the deconvolution function in the Bruker Data Analysis 3.0 software. The spectra were typically smoothed one time using a 2 point (0.2 m/z) smooth to improve the deconvolution. In the special case of EX2, or in the absence of a denaturant where a single peak results from the deconvolution, the maximum intensity of that peak was taken as the average mass resulting from overall H/D exchange. If two peaks resulted from the deconvolution (EX1, two components resolved) the weighted average of the two peaks was calculated, when needed, using the equation below. This represents the weighted average H/D exchange for the protein overall.
| (1) |
In equation 1, Ii is the intensity detected at m/z value Mi. For abundance values the reported peak intensities resulting from deconvolution were used. This avoids uncertainties in the peak areas (widths) resulting from deconvolution of the spectra.
2.5 Theory, Plotting and Calculation of Folding Energies
There are two widely accepted general mechanisms for H/D exchange called EX1 and EX2 [33]. Both of these generally refer only to exchange of the globally protected amide hydrogens. These exchanges can be detected in the time scale of a typical laboratory experiments. EX1 is defined as the circumstance where a single unfolding event results in simultaneous exchange of most or all of the exchangeable protons within the molecule whereas EX2 exchange occurs when a single folding event leads to very few if any exchanges in the same single unfolding/folding event. Of these two types of exchange, EX1 is more often associated with a higher level of denaturation and EX2 with typical physiological behavior of proteins. EX2 with gradual H/D exchange over many unfolding events results in the observation of a single “population”. This population has a distribution of isotopes and typically a Guassian-like appearance. In an MS experiment, the center of this distribution increases slowly in mass over time. On the other hand, EX1 exchange can lead to two different populations (one exchanged and one not) because each folding event results in a large and relatively well defined mass change. These two populations can be distinguished in a mass spectrometry experiment when the mass change is large enough to resolve and the half-life of the protein folding event is sufficient to allow both populations to be sampled. This explanation is simplified by the assumption of a two state model. More complicated behavior likely occurs in many biological systems. In mass spectrometry experiments the detection of two states would define the minimum but not necessarily the maximum number of states present during protein folding. Most methods that have been developed to access protein folding energies are kinetic-based and assume EX2 kinetics.
The kinetic-based method employed herein is similar to SUPREX [25,27] which measures the hydrogen/deuterium (H/D) exchange reaction of globally protected amide protons in proteins. For proteins with two state equilibrium unfolding behavior, the H/D exchange reaction can be described by equation 2:
| (2) |
where (closedH) is a closed native protein with no deuterium. This state of the protein is H/D exchange incompetent in the sense that only exterior (surface) amide protons can be exchanged. If this state is subjected to a quick H/D exchange, almost no globally protected amide protons get exchanged. On the other hand, the open form of the undeuterated protein (open)H is denatured and more sites are accessible to exchange. This form is H/D exchange competent in the sense that the amide protons which were globally protected (interior) are now exposed. After H/D exchange has occurred there also exists a population which is denatured and deutarated (open)D. Under these circumstances the values kop and kcl represent the rate constants for the opening and closing reactions of the protein (respectively), and kint is the intrinsic exchange rate of unprotected amide protons. Note that there is no reverse arrow between (open)H and (open)D in equation 1 because the reaction is performed in an environment that is predominantly D2O. Using this two state protein folding mechanism, the observed H/D exchange rate constant, kex, can be written as
| (3) |
If kcl ≫ kop and kint, equation (3) reduces to equation (4) when 50% of the globally protected amides protons have exchanged. This circumstance where kcl ≫ kop and kint is the definition of EX2 kinetics [33]. A detailed discussion of the derivation of equation (4) from equation (3) can be found elsewhere [25,27].
| (4) |
Kfapp is the apparent equilibrium folding constant (Kfapp = kcl/kop), t1/2 is the H/D exchange time (for 50% exchange) in minutes and <kint> is the average intrinsic exchange rate of unprotected amide protons and assumed to be a constant. <kint> is pH dependent and approximated to be ~10(pH-5) protons per minute [25, 27,34].
One of the most common methods for the analysis of traditional solvent-induced equilibrium denaturation curves is the linear extrapolation method (LEM) [7,8,35] given by equation (5).
| (5) |
where ΔGapp is -RT lnKfapp, [GdHCl] is the molar GdHCl concentration, mGdHCl is and ΔGH2O is the folding free energy of the protein in the absence of denaturant. When 50% of the globally protected amide protons have exchanged, equation 5 can be re-written (using equation 4) as
| (6) |
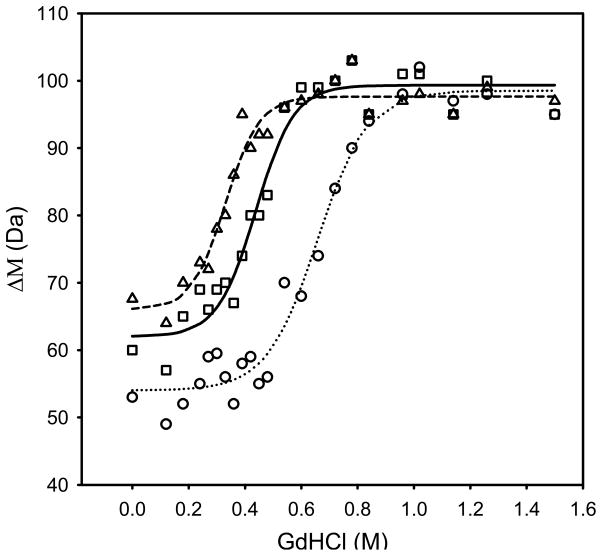
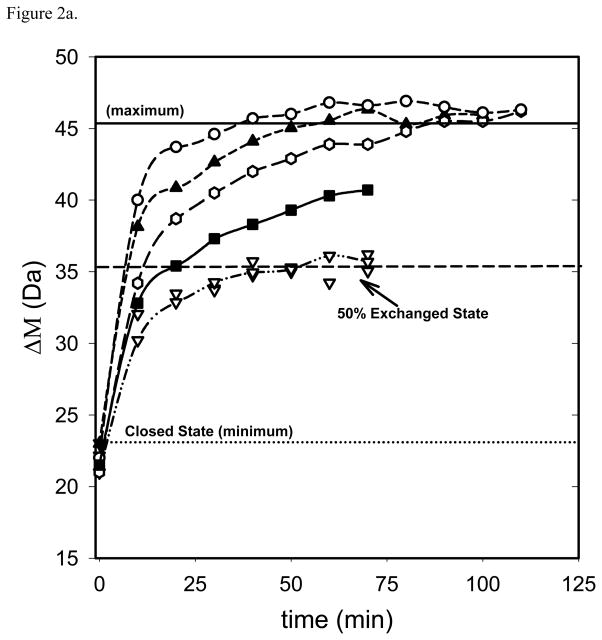
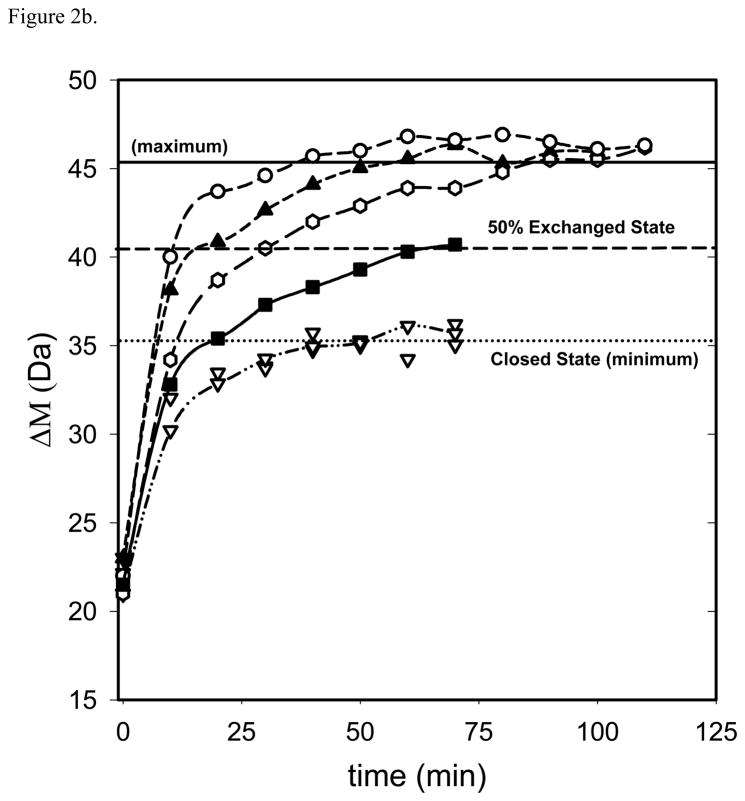
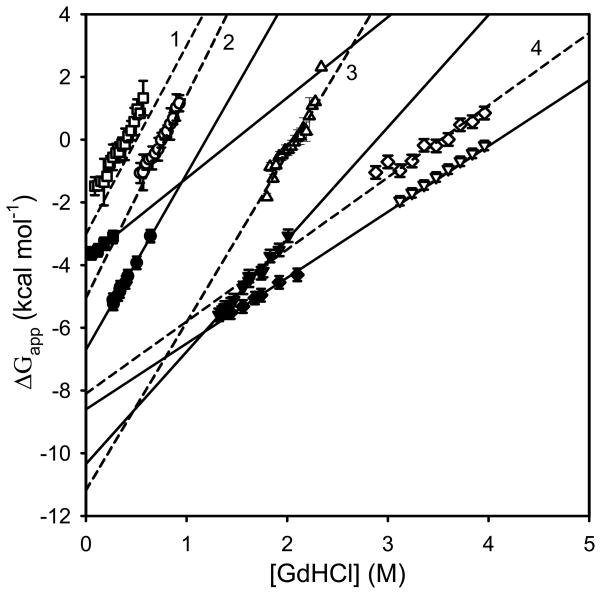
Values of C1/2 for given exchange times (t1/2) can be obtained by utilizing plots of the sort displayed in Figures 1 and 2. In Figure 1, the average mass shift (Δ M) from H/D exchange is plotted as a function of [GdHCl] for a fixed exchange time. C1/2 is determined from the transition mid point by fitting the plots to a sigmoidal curve using regression analysis tools as described elsewhere [25,27]. In Figure 2, ΔM is plotted as a function of time instead of [GdHCl]. Values for C1/2, and t1/2 from these plots can be obtained simply by drawing a horizontal line across the 50% deuteration level as shown in Figure 2a. Here the minimum and maximum values for ΔM are defined as the average value for ΔM with no denaturant (minimum) and the average value for the maximum ΔM change (maximum). The x-axis value at the intersection of individual data curves with the horizontal 50% ΔM line gives the t1/2 value for each concentration. C1/2 and t1/2 values produced by either method can be used with equation 6 to generate standard LEM plots as shown in Figure 3. In the plot, the y axis intercept yields ΔGH2O at zero denaturant concentration and the gradient gives the corresponding mGdHCl values.
Figure 1.
Average mass shift (ΔM) upon H/D exchange as a function of [GdHCl] for wild-type staphylococcal nuclease. Three curves corresponding to exchange times of 1.5 (○), 11 (□), and 19.5 (Δ) min. The average uncertainty associated with the mass shift estimations at different GdHCl concentrations is about ± 2 Da.
Figure 2.
Average mass shift (ΔM) upon H/D exchange as a function of exchange time for ubiquitin. Seven curves correspond to different GdHCl concentrations: 0.00M, 0.48 M, 0.84 M and 1.26 M (▽), 1.56 M (■), 1.76 M (□), 1.92 M (▲) and2.16 M (○). The bottom (dotted) line corresponds to a closed state (minimum exchange); the middle (dashed) line corresponds to 50% exchange and the top (solid) line corresponds to the maximum exchange. In Figure 2b these lines have been adjusted to encompass only denaturation concentration dependent H/D exchange to facilitate assessment of 50% exchange in the denatured (unfolded) protein. The average uncertainty associated with the mass shift estimations at different GdHCl concentrations is about ± 2 Da
Figure 3.
Solvent denaturation plots using the linear extrapolation method (LEM) for three staphylococcal nucleases and ubiquitin obtained from HX ESI-MS kinetic-based method and PEPS HX ESI-MS method compared to literature fluorescence and CD data. For staphylococcal nuclease: open symbols represent the PEPS method and solid symbols represents the kinetic-based HX-MS methods; 23I/25I/66L/72L (Δ); wild type (□), 117G/124L/128A/41I/59A/21K/21N (○); dashed lines (1), (2) and (3) show fluorescence data [5, 6,36]. For ubiquitin (◇) dashed line (4) represents literature NMR data [39] and (▽) literature CD data [29].
The PEPS HX ESI-MS method is different from the kinetic-based method. A partially denatured and briefly exchanged protein is probed by ESI. Ideally two different and distinguishable peaks result from the different extents of H/D exchange of the folded and unfolded states. The intensity values from the discrete peaks in the deconvoluted ESI spectrum are presumed representative of the equilibrium populations of native and denatured states. Similar to the kinetic-based method, PEPS also assumes a two state folding mechanism, as depicted in the equation 7.
| (7) |
H/D exchange is used to obtain the population ratio of the two states at equilibrium as a function of GdHCl concentration and Kapp can then be determined by equation 8 for different denaturant concentrations if it is assumed that the peak intensities correspond approximately to the population values for the two states they are presumed to represent.
| (8) |
In equation 8, In and Id are the intensities of the exchanged native (closed) and exchanged denatured (open) states, respectively, for specific denaturant concentrations which may be directly detected by mass spectrometry if the protein undergoes HX by an EX1 mechanism.
Alternatively mass differences can also be used. For a given [GdHCl] the minimum exchange [ΔMn, no denaturant], maximum exchange [ΔMd, denaturant no longer increases exchange] and the specific exchange for a given concentration [Δ M] gives Kapp values for each denaturant concentration. Here [ΔM] could be the mass change from the single peak resulting when the folded and unfolded states do not give two discrete masses, or the weighted average if they do.
| (9) |
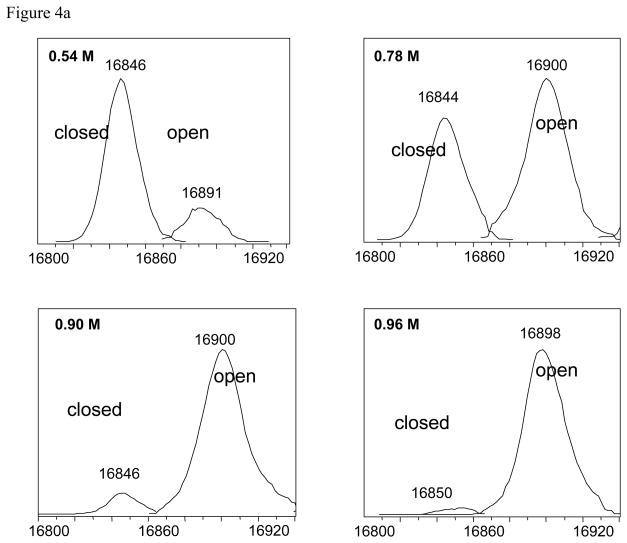
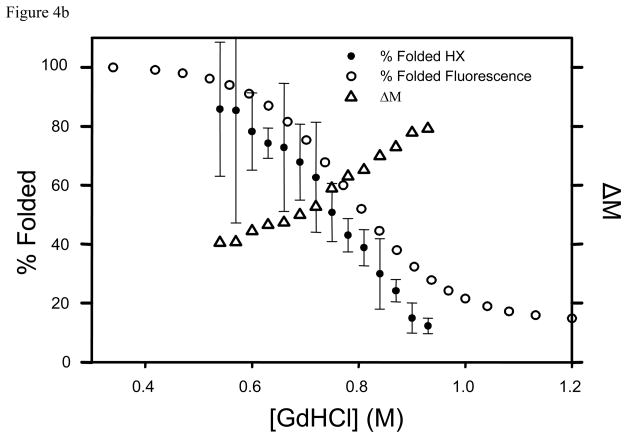
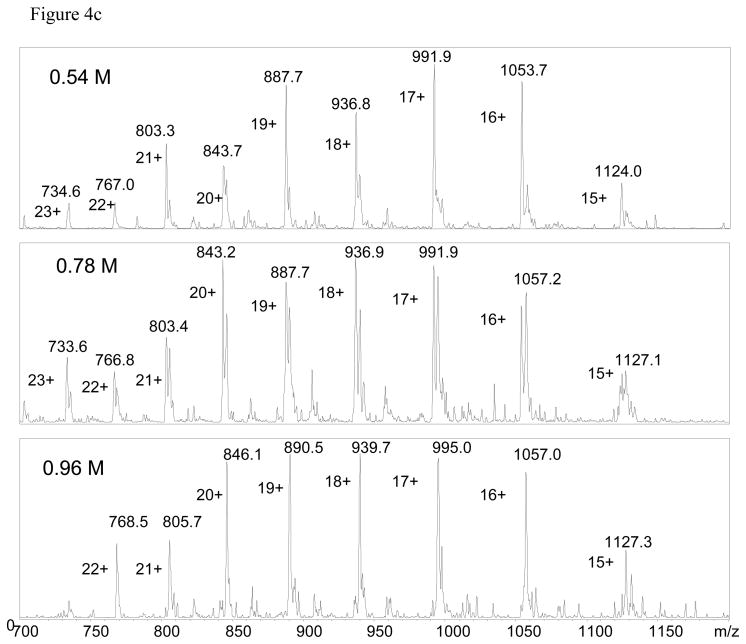
Having both options is important. Ideally, the magnitude of the relative k values for folding and unfolding should not matter. If the HX mechanism is EX2 or the peaks cannot be resolved then a single peak is observed in the mass spectrum and mass differences must be used. For EX1 mechanisms if two states can be observed then the intensity values can be taken directly from the spectra to obtain Kapp. In this case the process is greatly simplified as illustrated using PEPS HX of a staphylococcus nuclease. Low resolution ESI-MS detected two states (folded and unfolded) after H/D exchange as shown in the deconvoluted spectrum. Observation of two discrete peaks resulting from H/D exchange of a single protein is indicative of EX1 conditions. The different populations of the two states are clearly evident in Figure 4a for processed deconvoluted data and unprocessed raw data in Figure 4c for different denaturant concentrations. In this example, Kapp for a given [GdHCl] is simply taken as the ratio of In and Id. The percentage of folded protein calculated this way is compared to the percentage of folded protein under similar conditions sample using fluorescence in Figure 4b.
Figure 4.
Staphylococcal nuclease wild type by PEPS method. The top panel (a) shows variations in peak intensities corresponding to the deuterated open and closed forms as a function of GdHCl concentration. The middle panel (b) shows Δ M (Δ) {right side y-axis}, the percent of folded protein (●) calculated using Δ M, and the percent of folded protein from fluorescence data (○) [5,6,36]. All are plotted as a function of GdHCl concentration. The bottom panel (c) shows the ESI mass spectra which were deconvoluted to produce the data in panel (a).
3. Results and Discussion
Data obtained from two HX-ESI-MS based techniques, a kinetic-based approach and PEPS method, are presented. The ΔGH2O and mGdHCl values are compared to the previously reported fluorescence [3,5,6,36], and NMR/CD [29] values for staphylococcal nuclease and ubiqutin. These two proteins have been extensively studied as models in protein folding studies [5,37,38,39]. Moreover these two proteins follow different HX mechanisms clearly follows EX1 HX kinetics [40] as shown in Figure 4 (distinct populations) whereas ubiquitin reportedly follows EX2 HX kinetics even at high denaturant concentrations [29]. Most other HX methods require assumptions or prior knowledge of the proteins folding characteristics [25,27], including exchange mechanisms. The PEPS approach presented herein is different in that regard, and should provide reasonably accurate folding energies for proteins exhibiting either EX1 or EX2 mechanisms.
3.1 Kinetic-Based Method
Figure 1 shows three stability curves for a staphylococcal nuclease wild type obtained at different times (1.5, 11 and 19.5 minutes). The individual points on these plots correspond to the weighted average mass shift (ΔM) of the protein upon H/D exchange for each given time and denaturant concentration. A value referred to as the C1/2 for each curve can be obtained by finding the concentration of GdHCl at which the mass change is half way between the minimum and maximum values for each curve. This can be accomplished either by estimation or curve fitting. Typically sigmoid curves are fitted. The mass increase resulting from H/D exchange reflects the time spent in the open configuration. For longer H/D exchange times and the increasing numbers of open/closed cycles, the probability of any given globally protected amide proton being exchanged increases. Likewise increases in the denaturant concentration increase the equilibrium population of the open form and thereby also increase the accessibility of protected amide protons. This is evident from Figure 1, where the C1/2 value at which 50% of the globally protected amide protons were exchanged decreased with increasing H/D exchange time. Equation 6 relates the constants (T, kint and R) and variables (t1/2 and C1/2) to folding energies. Thus the C1/2 values were used to prepare ΔGapp vs [GdHCl] plots for 14 staphylococcal nuclease mutants giving rise to ΔGH2O at zero denaturant concentration and mGdHCl values listed in Table 1.
Table 1.
ΔGH2O and mGdHCl values obtained for staphylococcal nucleases at room temperature ~25°C using the HX ESI-MS kinetic-based method. ΔGH2O and mGdHCl values from fluorescence studies [5,6,36] are at 20°C unless otherwise stated. ΔG and m units are kcal mol−1 and kcal mol−1 M−1. Estimated average uncertainty for the ΔG is ~0.3 kcal mol−1 and for m is 0.1 kcal mol−1 M−1.
| Staphylococcal Nuclease | Δ GH2O (MS) | ΔGH2O (Fluoresence) | mGdHCl (MS) | mGdHCl (Fluoresence) |
|---|---|---|---|---|
| Wild Type | 6.7 | 5.0* | 5.6 | 6.5* |
| 23L/25I/66L/72V | 3.8 | 2.8 | 3.0 | 6.4 |
| 23I/25I/66L/72L | 4.1 | 2.7 | 3.9 | 6.9 |
| 23I/25V/66L/72L | 3.8 | 2.8 | 2.6 | 6.2 |
| 23I/25V/66I/72V | 3.5 | 2.4 | 1.9 | 6.4 |
| 23L/25V/66L/72V | 3.9 | 3.0 | 2.2 | 6.9 |
| 23L/25I/66L/72L | 4.1 | 3.0 | 2.5 | 5.9 |
| 23I/25I/66I/72V | 3.7 | 2.3 | 3.1 | 6.2 |
| 23I/25I/66L/72V | 4.0 | 2.8 | 2.4 | 6.0 |
| 66I/72V/92V/99L | 4.5 | 3.7 | 3.2 | 6.9 |
| 66I/72L/92V/99I | 4.6 | 4.0 | 3.0 | 6.7 |
| 66I/72V/92L/99L | 4.4 | 2.8 | 2.9 | 6.7 |
| 66I/72V/92L/99I | 4.5 | 3.4 | 2.5 | 6.7 |
| D21N | 7.0 | 6.6 | 4.8 | 6.3 |
| 117G/124L/128A/41I/59A/21K/21N | 10.4 | 11.0 | 3.6 | 5.3 |
measured at 25°C
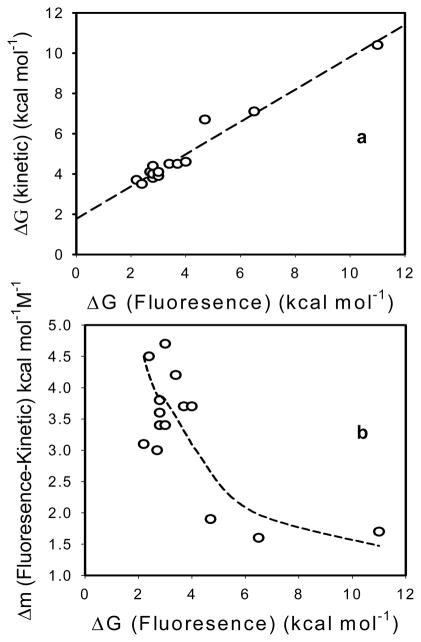
Three examples are also plotted in Figure 3 along with literature data from fluorescence studies of the same mutants [5,6,36]. Overall the estimated ΔGH2O values for folding energies of the staphylococcal nucleases obtained using the kinetic-based method showed a clear correlation with the values obtained from tryptophan fluorescence studies, even though the absolute values were consistently high (Figure 5a). It should be noted that there are minor differences in the temperatures for the MS-based data and the fluorescence data, but these temperature differences are not large enough to account for the observed differences in ΔGH2O. Similarly, mGdHCl values derived from mass changes are significantly lower than those from fluorescence but seem to agree better for more stable proteins as clearly seen when the difference between fluorescence and kinetic-based mGdHCl values data (Δm) is plotted as a function of protein folding energies in Figure 5b.
Figure 5.
ΔGH2O by fluorescence verses (a) ΔGH2O by H/D kinetic-based method or (b) Δm {m by flurorescence- m by H/D kinetic-based method} for 14 staphylococcal nucleases. X-axis values taken from references 5,6,36. Y-axis values derived from references (m by fluorescence) and this paper (m and ΔGH2O by H/D kinetic-based method). Average uncertainty associated with ΔGH2O is 0.3 kcal mol−1 and for (Δm) is 0.1 kcal mol−1 M−1.
A ΔGapp vs [GdHCl] plot for ubiquitin, also generated accordingly using the kinetic-based method, is presented in Figure 3 along with a plot of literature (NMR and CD) values [29,39]. A different plotting approach is shown in Figure 2. The advantage of using the method in Figure 2 is that some specific behaviors (Figure 2b) that affect the derived ΔGH2O and mGdHCl values and are indicative of the kinetics of the experiment are readily detected although they are not otherwise obvious. For example, Figure 2 shows nearly identical behavior for no denaturant added and the three lowest concentrations of denaturant added (up to 1.2M) in the H/D exchange for ubiquitin. This holds true for times up to 120 min. The lack of denaturant concentration dependence suggests that this plateau corresponds to a closed state where exchange occurs but the denaturant has had no effect on protein folding. Thus in figure 2b, we have redefined the closed state “minimum” exchange by moving the dotted horizontal line labeled “minimum” vertically to match the beginning of measurable denaturant concentration dependent H/D exchange. By chance this state would correspond to about 50% of the overall H/D exchange observed in this experiment as noted in Figure 2a, but is about the same exchange that would have occurred without any denaturant at all. Only addition of GdHCl above 1.2 M causes proportional increases in H/D exchange until a maximum value is reached (with no subsequent change). This is the same maximum value defined in figure 2a. This state at the maximum concentration corresponds to the state where all the globally protected amide protons are fully exchanged. We propose that the correct closed state which has minimum H/D exchange capacity should be taken as the lower (dotted) line in Figure 2b rather than the arbitrary level selected (dotted line) in Figure 2a. Using the approach depicted in Figure 2b the ΔGH2O and mGdHCl from HX-ESI-MS kinetic-based method for ubiquitin agree with the CD and the SUPREX values [29], whereas the other plotting approach resulted in 2.0 kcal mol−1 lower values (Table 3, Figure 3).
Table 3.
ΔGH2O and mGdHCl values obtained for ubiqutin at room temperature ~25°C using HX ESI-MS kinetic-based and PEPS methods compared to CD, NMR [39], SUPREX and SPROX [32] literature values. Units of ΔGH2O and mGdHCl units are kcal mol−1 and kcal mol−1 M−1 respectively.
| Method | ΔGH2O | mGdHCl |
|---|---|---|
| NMR data | −8.1 | 2.3 |
| SUPREX data | −8.7 ± 0.2 | 2.1 ± 0.2 |
| SPROX-ESI | −8.0 ± 0.3 | 2.1 ± 0.1 |
| SOROX-MALDI | 6.3 ± 1.0 | 1.6 ± 0.3 |
| CD data | −8.5 ± 0.3 | 2.1 ± 0.2 |
| HX-ESI-MS-Kinetic-Based1 | −6.4 or −8.4 ± 0.2 | 2.0 ± 0.2 |
| PEPS-HX-ESI-MS | −8.1 ± 0.3 | 2.3 ± 0.3 |
3.2 PEPS HX-ESI-MS Method
The main differences between these kinetic-based and PEPS methods are that (a) the denaturant is mixed with, and allowed to equilibrate with the protein before H/D exchange rather than added at the same time as the H/D exchange mixture, and (b) the protein H/D exchange is quenched more rapidly (seconds rather then minutes) after exposure to D2O. This brief exchange is done at different denaturant concentrations to reproducibly sample different concentrations of the open and closed forms of the protein. A brief exposure limits the number of cycles of protein folding and unfolding and thereby should label primarily the amide hydrogens which are highly solvent accessible. If this can be achieved then, at the limit of zero time the extent of H/D exchange (if it could occur instantaneously) could allow the open and closed populations to be monitored. For short exchange times and only weakly denatured states, increased GdHCl concentration results in a greater extent of unfolded protein compared to folded protein. While about the same number of amide protons are exchangeable in the unfolded state (the mass difference between the folded and unfolded state changes very little in figure 4a) the number of these accessible protons that exchange increases as shown in Figure 4a. For exchange times of 45 and 60 seconds similar results were observed. The calculated values deviated more from the reported values at longer times, as expected. However, at the longer exchange times the ΔGH2O values decreased by about 10% compared to the values for 17 seconds (data not shown). Thus this approach might not work for exchange times longer than 60 seconds.
Thus, irrespective of the HX behavior (EX1 or EX2), the percentage of folded protein, ΔGH2O mGdHCl and can be calculated. For EX1 using equation 8 (In/Id) and ΔGapp = −RT lnKfapp are used. For EX2 only one m/z value will be detected for all forms (closed and open) and ΔMs must be used rather than In/Id and equation 8. For EX2 equations 9 and 5 are used with graphical plotting. Within experimental error (ΔGH2O is ~0.3 kcal mol− and for mGdHCl it is 0.5 kcal mol−1 M−1) either approach gives the same value (data not shown). The ΔGapp values thus obtained were plotted as a function of [GdHCl] and the results for the three staphylococcal nuclease proteins and ubiquitin are shown in the Figure 3.
Using the PEPS approach the ΔGH2O and mGdHCl values for the three staphylococcal nuclease proteins for which data are currently available (the wild type, 23I/25V/66L/72L, and 117G/124L/128A/41I/59A/21K/21N) are in much better agreement with the fluorescence values than values derived from the kinetic-based method, as seen in Figure 3 and Table 2. This is because this protein exchanges by an EX1 mechanism [18,40]. The experimental data (open symbols) almost overlay the literature values (dash lines) in the Figure 3. Small differences might be explained by different experimental conditions. For example, for 23I/25V/66L/72L, the fluorescence values in the Figure 3 and Table 2 were obtained at 20°C, whereas for other two staphylococcal proteins fluorescence data was obtained at 25°C. All MS experiments were done at room temperature.
Table 2.
ΔGH2O and mGdHCl values obtained for staphylococcal nucleases at room temperature ~25°C using the PEPS HX ESI-MS method compared to fluorescence values [5, 6,36]. Units of ΔGH2O and mGdHCl units are kcal mol− and kcal mol−1 M−1 respectively. Estimated average uncertainty for the ΔGH2O is ~0.3 kcal/mol and for mGdHCl it is 0.1 kcal mol−1 M−1.
| Staphylococcal Nuclease | ΔGH2O (MS) | ΔGH2O (Fluoresence) | mGdHCl(MS) | mGdHCl(Fluoresence) |
|---|---|---|---|---|
| Wild Type | 4.7 | 5.0* | 6.3 | 6.5* |
| 23I/25I/66L/72L | 2.4 | 2.7 | 6.5 | 6.9 |
| 117G/124L/128A/41I/59A/21K/21N | 11.1 | 11.0 | 5.4 | 5.3 |
measured at 25°C
Using the PEPS approach the ΔGH2O and mGdHCl values for the ubiquitin are also in excellent agreement with the NMR [29,39] values as seen in Figure 3 and Table 3. The experimental data (open diamond symbol) almost overlay with literature values (dash line 4) in the Figure 3. Even though there are some differences among CD, NMR, SUPREX, SPROX-ESI and values obtained from the two new HX-ESI-MS methods, those differences are clearly within the experimental error, Table 3. In this case, with ubiquitin, where EX2 exchange conditions apply, the kinetic-based method, and PEPS give nearly the same value.
4. Conclusions
Estimated ΔGH2O values for folding energies of 14 staphylococcal mutants obtained using an HX ESI-MS kinetic-based method showed a clear correlation with the values obtained from tryptophan fluorescence studies, even though the absolute values were consistently high. The difference is attributed to EX1 exchange where some of the assumptions underlying the kinetic-based method (and SUPREX) are not valid. Even though EX1 HX kinetics were in effect, we still produced linear LEM plots using the equation 5 for all the staphylococcal nucleases. Thus, any notion that it is possible to judge the validity of the LEM approach based solely on the ability to obtain a straight line plot should be reconsidered.
Values obtained in kinetic-based experiments using ubiquitin showed better results and also that the results can be further improved by consideration of only the denaturant concentration dependent H/D exchange. The PEPS method produced ΔGH2O and mGdHCl values that agreed well with fluorescence, NMR or CD values for three staphylococcal proteins and ubiquitin. The three staphylococcal proteins selected for study had low, medium and high folding energies and EX1 HX kinetics. All three gave results almost identical with literature values showing PEPS ability to measure folding energies from −2 to −11 kcal mol-1 and under typically intractable EX1 conditions. Ubiquitin, which undergoes EX2 HX kinetics, also gave PEPS derived values for folding energies that were in good agreement with literature values. Based on a subset of proteins investigated herein, the PEPS method appears to provide ΔGH2O and mGdHCl values consistent with fluorescence, NMR, and CD studies and requires fewer assumptions. For EX2 exchange both the kinetic-based method and the PEPS method should be valid.
It is not necessary to speculate about whether or not exchange is EX1 or EX2. ESI-MS can readily detect EX1 exchange where both the open and closed exchanged states can be detected. The HX ESI-MS kinetic-based method, like SUPREX relies on the assumption of a specific HX mechanism, namely EX2. Thus detection of EX1 kinetics is thus important for evaluation of H/D exchange data. Because of the ability to operate under both EX1 and EX2 conditions, the applicability of the PEPS method appears broader than the kinetic-based method. When two populations can be detected in spectra the procedure is extremely simple. Thus we also believe that this approach offers advantages in terms of speed and simplicity. We expect that this approach can be easily adopted to obtain protein-ligand and protein-protein interaction energies.
The results presented herein show that the two new techniques, especially PEPS, have advantages over other methods. However, it is equally clear that there is still room for improvement and additional studies are already planned. Two of the most obvious areas that should be fruitful are to gain better control over temperature and time. The best thermodynamic analysis is possible with accurate and precise control of temperature. We have done these experiments at room temperature with less than optimal control over temperature. Even if temperature was more precisely controlled, it would still be desirable to collect data at different temperatures, and such studies are underway. Second, the mixing and, in the equilibrium method, the injections are done manually. This obviously introduces a degree of variability in the timing of the experiments. Further, manual methods have a longer dead time than automated methods. Therefore our future efforts will also focus on automation of the mixing and injection process. Finally, we are well aware that the results for the equilibrium method are dependent upon the time that labeling is allowed to proceed and that the shortest time that allows labeling of the open configuration should give the most accurate results. Our results using PEPS at 17s are already in very good agreement with a limited number of previously characterized proteins, but we believe additional studies, better temperature control and automation will improve the accuracy and precision of these measurements.
Footnotes
Publisher's Disclaimer: This is a PDF file of an unedited manuscript that has been accepted for publication. As a service to our customers we are providing this early version of the manuscript. The manuscript will undergo copyediting, typesetting, and review of the resulting proof before it is published in its final citable form. Please note that during the production process errors may be discovered which could affect the content, and all legal disclaimers that apply to the journal pertain.
References
- 1.Dobson CM. Trends Biochem Sci. 1999;24:329. doi: 10.1016/s0968-0004(99)01445-0. [DOI] [PubMed] [Google Scholar]
- 2.Beijer FH, Kooijman H, Spek AL, Sijbesma RP, Angew EWM. Chem Int Ed. 1998;37:75. [Google Scholar]
- 3.Chen J, Stites WE. Biochemistry. 2001;40:14012. doi: 10.1021/bi011269d. [DOI] [PubMed] [Google Scholar]
- 4.Maki K, Cheng H, Dolgikh DA, Roder H. J Mol Bio. 2007;368:244. doi: 10.1016/j.jmb.2007.02.006. [DOI] [PMC free article] [PubMed] [Google Scholar]
- 5.Byrne MP, Stites WE. 2007;125:490. doi: 10.1016/j.bpc.2006.10.014. [DOI] [PMC free article] [PubMed] [Google Scholar]
- 6.Chen J, Stites WE. Biochemistry. 2001;40:14015. [Google Scholar]
- 7.Schellman JA. Solvent denaturation. Biopolymers. 1978;17:1305–1322. doi: 10.1002/bip.360260408. [DOI] [PubMed] [Google Scholar]
- 8.Schellman JA. The thermodynamic stability of proteins. Ann Rev Biophys Chem. 1987;16:115–137. doi: 10.1146/annurev.bb.16.060187.000555. [DOI] [PubMed] [Google Scholar]
- 9.Maki K, Cheng H, Dolgikh DA, Shastry MCR, Roder H. J Mol Bio. 2004;338:383. doi: 10.1016/j.jmb.2004.02.044. [DOI] [PubMed] [Google Scholar]
- 10.Brandts JF, Lin LN. Biochemistry. 1990;29:6927. doi: 10.1021/bi00481a024. [DOI] [PubMed] [Google Scholar]
- 11.Hill JJ, Royer CA. Methods Enzymol. 1997;278:390. doi: 10.1016/s0076-6879(97)78021-2. [DOI] [PubMed] [Google Scholar]
- 12.Sigurskjold BW. Anal Biochem. 2000;277:260. doi: 10.1006/abio.1999.4402. [DOI] [PubMed] [Google Scholar]
- 13.Straume M, Freire E. Anal Biochem. 1992;203:259. doi: 10.1016/0003-2697(92)90311-t. [DOI] [PubMed] [Google Scholar]
- 14.White A. Biochem J. 1959;71:217. doi: 10.1042/bj0710217. [DOI] [PMC free article] [PubMed] [Google Scholar]
- 15.Chen E, Wood MJ, Fink AL, Kliger DS. Biochemistry. 1998;37:5589. doi: 10.1021/bi972369f. [DOI] [PubMed] [Google Scholar]
- 16.Kim Peter S, Baldwin Robert L. An~ Rev Biochem. 1982;51:459–89. doi: 10.1146/annurev.bi.51.070182.002331. [DOI] [PubMed] [Google Scholar]
- 17.Englander SW, Sosnic TR, Englander JJ, Mayne L. Curr Opin Struct Biol. 1996;6:18. doi: 10.1016/s0959-440x(96)80090-x. [DOI] [PMC free article] [PubMed] [Google Scholar]
- 18.Englander W. J Am Soc Mass Spectrom. 2006;17:1481. doi: 10.1016/j.jasms.2006.06.006. [DOI] [PMC free article] [PubMed] [Google Scholar]
- 19.Williams JG, Tomer KB, Hioe CE, Zolla-Pazner S. J Am Soc Mass Spectrom. 2006;17:1560. doi: 10.1016/j.jasms.2006.06.011. [DOI] [PubMed] [Google Scholar]
- 20.Roulhac PL, Powell KD, Dhungana S, Weaver KD, Mietzner TA, Crumbliss AL, Fitzgerald MC. Biochemistry. 2004;43:15767. doi: 10.1021/bi0481848. [DOI] [PubMed] [Google Scholar]
- 21.Williams JC, Roulhac PL, Roy AG, Vallee RB, Fitzgerald MC, Hendrickson WA. Proc Natl Acad Sci U S A. 2007;104:10028. doi: 10.1073/pnas.0703614104. [DOI] [PMC free article] [PubMed] [Google Scholar]
- 22.Tang L, Hopper ED, Tong Y, Sadowsky JD, Peterson KJ, Gellman SH, Fitzgerald MC. Anal Chem. 2007;79:5869. doi: 10.1021/ac0700777. [DOI] [PubMed] [Google Scholar]
- 23.Xiao H, Kaltashov IA, Eyles SJ. J Am Soc, Mass Spectrom. 2003;14:506. doi: 10.1016/S1044-0305(03)00135-1. [DOI] [PubMed] [Google Scholar]
- 24.Zhu MM, Rempel DL, Du Z, Gross ML. J Am Chem Soc. 2003;125:5252. doi: 10.1021/ja029460d. [DOI] [PubMed] [Google Scholar]
- 25.Ghaemmaghami S, Fitzgerald MC, Oas TG. Proc Natl Acad Sci USA. 2000;97:8296. doi: 10.1073/pnas.140111397. [DOI] [PMC free article] [PubMed] [Google Scholar]
- 26.Powell KD, Ghaemmaghami S, Wang MZ, Ma L, Oas TG, Fitzgerald MC. J Am Chem Soc. 2002;124:10256. doi: 10.1021/ja026574g. [DOI] [PubMed] [Google Scholar]
- 27.Powell KD, Fitzgerald MC. Biochemistry. 2003;42:4962. doi: 10.1021/bi034096w. [DOI] [PubMed] [Google Scholar]
- 28.Wani AH, Udgaonkar JB. Biochemistry. 2006;45:11226. doi: 10.1021/bi060647h. [DOI] [PubMed] [Google Scholar]
- 29.Dai SY, Fitzgerald MC. J Am Soc Mass Spectrom. 2006;17:1535. doi: 10.1016/j.jasms.2006.06.025. [DOI] [PubMed] [Google Scholar]
- 30.Chitta RK, Rempel DL, Grayson MA, Remsen EE, Gross ML. J Am Soc Mass Spectrom. 2006;17:1526. doi: 10.1016/j.jasms.2006.08.004. [DOI] [PubMed] [Google Scholar]
- 31.Sperry JB, Shi X, Rempel DL, Nishimura Y, Akashi S, Gross ML. Biochemistry. 2008;47:1797. doi: 10.1021/bi702037p. [DOI] [PubMed] [Google Scholar]
- 32.Graham MW, Liangjie T, Fitzgerald MC. Anal Chem. 2008;80:4175. doi: 10.1021/ac702610a. [DOI] [PubMed] [Google Scholar]
- 33.Weis DD, Wales TE, Engen JR, Hotchko M, Eyck LFT. J Am Soc Mass Spectrom. 2006;17:1498. doi: 10.1016/j.jasms.2006.05.014. [DOI] [PubMed] [Google Scholar]
- 34.Bai Y, Miline JS, Englander SW. Proteins. 1993;17:75. doi: 10.1002/prot.340170110. [DOI] [PMC free article] [PubMed] [Google Scholar]
- 35.Pace CN, Shaw KL. Linear extrapolation method of analyzing solvent denaturation curves. Proteins. 2000;(Suppl 4):1–7. doi: 10.1002/1097-0134(2000)41:4+<1::aid-prot10>3.3.co;2-u. [DOI] [PubMed] [Google Scholar]
- 36.Chen JM, Lu ZQ, Sakon J, Stites WE. J Mol Bio. 2000;303:125. doi: 10.1006/jmbi.2000.4140. [DOI] [PubMed] [Google Scholar]
- 37.Went HM, Benitez-Cardoza CG, Jackson SE. FEBS Letters. 2004;567:333. doi: 10.1016/j.febslet.2004.04.089. [DOI] [PubMed] [Google Scholar]
- 38.Crespo MD, Simpson ER, Searle MS. J Mol Biol. 2006;360:1053–1066. doi: 10.1016/j.jmb.2006.05.061. [DOI] [PubMed] [Google Scholar]
- 39.Sivaraman T, Arrington CB, Robertson AD. Nat Struct Biol. 2001;8:331. doi: 10.1038/86208. [DOI] [PubMed] [Google Scholar]
- 40.Bédard S, Mayne LC, Peterson RW, Wand AJ, Englander SW. J Mol Biol. 2008;376:1142. doi: 10.1016/j.jmb.2007.12.020. [DOI] [PMC free article] [PubMed] [Google Scholar]


