Abstract
Background
The aspartate aminotransferase-to-platelet ratio index (APRI), a tool with limited expense and widespread availability, is a promising noninvasive alternative to liver biopsy for detecting hepatic fibrosis. The objective of this study was to systematically review the performance of the APRI in predicting significant fibrosis and cirrhosis in hepatitis B-related fibrosis.
Methods
Areas under summary receiver operating characteristic curves (AUROC), sensitivity and specificity were used to examine the accuracy of the APRI for the diagnosis of hepatitis B-related significant fibrosis and cirrhosis. Heterogeneity was explored using meta-regression.
Results
Nine studies were included in this meta-analysis (n = 1,798). Prevalence of significant fibrosis and cirrhosis were 53.1% and 13.5%, respectively. The summary AUCs of the APRI for significant fibrosis and cirrhosis were 0.79 and 0.75, respectively. For significant fibrosis, an APRI threshold of 0.5 was 84% sensitive and 41% specific. At the cutoff of 1.5, the summary sensitivity and specificity were 49% and 84%, respectively. For cirrhosis, an APRI threshold of 1.0-1.5 was 54% sensitive and 78% specific. At the cutoff of 2.0, the summary sensitivity and specificity were 28% and 87%, respectively. Meta-regression analysis indicated that the APRI accuracy for both significant fibrosis and cirrhosis was affected by histological classification systems, but not influenced by the interval between Biopsy & APRI or blind biopsy.
Conclusion
Our meta-analysis suggests that APRI show limited value in identifying hepatitis B-related significant fibrosis and cirrhosis.
Keywords: APRI, HBV, liver fibrosis, diagnostic accuracy, meta-analysis
Background
Chronic hepatitis B virus (HBV), with which more than 400 million people are infected over the world, causes a worldwide health problem. It is the most common cause of acute and chronic liver disease worldwide, eventually progressing from fibrosis to cirrhosis and/or hepatocellular carcinoma [1]. It is well known that the exact staging of liver fibrosis is crucial for the therapeutic decision and assessing of the prognosis of CHB patients. Currently, liver biopsy, the gold standard, is limited by invasiveness, complications, sampling error, variability in pathological interpretation, and the reluctance of patients to undergo repeated biopsies to monitor disease progression [2,3], and 0.2-2% morbidity rate [4,5]. Because of these limitations, noninvasive measures have been examined by numerous studies to grade liver fibrosis. The aspartate aminotransferase-to-platelet ratio index (APRI) was first reported and used to identify patients with HCV-related hepatic fibrosis by Wai and his colleague in 2003 [6]. This index has the advantage of including only 2 inexpensive laboratory tests, which are performed routinely in all patients. The APRI has shown great value in predicting HCV-related fibrosis. So far, there have been several researches conducted to assess the APRI for predicting the fibrosis stage of HBV patients, and some of the existing researches are controversial. The objective of this study was to systematically review the diagnostic accuracy of the APRI for the prediction of significant fibrosis and cirrhosis in hepatitis B-related fibrosis.
Methods
Search Strategy
The objective of our search was to identify published manuscripts of studies examining the APRI for the prediction of HBV-related fibrosis. An electronic search, without language limitations, was completed on MEDLINE, EMBASE, and China National Knowledge Infrastructure (CNKI) including the following terms: APRI, AST, platelet, hepatitis B, AST-to-platelet ratio index, and fibrosis markers (01/2003-03/2011). Additional studies were identified via a manual search of the reference lists of relevant studies. Studies were selected if they met the following inclusion criteria:
(1) The study evaluated the performance of the APRI for the prediction of fibrosis in HBV-infected patients. Studies including patients with other causes of liver disease were included if data for HBV-infected patients could be extracted.
(2) Liver biopsy was used as the reference standard for assessing fibrosis. According to METAVIR or comparable systems, they classified the fibrosis stages F ≥ 2, F ≥ 4; the Ishak system was F ≥ 3, F ≥ 5.
(3) In order to calculate the indexes (sensitivity, specificity, positive predictive value and negative predictive value) of each cut-off point, data could be extracted to allow the construction of at least one 2 × 2 table of test performance.
(4) The study included more than 40 patients. Smaller studies were excluded because of poor reliability.
Data Abstraction
Two reviewers (JIN and LIN) independently evaluated the study eligibility, graded quality, and extracted outcome data. Disagreements were resolved by consensus. To assess the methodological quality of the studies included in the meta-analysis, the Quality Assessment of Diagnostic Accuracy Studies score was used [7,8].
The primary outcome was the identification of significant fibrosis, defined as METAVIR [9], Batts and Ludwig [10], or Scheuer [11] stages F2 through F4 or Ishak stages F3 through F6 [12]. We also examined the identification of cirrhosis (METAVIR, Batts and Ludwig, or Scheuer F4, or Ishak F5-6).
Data Synthesis and Analysis
For each test threshold and outcome, we tabulated the data in 2 × 2 tables to count the sensitivity and specificity. In view of previous study's primary thresholds of 0.5 and1.5 for significant fibrosis and 1.0-1.5 and 2.0 for cirrhosis, we examined the areas under summary receiver operating characteristic (SROC) curves, the summary sensitivities and specificities to provide the summary measures of test performance across all tests and these thresholds. We also calculated Q·(which is defined by the point where sensitivity and specificity is equal, and is the best tool to reflect the diagnosis value)to assess the diagnostic accuracy and used Random effects meta-regression [13] to examine the impact of the following factors on identifying significant fibrosis: (a) interval between Biopsy & APRI(≤ 1 week or other); (b) histopathological classification systems (METAVIR, or Scheuer, Ishak, Batts and Ludwig); (c) blind biopsy (yes vs. no). All the data were analyzed in the Meta-Disc software (version 1.4).
Results
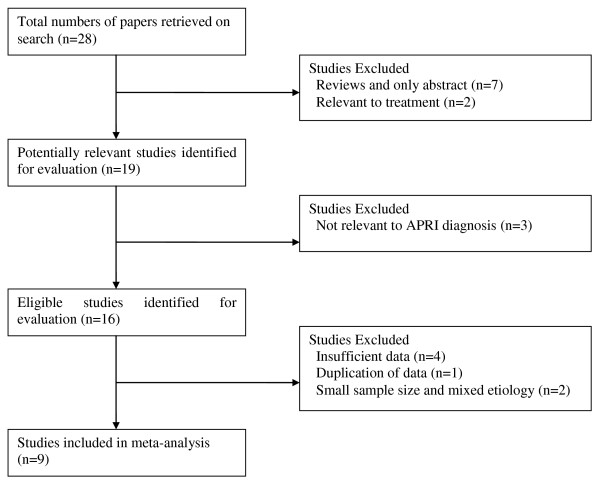
Sixteen studies were identified that described the APRI in patients with chronic hepatitis B (Figure 1). Ultimately, 7 studies were excluded for insufficient data (n = 4) [14-17], duplication of data (n = 1) [18], small sample size or any other cause of chronic liver disease (n = 2) [19,20]. Thus, our final data set for the meta- analysis included 9 studies (Table 1) [21-29].
Figure 1.
Flow chart of article selection.
Table 1.
Characteristics of the Included Studies
| Author, Year, Country | Study/center Description |
N | Interval Between Biopsy & APRI |
Median/Mean Age, (% male) |
Etiology | Liver Biopsy Description |
Prevalence Significant Fibrosis (Cirrhosis) |
QUADAS Score |
|---|---|---|---|---|---|---|---|---|
| Chrysanthosa,2006, Greece [31] |
Retrospective 2 centers |
205 | same day | 51 ± 13(74.6%) | HBV | ≥ 1.5 cm | 42.33%(23.11%) | 14 |
| Liu Hongbo,2007, China [33] |
Retrospective 5 centers |
444 | ≤ 1 week | Training group30(71%) Validation group28(79%) |
HBV | ≥ 1.0 cm | 30.18%(4.50%) | 14 |
| Giada Sebastiani, 2007, Italy [10] |
Retrospective 2 centers |
110 | same day | 42.6 ± 11.3(72.7%) | HBV | ≥ 1.5 cm | 68.20%(20%) | 14 |
| Beom Kyung Kim 2007, Korea [35] |
Retrospective 6 centers |
346 | same time | 34 ± 14(85.3%) | HBV | 4 mm | 75.4%(22.8%) | 14 |
| W.G. Shin,2008, Korea [32] |
Retrospective 2 centers |
264 | same time | 24(87.1%) | HBV | 17 mm | 53.4%(3.4%) | 14 |
| ChenSheng, Lin 2008, China [34] |
Retrospective 3 centers |
48 | Unclear | 60.4 ± 11.3(74.2%) | HBV | Unclear | 21.70%(40.20%) | 12 |
| Ruidan Zheng, 2008, China [36] |
Retrospective 3 centers |
131 | ≤ 1 week | 34(84.333%) | HBV | ≥ 1.0 cm | 55.126%(8.897%) | 14 |
| Zhongsheng jiang 2008, China [37] |
Retrospective 1 center |
172 | ≤ 1 day | 35(77.3%) | HBV | ≥ 1.5 cm | 83%(15%) | 14 |
| Sheng-Di Wu, 2010, China [7] |
Retrospective 1 center |
78 | Unclear | 32.6 ± 12.3 (84.6%) |
HBV | ≥ 15 mm | 41%(11.5%) | 13 |
Characteristics of the Included Studies
Table 1 shows the main features of our eligible studies. A total of 1,798 patients (median age, 34.6 years; 79.4% male) were included. The overall prevalence of significant fibrosis and cirrhosis were 53.1% (range, 21.7%-83%) and 13.5% (3.4%-40.2%), respectively. Regarding histological classification systems, 5 studies used METAVIR score, 2 used Scheuer score, 1 used Ishak score, and 1 used Batts and Ludwig score. According to the Quality Assessment of Diagnostic Accuracy Studies scale, we can see that seven studies met all 14 requirements of this scale, 1 study met 13, and 1 study met 12. The methodological quality of the included studies was very good.
According to the meta-regression, the APRI accuracies for detecting significant fibrosis and cirrhosis were not affected by the interval between Biopsy & APRI (P = 0.22, P = 0.42), or blind biopsy (P = 0.09, P = 0.57), and were both influenced by histological classification systems (P = 0.01, P = 0.03),
Diagnostic Accuracy of the APRI for the Prediction of Significant Fibrosis
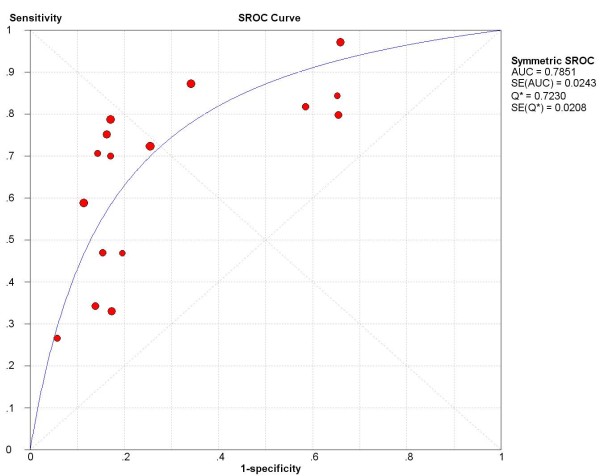
Seven studies in 1,404 patients assessed the APRI for the prediction of significant fibrosis. The average prevalence of significant fibrosis in these studies was 53.1% (range, 21.7%-83%). For this outcome, the area under the SROC curve was 0.79 (SE = 0.0243) and the Q· index was 0.72 (SE = 0.0208) (Figure 2). The summary sensitivities and specificities of the APRI at various thresholds for the identification of significant fibrosis were listed in Table 2. At the threshold of 0.5, the summary sensitivity and specificity were 84% (95% CI, 81%-88%) and 41% (36%-46%), respectively. At the cutoff of 1.5, the summary sensitivity and specificity were 49% (95% CI, 44%-53%) and 84% (80%-88%), respectively. Based on these data, and assuming a 53.1% prevalence of significant fibrosis (as observed in the included studies), the estimated PPV and NPV of 0.5 were 64% and 68%. At the 1.5 cutoff, the estimated PPV and NPV were 80% and 57%, respectively.
Figure 2.
SROC curve of the APRI for significant fibrosis. AUC, area under the SROC curve.
Table 2.
Summary Sensitivities and Specificities of the APRI at various Diagnostic Thresholds for Prediction of Significant Fibrosis and Cirrhosis
| Test Threshold and Outcome | Number of Studies (Patients) |
Summary Sensitivity (95% CI) |
Summary Specificity (95% CI) |
|---|---|---|---|
| Significant Fibrosis | |||
| 0.5 | 5(788) | 84%(81%-88%) | 41%(36%-46%) |
| 1.5 | 5(788) | 49%(44%-53%) | 84%(80%-88%) |
| Cirrhosis | |||
| 1-1.5 | 6(1248) | 54%(48%-60%) | 78%(75%-80%) |
| 2 | 4(792) | 28%(21%-35%) | 87%(84%-89%) |
Diagnostic Accuracy of the APRI for the Prediction of Cirrhosis
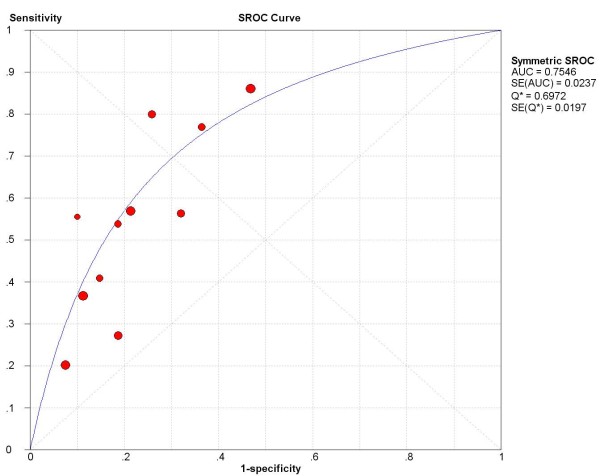
Six studies in 1,012 patients assessed the APRI for the prediction of cirrhosis. The average prevalence of cirrhosis in these studies was 13.5% (range, 3.4%-40.2%). For this outcome, the area under the SROC curve was 0.75 (SE = 0.0237) and the Q· index was 0.70 (SE = 0.0197) (Figure 3). At the threshold of 1.0-1.5, the summary sensitivity and specificity were 54% (95% CI, 48%-60%) and 78% (75%-80%), respectively. At the cutoff of 2.0, the summary sensitivity and specificity were 28% (95% CI, 21%-35%) and 87% (84%-89%), respectively. Based on these data, and assuming a 13.5% prevalence of cirrhosis (as observed in the included studies), the estimated PPV and NPV of 1.0-1.5 were 39% and 86%, respectively. At the 2.0 cutoff, the estimated PPV and NPV were 36% and 82%, respectively.
Figure 3.
SROC curve of the APRI for cirrhosis. AUC, area under the SROC curve.
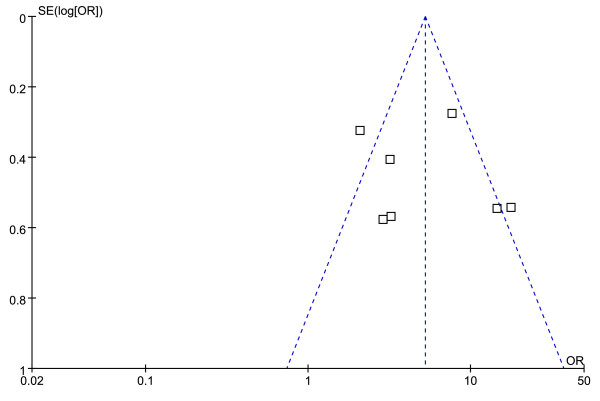
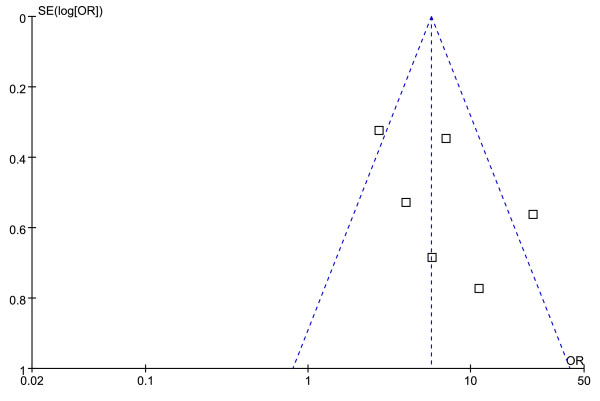
Figures 4 and 5 show the funnel plot analysis to detect the publication bias of each study for significant fibrosis and cirrhosis, respectively. The shape of the funnel plot seems to be asymmetrical, suggesting that publication bias might affect the findings of our meta-analysis.
Figure 4.
Funnel plot of APRI in significant fibrosis to explore publication bias.
Figure 5.
Funnel plot of APRI in cirrhosis to explore publication bias.
Discussion
Recently, the combination of FibroTest with FibroScan has demonstrated high diagnostic accuracy for the detection of significant fibrosis and cirrhosis [30]. However, the combination requires a complex instrument and is costly. Instead, the APRI is based on routinely performed, inexpensive laboratory parameters; it is potentially the ideal tool. The APRI has been derived and validated in HCV. In Wai and colleagues' original study [6], the AUC for HCV-related significant fibrosis and cirrhosis in the training and validation cohorts were 0.80 to 0.88 and 0.89 to 0.94, respectively. Subsequently, many researches supported this view [31-35]. A meta analysis researched by Abdel Aziz M et al. pointed out, in patients with chronic viral hepatitis C (CHC), the summary AUCs of the APRI for significant fibrosis and cirrhosis were 0.76 [95% CI: 0.74-0.79] and 0.82 [95%CI: 0.79-0.86], respectively; an APRI threshold of 0.5 was 81% sensitive and 50% specific, at a 40% prevalence of significant fibrosis, this threshold had a negative predictive value (NPV) of 80%. For cirrhosis, a threshold of 1.0 was 76% sensitive and 71% specific, at a 15% cirrhosis prevalence, the NPV of this threshold was 91%, the major strength of the APRI is the exclusion of significant HCV-related fibrosis [36].
In contrast to HCV, Wai et al. [14] evaluated the accuracy of models (ALT, AST and APRI) from HCV in 218 HBV patients, which indicated that non-invasive markers in predicting histology from CHC patients were unsuitable for CHB patients. Subsequent research demonstrated that in contrast to APRI, ASPRI was accurate in predicting cirrhosis and has the potential to reduce the number of liver biopsies in CHB patients when screening with ASPRI [27]. However, W.G. Shin and colleagues' study indicated that of indirect markers, the APRI yielded the best area (0.86) under the receiver operating characteristic curve [95% CI: 0.82-0.91], the APRI may be the most accurate and simple marker for predicting significant fibrosis in chronic hepatitis B [24]. Lin CS and colleagues' research supported this view [26]. Thus, the present study conclusions are controversial. In our systematic review, we summarize the diagnostic accuracy of the APRI for the prediction of HBV-related fibrosis. In our systematic review, we calculated summary sensitivities and specificities at various thresholds to translate all point estimates into clinical practice. The summary AUROC of the APRI for the diagnosis of significant fibrosis was 0.79. Moreover, the 0.5 threshold was 84% sensitive and 41% specific. Assuming a 53.1% prevalence of significant fibrosis, this translates into estimated PPV and NPV of 64% and 68%, respectively. On the contrary, a cutoff of 1.5 was less sensitive (49%) and more specific (84%). Assuming a 53.1% prevalence of significant fibrosis, this translates into estimated 80%PPV and 57% NPV. With regard to cirrhosis, the summary AUROC was 0.75. Moreover, the1.0-1.5 threshold was 54% sensitive and 78% specific. Assuming a 13.5% prevalence of cirrhosis, this translates into estimated PPV and NPV of 39% and 86%, respectively. On the contrary, a cutoff of 2.0 was less sensitive (28%) and nearly specific (87%). Assuming a 13.5% prevalence of cirrhosis, this translates into estimated 36% PPV and 82% NPV. A diagnostic tool is considered as good if the AUROC is greater than 80%, excellent if the AUROC is greater than 90% and perfect if the AUROC is 100%. According to these results, the APRI may not be a good tool for predicting significant fibrosis and cirrhosis in hepatitis B-related fibrosis and can not reduce the number of liver biopsy.
A strength of our review is that meta-regression analyses have been used for exploring factors that may be responsible for heterogeneity. We analyzed carefully three indicators that might contribute to heterogeneity: (a) the interval between Biopsy & APRI (≤ 1 week or other); (b) blind biopsy (yes VS. no); (c) histological classification systems (METAVIR, Scheuer, Ishak, Batts and Ludwig). By meta-regression, we could see that for both significant fibrosis and cirrhosis, histological classification systems were found to provide heterogeneity to summary test results. Previous research has shown that the hypothesis of the liver biopsy is 80% - 90% accurate, the AUC of medical tests cannot reach 0.9, and more likely fluctuated from 0.75 to 0.9 [37]. To solve the problem, one of the ways is improving the quality of liver biopsies.
Our study has several limitations. Firstly, only HBV-infected patients have been analyzed. Losing some patients with mix infections (HBV/HCV, HBV/HIV and HBV/NAFLD) suggest reduced accuracy. Secondly, some of the studies reported APRI thresholds not included in the original description (Table 2). For example, W.G.Shin et al. proposed that the 1.4 cutoff appears promising (79% sensitive; 83% specific for significant fibrosis) [24]. The number of studies is so small that we have not focused on these thresholds. Finally, we have chosen inclusions only by published manuscripts, so bias in the selection of search channels may influence the results to some extent.
In summary, our systematic review suggests that APRI show limited value in identifying hepatitis B-related significant fibrosis and cirrhosis. The APRI is not an appropriate choice for HBV patients to identify hepatitis B-related fibrosis in regions with limited health care resources. Future studies are necessary to identify high accuracy, cost-effectiveness and widely available measures.
Conclusion
Our meta-analysis suggests that APRI show limited value in identifying hepatitis B-related significant fibrosis and cirrhosis.
Competing interests
The authors declare that they have no competing interests.
Authors' contributions
WWJ and ZHL carried out the design of this meta-analysis, conducted the searching, extracted data, analyzed the data and drafted the manuscript. YNX and SYX participated in study design and the critical revision of the manuscript. XJJ and QJD participated in the critical revision of the manuscript. All authors read and approved the final manuscript.
Pre-publication history
The pre-publication history for this paper can be accessed here:
Contributor Information
Wenwen Jin, Email: king.1006.king@163.com.
Zhonghua Lin, Email: linzhonghua0316@163.com.
Yongning Xin, Email: xinyongning@163.com.
Xiangjun Jiang, Email: drjxj@163.com.
Quanjiang Dong, Email: jiangacer@126.com.
Shiying Xuan, Email: dxyxyn@163.com.
Acknowledgements
This work was partially supported by grants from the Natural Science Foundation of Shandong Province, China (No. ZR2009CQ031)
References
- Wright TL. Introduction to chronic hepatitis B infection. Am J Gastroenterol. 2006;101(Suppl 1):S1–6. doi: 10.1111/j.1572-0241.2006.00469.x. [DOI] [PubMed] [Google Scholar]
- Friedman LS. Controversies in liver biopsy: who, where, when, how, why? Curr Gastroenterol Rep. 2004;6:30–36. doi: 10.1007/s11894-004-0023-4. [DOI] [PubMed] [Google Scholar]
- Bedossa P, Dargere D, Paradis V. Sampling variability of liver fibrosis in chronic hepatitis C. Hepatology. 2003;38:1449–1457. doi: 10.1016/j.hep.2003.09.022. [DOI] [PubMed] [Google Scholar]
- Douds AC, Joseph AE, Finlayson C. et al. Is day case liver biopsy underutilised? Gut. 1995;37:574–575. doi: 10.1136/gut.37.4.574. [DOI] [PMC free article] [PubMed] [Google Scholar]
- Piccinino F, Sagnelli E, Pasquale G. et al. Complications following percutaneous liver biopsy. A multicentre retrospective study on 68,276 biopsies. J Hepatol. 1986;2:165–173. doi: 10.1016/S0168-8278(86)80075-7. [DOI] [PubMed] [Google Scholar]
- Wai CT, Greenson JK, Fontana RJ. et al. A simple noninvasive index can predict both significant fibrosis and cirrhosis in patients with chronic hepatitis C. Hepatology. 2003;38:518–526. doi: 10.1053/jhep.2003.50346. [DOI] [PubMed] [Google Scholar]
- Whiting P, Rutjes AW, Reitsma JB. et al. The development of QUADAS: a tool for the quality assessment of studies of diagnostic accuracy included in systematic reviews. BMC Med Res Methodol. 2003;3:25. doi: 10.1186/1471-2288-3-25. [DOI] [PMC free article] [PubMed] [Google Scholar]
- Whiting P, Rutjes AW, Dinnes J. et al. Development and validation of methods for assessing the quality of diagnostic accuracy studies. Health Technol Assess. 2004;8:1–234. doi: 10.3310/hta8250. iii. [DOI] [PubMed] [Google Scholar]
- Bedossa P, Poynard T. An algorithm for the grading of activity in chronic hepatitis C. The METAVIR Cooperative Study Group. Hepatology. 1996;24:289–293. doi: 10.1002/hep.510240201. [DOI] [PubMed] [Google Scholar]
- Batts KP, Ludwig J. Chronic hepatitis. An update on terminology and reporting. Am J Surg Pathol. 1995;19:1409–1417. doi: 10.1097/00000478-199512000-00007. [DOI] [PubMed] [Google Scholar]
- Scheuer PJ. Classification of chronic viral hepatitis: a need for reassessment. J Hepatol. 1991;13:372–374. doi: 10.1016/0168-8278(91)90084-O. [DOI] [PubMed] [Google Scholar]
- Ishak K, Baptista A, Bianchi L. et al. Histological grading and staging of chronic hepatitis. J Hepatol. 1995;22:696–699. doi: 10.1016/0168-8278(95)80226-6. [DOI] [PubMed] [Google Scholar]
- Schmid CH, Stark PC, Berlin JA. et al. Meta-regression detected associations between heterogeneous treatment effects and study-level, but not patient-level, factors. J Clin Epidemiol. 2004;57:683–697. doi: 10.1016/j.jclinepi.2003.12.001. [DOI] [PubMed] [Google Scholar]
- Wai CT, Cheng CL, Wee A. et al. Non-invasive models for predicting histology in patients with chronic hepatitis B. Liver Int. 2006;26:666–672. doi: 10.1111/j.1478-3231.2006.01287.x. [DOI] [PubMed] [Google Scholar]
- Xu J, Shi J, Wang YP. et al. Milder liver cirrhosis and loss of serum HBeAg do not imply lower risk for hepatocellular carcinoma development in HBV-related cirrhosis. Med Sci Monit. 2009;15:CR274–279. [PubMed] [Google Scholar]
- Kim do Y, Kim SU, Ahn SH. et al. Usefulness of FibroScan for detection of early compensated liver cirrhosis in chronic hepatitis B. Dig Dis Sci. 2009;54:1758–1763. doi: 10.1007/s10620-008-0541-2. [DOI] [PubMed] [Google Scholar]
- Tu XL, Xiao YQ, Chen F. A noninvasive model to predict histological liver cirrhosis in patients with chronic hepatitis B. Zhonghua Gan Zang Bing Za Zhi. 2009;17:28–32. [PubMed] [Google Scholar]
- Zhang YX, Wu WJ, Zhang YZ. et al. Noninvasive assessment of liver fibrosis with combined serum aminotransferase/platelet ratio index and hyaluronic acid in patients with chronic hepatitis B. World J Gastroenterol. 2008;14:7117–7121. doi: 10.3748/wjg.14.7117. [DOI] [PMC free article] [PubMed] [Google Scholar]
- Pissaia A Jr, Borderie D, Bernard D. et al. APRI and FIB-4 Scores Are Useful After Liver Transplantation Independently of Etiology. Transplant Proc. 2009;41:679–681. doi: 10.1016/j.transproceed.2008.12.014. [DOI] [PubMed] [Google Scholar]
- Obara N, Ueno Y, Fukushima K. et al. Transient elastography for measurement of liver stiffness measurement can detect early significant hepatic fibrosis in Japanese patients with viral and nonviral liver diseases. J Gastroenterol. 2008;43:720–728. doi: 10.1007/s00535-008-2225-2. [DOI] [PubMed] [Google Scholar]
- Wu SD, Wang JY, Li L. Staging of liver fibrosis in chronic hepatitis B patients with a composite predictive model: a comparative study. World J Gastroenterol. 2010;16:501–507. doi: 10.3748/wjg.v16.i4.501. [DOI] [PMC free article] [PubMed] [Google Scholar]
- Sebastiani G, Vario A, Guido M. et al. Sequential algorithms combining non-invasive markers and biopsy for the assessment of liver fibrosis in chronic hepatitis B. World J Gastroenterol. 2007;13:525–531. doi: 10.3748/wjg.v13.i4.525. [DOI] [PMC free article] [PubMed] [Google Scholar]
- Chrysanthos NV, Papatheodoridis GV, Savvas S. et al. Aspartate aminotransferase to platelet ratio index for fibrosis evaluation in chronic viral hepatitis. Eur J Gastroenterol Hepatol. 2006;18:389–396. doi: 10.1097/00042737-200604000-00012. [DOI] [PubMed] [Google Scholar]
- Shin WG, Park SH, Jang MK. et al. Aspartate aminotransferase to platelet ratio index (APRI) can predict liver fibrosis in chronic hepatitis B. Dig Liver Dis. 2008;40:267–274. doi: 10.1016/j.dld.2007.10.011. [DOI] [PubMed] [Google Scholar]
- Hongbo L, Xiaohui L, Hong K. et al. Assessing routine and serum markers of liver fibrosis in CHB patients using parallel and serial interpretation. Clin Biochem. 2007;40:562–566. doi: 10.1016/j.clinbiochem.2007.01.022. [DOI] [PubMed] [Google Scholar]
- Lin CS, Chang CS, Yang SS. et al. Retrospective evaluation of serum markers APRI and AST/ALT for assessing liver fibrosis and cirrhosis in chronic hepatitis B and C patients with hepatocellular carcinoma. Intern Med. 2008;47:569–575. doi: 10.2169/internalmedicine.47.0595. [DOI] [PubMed] [Google Scholar]
- Kim BK, Kim SA, Park YN. et al. Noninvasive models to predict liver cirrhosis in patients with chronic hepatitis B. Liver Int. 2007;27:969–976. doi: 10.1111/j.1478-3231.2007.01519.x. [DOI] [PubMed] [Google Scholar]
- Zheng RD ZK, Xian JC, Xu HT, Chen XX, Shen YL, Mao YM, Zeng MD, Lu LG. Assessment of noninvasive diagnostic models for predicting liver fibrosis in patients with chronic hepatitis B virus infection. Chin Hepatol. 2008;13:451–455. [Google Scholar]
- Jiang ZS WX, Ke L, Tan C, Chen N, Li MJ. The diagnostic value of APRI and Forns index for liver fibrosis of chronic hepatitis B. Chin J Clini Hepatol. 2008;24:423–425. [Google Scholar]
- Castera L, Vergniol J, Foucher J. et al. Prospective comparison of transient elastography, Fibrotest, APRI, and liver biopsy for the assessment of fibrosis in chronic hepatitis C. Gastroenterology. 2005;128:343–350. doi: 10.1053/j.gastro.2004.11.018. [DOI] [PubMed] [Google Scholar]
- Carvalho-Filho RJ, Schiavon LL, Narciso-Schiavon JL. et al. Optimized cutoffs improve performance of the aspartate aminotransferase to platelet ratio index for predicting significant liver fibrosis in human immunodeficiency virus/hepatitis C virus co-infection. Liver Int. 2008;28:486–493. doi: 10.1111/j.1478-3231.2008.01675.x. [DOI] [PubMed] [Google Scholar]
- Sinn DH, Paik SW, Kang P. et al. Disease progression and the risk factor analysis for chronic hepatitis C. Liver Int. 2008;28:1363–1369. doi: 10.1111/j.1478-3231.2008.01860.x. [DOI] [PubMed] [Google Scholar]
- Toniutto P, Fabris C, Bitetto D. et al. Role of AST to platelet ratio index in the detection of liver fibrosis in patients with recurrent hepatitis C after liver transplantation. J Gastroenterol Hepatol. 2007;22:1904–1908. doi: 10.1111/j.1440-1746.2006.04628.x. [DOI] [PubMed] [Google Scholar]
- Snyder N, Gajula L, Xiao SY. et al. APRI: an easy and validated predictor of hepatic fibrosis in chronic hepatitis C. J Clin Gastroenterol. 2006;40:535–542. doi: 10.1097/00004836-200607000-00013. [DOI] [PubMed] [Google Scholar]
- Fabris C, Smirne C, Toniutto P. et al. Assessment of liver fibrosis progression in patients with chronic hepatitis C and normal alanine aminotransferase values: the role of AST to the platelet ratio index. Clin Biochem. 2006;39:339–343. doi: 10.1016/j.clinbiochem.2006.01.011. [DOI] [PubMed] [Google Scholar]
- Shaheen AA, Myers RP. Diagnostic accuracy of the aspartate aminotransferase-to-platelet ratio index for the prediction of hepatitis C-related fibrosis: a systematic review. Hepatology. 2007;46:912–921. doi: 10.1002/hep.21835. [DOI] [PubMed] [Google Scholar]
- Afdhal NH, Curry M. Technology evaluation: a critical step in the clinical utilization of novel diagnostic tests for liver fibrosis. J Hepatol. 2007;46:543–545. doi: 10.1016/j.jhep.2007.01.008. [DOI] [PubMed] [Google Scholar]


