

Abstract
Huntington's disease (HD) is caused by a polyglutamine expansion in the Huntingtin (Htt) protein. Proteolytic cleavage of Htt into toxic N-terminal fragments is believed to be a key aspect of pathogenesis. The best characterized putative cleavage event is at amino acid 586, hypothesized to be mediated by caspase 6. A corollary of the caspase 6 cleavage hypothesis is that the caspase 6 fragment should be a toxic fragment. To test this hypothesis, and further characterize the role of this fragment, we have generated transgenic mice expressing the N-terminal 586 aa of Htt with a polyglutamine repeat length of 82 (N586–82Q), under the control of the prion promoter. N586–82Q mice show a clear progressive rotarod deficit by 4 months of age, and are hyperactive starting at 5 months, later changing to hypoactivity before early mortality. MRI studies reveal widespread brain atrophy, and histologic studies demonstrate an abundance of Htt aggregates, mostly cytoplasmic, which are predominantly composed of the N586–82Q polypeptide. Smaller soluble N-terminal fragments appear to accumulate over time, peaking at 4 months, and are predominantly found in the nuclear fraction. This model appears to have a phenotype more severe than current full-length Htt models, but less severe than HD mouse models expressing shorter Htt fragments. These studies suggest that the caspase 6 fragment may be a transient intermediate, that fragment size is a factor contributing to the rate of disease progression, and that short soluble nuclear fragments may be most relevant to pathogenesis.
Introduction
Huntington's disease (HD) is a progressive neurodegenerative disorder caused by expansion of a CAG repeat in the huntingtin protein (Walker, 2007; Ross and Tabrizi, 2011). Considerable insight into HD pathogenesis has arisen from the generation of transgenic mouse models (Menalled and Chesselet, 2002; Heng et al., 2008; Crook and Housman, 2011). Models expressing short N-terminal fragments have rapidly progressing phenotypes. These models include the R6/2 (Mangiarini et al., 1996) and the N171–82Q (Schilling et al., 1999; Zhang et al., 2010). Models expressing full-length Htt generally have relatively mild phenotypes and slow progression, and usually do not die prematurely (Van Raamsdonk et al., 2005). These models include knock-in models (Shelbourne et al., 1999; Wheeler et al., 2000; Menalled et al., 2002) and models expressing the human Htt gene (Hodgson et al., 1999; Slow et al., 2003; Li and Li, 2004; Gray et al., 2008).
Cleavage of Htt is believed to contribute to pathogenesis (Wellington et al., 2002; Graham et al., 2006; Ratovitski et al., 2007, 2009). One candidate cleavage event is at amino acid 586 by caspase 6, and strikingly, mutation of the aspartate 586 in the YAC128 ameliorates the phenotype (Graham et al., 2006). This provides evidence for caspase 6-mediated cleavage of Htt in HD pathogenesis. However, other interpretations are possible. For instance, the mutation could alter the conformation of Htt without altering cleavage. A corollary of the caspase 6 cleavage hypothesis is that a caspase 6 fragment of Htt should be pathogenic in a transgenic mouse model. In this study, we have sought to generate a model expressing the caspase 6 fragment. We have used the prion promoter and a construct with 82 glutamines, to compare to our previous N171–82Q model.
Based on human postmortem studies and other data, it is likely that fragments smaller than the caspase 6 fragment are central to toxicity. In cell models, Htt has been shown to be cleaved into smaller fragments termed cp-A and cp-B (Lunkes et al., 2002) or cp-1 and cp-2 (Ratovitski et al., 2007, 2009). One study, which used the knock-in model, indicated that full-length Htt was cleaved into a number of smaller fragments with the smallest being comparable to cp-1, and similar in size to exon-1 (Landles et al., 2010). We therefore sought to determine whether such fragments might be detectable in our N586–82Q model. Since previous studies (DiFiglia et al., 1997; Saudou et al., 1998; Gutekunst et al., 1999; Peters et al., 1999) have suggested that nuclear localization enhances pathogenicity, we also studied both nuclear and cytoplasmic fractions.
We demonstrate that a novel transgenic mouse model expressing the putative caspase 6 fragment with 82Q has a progressive behavioral and neuropathological phenotype. This model develops the phenotype more slowly than previous fragment models, but faster than full-length mouse models. We also demonstrate the cleavage of N586–82Q into smaller soluble fragments highly enriched in the nucleus, with a time course suggesting a role in pathogenesis.
Materials and Methods
Generation of mice and genotyping
Mice were generated as previously described (Schilling et al., 1999) and offspring were maintained on a B6C3F1 background (Taconic). Genomic DNA isolated from mouse tails was used for genotyping. Briefly, tail snips were incubated in 600 μl of TNES buffer (50 mm Tris, pH 7.5, 100 mm EDTA, 400 mm NaCl, 0.5% SDS) containing 355 mg/ml recombinant proteinase K (Roche) at 55°C overnight. To help precipitate DNA, an excess of NaCl was added (166 μl of a 6 m NaCl solution). The debris was pelleted via centrifugation at 14,000 rpm for 8 min. The DNA was precipitated by adding 100% EtOH and centrifuging again at 14,000 rpm for 8 min. The pellet was washed using 70% EtOH. The final pellet was resuspended in molecular grade water. Genotyping was performed using three different primers; two anneal to the prion promoter sequence and one to the N586 sequence. The primers were as follows: TPrP sense 5′-CCTCTTTGTGACTATGTGGACTGATGTCGG-3′, PrP antisense 5′-GTGGATACCCCCTCCCCCAGCCTAGACC-3′, and HD-586 5′ ATCATCACAGAACAGCCACGGTCACAGCAC-3′. PrP sense and PrP antisense produce a band of ∼700 bp in size. PrP antisense and HD-586 produce a band of ∼350 bp in size. Both PrP primers were used at a final concentration of 3 μm and HD 586 at 3.5 μm. If the genotype is positive, the surplus of HD 586 primer will compete out the PrP sense primer. After an initial 3 min denaturation at 94°C, 25 PCR cycles were carried out. The PCR conditions were as follows: 94°C for 30 s, 66°C for 30 s, 72°C for 45 s.
Western blotting
Mouse brain tissue was sonicated in homogenization buffer (10 mm Na2HPO4, 5 mm EDTA, 5 mm EGTA, 0.02% NaN3, pH 7.5) plus Complete protease inhibitor (Roche). Homogenates were cleared via centrifugation at 13,000 rpm for 30 min. The supernatant was removed and the protein concentration was determined using bicinchoninic acid (BCA) protein assay (Pierce). The insoluble pellet was resuspended in 100% formic acid, incubated at 37°C for 2 h, and then sonicated. The solubilized pellet was neutralized using neutralization buffer (1 m Tris base, 0.5 m Na2HPO4, 0.05% NaN3). Protein concentration was determined using BCA protein assay (Pierce). Equal amounts of protein were loaded on a precast 4–12% Bis-Tris polyacrylamide gel (Invitrogen). Proteins were transferred onto nitrocellulose membrane (Bio-Rad) and probed with a panel of anti-Htt antibodies. Antibodies anti-Htt (1–17) (Sharp et al., 1995), anti-Htt (81–90) (Schilling et al., 2007), and anti-Htt (909/Exon-1) (Peters and Ross, 2001) have been described previously. MW1 was raised against the polyglutamine region of Htt and was a kind gift from Paul Patterson. 1C2 was also raised against the polyglutamine region and is commercially available (Millipore). mEM48, anti-Htt (115–129), anti-Htt 2166 (181–810), and anti-Htt (1–82) are also available commercially (Millipore).
Nuclear and cytoplasmic fractionation
Whole brains were Dounce homogenized in homogenization buffer containing a protease inhibitor cocktail (Roche). Following Dounce homogenization, nuclei plus debris were pelleted at 800 × g for 5 min. The supernatant was removed and spun at 13,000 rpm for 30 min at 4°C. This supernatant was used for the soluble cytoplasmic fraction. Crude nuclear samples were washed four times with homogenization buffer to remove cytoplasmic contaminants. Nuclei were then resuspended in TSE buffer (10 mm Tris, pH 7.5, 300 mm sucrose, 1 mm EDTA, pH 8, 0.1% NP40) containing a protease inhibitor cocktail and Dounce homogenized. Pure nuclei were pelleted at 600 × g and washed three times in TSE buffer. Pure nuclei were resuspended in homogenization buffer and sonicated to shear genomic DNA. Samples were then centrifuged at 13,000 rpm for 30 min at 4°C. This supernatant was used for the soluble nuclear fraction. Samples were subjected to BCA protein determination and equal amounts of protein were loaded on a 4–12% Bis-Tris precast gel. Nuclear and cytoplasmic antibody markers, anti-lamin A/C (cell signaling) and anti-myosin (Sigma), respectively, were used to establish the purity of the fractions.
Behavioral studies
Rotarod testing (rotamex 4/8, Columbus Instruments International) was performed on males from both lines 52 and 91. Training consisted of a 5 min trial in which the speed of the rod was set to 4 rpm. Upon falling, mice were continuously placed back on for the duration of the training. For testing, the speed of the rod was set to 4 rpm and increased by 0.1 rpm/s. Mice received three trials over 3 consecutive days. Mice were allowed to rest for 30 min between trials. The data from each group was averaged and charted.
Spontaneous locomotion was examined using an open-field paradigm using a Versamax Animal Activity Monitoring System with infrared beams (AccuScan Instruments) for 2 h during the light phase. Horizontal and vertical activities and time spent in the center or along the walls of the chamber were automatically recorded. These values were averaged and chartered as total activity.
Mice were subjected to fear conditioning at 8 months of age. On day 1, animals were placed inside the chamber and allowed to habituate for 2.5 min. Immediately thereafter, mice were presented with tone (2000 Hz) for 30 s. For the last 2 s of tone, the mice were presented with a footshock (0.5 mA). The mice were then allowed to stay in the chambers for another 5 min. On day 2, the mice were placed back in the chamber and a 5 min test was performed. During this time, neither shock nor tone was given. On day 3, mice were placed inside a white box, which could be inserted into the same chambers used previously. Animals were allowed to acclimate for 2 min. Immediately thereafter, mice were presented with tone (2000 Hz) for 3 min. At all testing times, videos of mice activity was recorded and analyzed for freezing using FreezeScan software (Cleversys). Statistical analysis was performed using GraphPad Prism.
Immunohistochemical studies
Animals were anesthetized with ether (J. T. Baker) and perfused with 4% paraformaldehyde (PFA) in PBS (Sigma) through the left cardiac ventricle. Perfused brains were removed and postfixed overnight in 4% PFA at 4°C. Fixed brains were stored in 30% sucrose at 4°C. Brains were frozen on dry ice and sliced at 30 μm using a sliding microtome (Leica Jung SM2000). Htt inclusions were detected in free-floating sections using either our own polyclonal anti-Htt 81–90 or mEM48 (Millipore). Sections were also lightly counterstained with hematoxylin. Images were observed using a bright-field light microscope (Olympus-BH2) and captured with a Nikon digital camera (Dx1200). Images were processed using Nikon ACT-1 software.
In vivo MRI acquisition
In vivo studies were performed on a horizontal 11.7 T MR scanner (Bruker Biospin) with a triple-axis gradient and an animal imaging probe. The scanner was also equipped with a physiological monitoring system (EKG, respiration, and body temperature). Mice were first scanned by magnetic resonance imaging (MRI) at 8 months of age. Mice were anesthetized with isoflurane (1%) together with oxygen and air at 1:3 ratios via a vaporizer and a facial mask. We used a 40-mm-diameter birdcage coil for the radiofrequency transmitter and receiver. Temperature was maintained by a heating block built into the gradient system. Respiration was monitored throughout the entire scan. Images were acquired using a three-dimensional (3D) T2-weighted fast spin echo sequence, with the following parameters: echo time (TE)/repetition time (TR) = 40/700 ms, resolution = 0.1 mm × 0.1 mm × 0.1 mm, echo train length = 4, number of average = 2, flip angle = 40°. The total imaging time was ∼50 min per mouse. Mice recovered quickly once the anesthesia was turned off, and all mice survived the repeated 50 min imaging session. Imaging resolution and contrast were sufficient for automatic volumetric characterization of mouse brain and substructures.
Image analysis
Initial processing.
Images were first rigidly aligned to a template image by using automated image registration software (http://bishopw.loni.ucla.edu/AIR5/, AIR). The template image was selected from one of the images acquired from age-matched littermate control mice, which had been manually adjusted to the orientation defined by the Paxinos atlas (Paxinos and Franklin, 2004) with an isotropic resolution of 0.1 mm × 0.1 mm × 0.1 mm per pixel. After rigid alignment, images had the same position and orientation as the template image, and image resolution was also adjusted to an isotropic resolution of 0.1 mm × 0.1 mm × 0.1 mm per pixel. Signals from nonbrain tissue were removed manually (skull stripping).
Computational analysis.
Skull-stripped, rigidly aligned images were analyzed using the Landmarker software (www.mristudio.org).
Results
Transgenic mice expressing N586–82Q display early mortality
Multiple founders from transgenic mice expressing N586–82Q were obtained, three of which were selected for breeding because of a range of moderate to high levels of transgene product present (Fig. 1A). Of the three lines chosen, line 52 expresses the highest level of transgene protein (Fig. 1A), and line 91 slightly less. Western blots prepared from brain homogenates show wide distribution of N586–82Q protein in all brain regions tested (Fig. 1B). Lines 91 and 52 were selected for characterization. Visual signs of deterioration in both lines include poor grooming and decrease in body size (Fig. 1C), and become apparent in males at 6 months of age. Transgenic mice also exhibit frequent clasping when suspended by their tail (Fig. 1C). Weight loss begins in both lines starting at ∼4 months of age, and continues progressively as the disease develops (Fig. 1D). Toward the end stage of disease, mice have a hunched posture and are largely immobile. Death occurs for both lines at ∼1 year (Fig. 1E). These aspects of course and progression are quite similar to the N171–82Q model, though slower.
Figure 1.

Expression of the N586–82Q protein in three lines, and progressive fatal phenotype. A, Immunoblots of mouse brain homogenates showing the levels of N586–82Q transgene protein from three different mouse lines. Line 52 exhibits the highest level of expression. B, Regional distribution of N586–82Q from a 2-month-old transgenic line 52 mouse versus age-matched control. Top, N586–82Q is highly expressed throughout the brain. C, Representative photographs of wild-type mouse compared with N586–82Q line 52 at 9 months. N586–82Q mice are smaller, exhibit a hunched posture, and are less well groomed. Transgenic mice also exhibit limb clasping. D, Both lines begin to lose weight starting from ∼4 months and continue to lose weight over time. E, The average lifespan for each line falls approximately within 1 year.
Two lines expressing N586–82Q exhibit behavioral deficits
Lines 91 and 52 were followed and evaluated over time for changes in behavior. The length of the polyglutamine tracts for both cohorts ranged between 78 and 82 glutamines. Motor impairment was quantified using an accelerated rotarod paradigm, and locomotor activity was measured using an open-field chamber. Both lines developed a similar phenotype beginning from ∼4 months of age compared to age-matched nontransgenic controls. Before 4 months of age, transgenic mice did not exhibit behavioral abnormalities (data not shown). The rotarod deficit was strongest after 4 months with mutant mice significantly less able to stay on the rod (Fig. 2A,B). Transgenic mice became hyperactive after 5 months of age and exhibited a more pronounced difference at 7 months compared to age-matched controls (Fig. 2C,D). As is typical for Htt fragment HD models, mice become hypoactive toward the latter stage of disease (data not shown). At 8 months of age, cognitive impairment could be observed through the use of a fear conditioning paradigm (line 52) (Fig. 2E). On day 1, mutant mice responded more strongly to the shock than nontransgenic controls. On day 2, transgenic mice displayed a deficit in contextual memory as exhibited by a reduced amount of time spent freezing compared to nontransgenic controls. On day 3, they displayed an even bigger deficit in cue-dependent memory; transgenic mice spent less time freezing throughout the duration of the tone than nontransgenic controls.
Figure 2.

N586–82Q mice exhibit a rotarod deficit, are initially hyperactive, and exhibit signs of cognitive impairment. A, B, Rotarod testing of two different lines demonstrates motor impairment. Four-month-old mice from line 52 (A) and line 91 (B) were compared to age-matched controls. For testing, the speed of the rod was set to 4 rpm to start and increased by 0.1 rpm every second. Mice received three trials per day for 3 consecutive days. Unpaired t test, *p < 0.05. Error bars represent SEs. C, D, Total activity of both lines was assessed by means of an open-field chamber for a period of 2 h during the dark phase of the cycle. Unpaired t test, ***p < 0.0001. Error bars represent SEs. E, Line 52 displays a cognitive deficit at 8 months. Similar results were obtained for line 91 at 10 months of age.
N586–82Q mice experience brain atrophy
Structural MRI was performed on the higher-expressing line, line 52. To demonstrate that transgene expression did not induce any neurodevelopmental alterations in brain structure, mice aged 3.5 months were analyzed for changes in brain volume (Fig. 3A–C). Mice tested at this time point did not show any significant difference in brain volume. To determine whether aged transgenic mice suffered a reduction in brain volume, mice aged 8 months were used and compared to nontransgenic age-matched controls. At 8 months of age, mice are approaching the end stage of disease and have already developed both a behavioral and pathological phenotype. Fluid can be seen to collect more so in the transgenic mouse versus the nontransgenic mouse, as the brain tries to compensate for the loss in volume (Fig. 3C). Overall, the whole brain had decreased in size compared to nontransgenic controls by 15.35% (Fig. 3D,E). At this age, almost all brain regions tested showed a decrease in volume (Fig. 3F). MRI did not show any regional selectivity caused by the N586–82Q transgene. Although not significant at this particular time point, mutant mice also experienced an increase in ventricle volume compared to nontransgenic controls.
Figure 3.

N586–82Q mice experience brain atrophy after an initial period of normal regional brain volumes. A, Sample images from an MRI scan using male mice from line 52, 3.5 months of age. B, C, Graphical representation of whole-brain atrophy and of specific brain regions following an MRI analysis. No significant change in brain volume was found at this time point. D, Sample images from an MRI scan using male mice from line 52, 9 months of age. E, F, Graphical representation of whole-brain atrophy and of specific brain regions following an MRI analysis. Most brain regions were affected. Most severely affected were cortex and hippocampus. Ventricles are enlarged (WT 3.1 mm2 vs HD 3.8 mm2). Unpaired t test, ***p < 0.0001. Error bars represent SEs.
N586–82Q is subject to proteolysis over time
Htt proteolysis is a key aspect in HD pathogenesis. N586–82Q can potentially be cleaved into smaller N-terminal fragments, which could contribute to the development of disease. To determine whether N586–82Q proteolysis occurred at different stages of disease, whole-brain homogenates were prepared from mutant mice and age-matched, nontransgenic controls aged 2, 4, and 10 months. At 2 months of age, transgenic mice do not exhibit any disease symptoms, but by 4 months transgenic mice show a pronounced rotarod deficit and are becoming hyperactive. At 10 months of age, mutant mice are nearing the end stage of disease. Symptoms have progressed, including a decline in cognitive function exemplified using fear conditioning, increased weight loss, and reduced motor activity. Immunoblots were probed with a panel of Htt antibodies (Fig. 4A). Multiple antibodies revealed a cleavage pattern, which evolved over time. While full-length N586–82Q decreased over time, soluble Htt fragments accumulated. Approximately five fragments could be identified; the fastest-migrating fragment was the most abundant. As revealed by epitope mapping, this fragment is similar in size to exon-1 and/or the previously described cp-1. All antibodies shown, with the exception of anti-Htt 115–129 (Fig. 4B), reacted clearly with the smallest fragment. The antibodies used show that this fragment is smaller than amino acid about 125, as it did not show reactivity with anti-Htt 115–129 (Fig. 4B).
Figure 4.
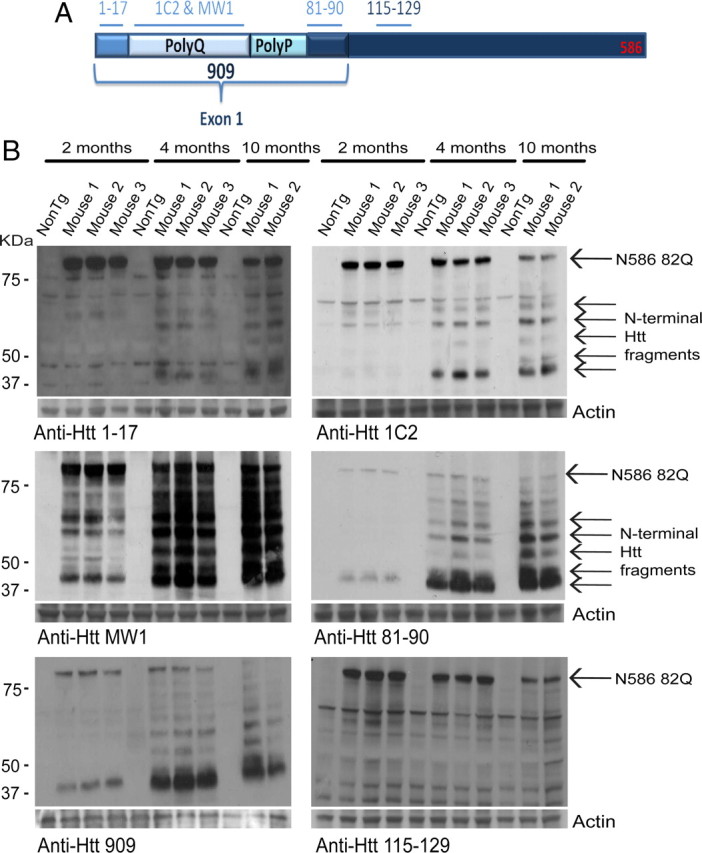
N586–82Q is cleaved into smaller N-terminal fragments over time. A, The N586 fragment and the various antibody recognition sites. B, Whole-brain homogenates were prepared from male mice at the indicated ages. Full-length N586–82Q decreases over time, while smaller fragments accumulate. All antibodies used were capable of detecting N-terminal fragments with the exception of 115–129. The fastest-migrating fragment is smaller than amino acid 120.
Soluble N-terminal Htt fragments are largely nuclear
To further define the localization of N-terminal Htt fragments, we performed nuclear/cytoplasmic fractionations on whole-brain extracts from mice aged both 1 month and 4 months (Fig. 5). The purity of the fractions obtained was examined using markers for the cytoplasm (myosin B) and nucleus (lamin A/C) (Fig. 5A,B, lower panels). Both fractions were uncontaminated. Using anti-Htt 81–90, soluble full-length N586–82Q was only detected in the cytoplasm at 1 month of age. N586 82Q was completely absent from the nucleus at this time point (Fig. 5A). At 4 months of age, N586 82Q was also only found in the cytoplasm. However, N-terminal fragments could also be detected in the cytoplasm (Fig. 5B). Strikingly, abundant levels of soluble N-terminal fragments could be found in the nuclear fraction (Fig. 5B). EM48 antibody could also detect full-length N586–82Q only in the cytoplasm fraction but failed to detect N-terminal Htt fragments.
Figure 5.

Soluble N-terminal Htt fragments accumulate inside the nucleus. Whole-brain homogenates from mice aged 1 month (A) and 4 months (B) were subjected to nuclear and cytoplasmic extraction. A, B, Equal amounts of protein from each sample were run on a 4–12% Bis-Tris gel. The upper panels were probed with anti-Htt 81–90. A, N586–82Q can only be detected in the cytoplasm at 1 month of age. No N-terminal Htt fragments were detected at this time point. Similar results can be seen with anti-Htt 1–82 (lower panel). B, A greater amount of N-terminal Htt fragments can be seen in the nucleus than in the cytoplasm in mice aged 4 months. The next panel down shows an immunoblot probed with EM48, which was only capable of detecting full-length N586–82Q. Like 81–90, EM48 could only detect full-length N586–82Q in the cytoplasm. A, B, The last two panels are controls for fraction contamination. Neither fraction was contaminated.
Htt aggregates are robust throughout the brain and contain the N586–82Q protein
Immunohistochemical studies were performed on frozen, free-floating sections prepared from transgenic and nontransgenic mice aged 6 months. At this age, mutant mice have reached approximately half of their lifetime expectancy and already exhibit a behavioral phenotype. Immunohistochemistry using anti-Htt antibody EM48 raised against amino acids 1–256 lacking the polyglutamine tract revealed a robust amount of Htt inclusions in the cortex, striatum, and hippocampus (Fig. 6A, left panel; representative images are from cortex). Little or no diffuse Htt staining could be observed using EM48 at this age. The images taken at a higher magnification show the aggregates to be largely cytoplasmic. Stainings using the anti-Htt antibody 81–90 raised against amino acids 81–90 revealed a slightly different staining pattern (Fig. 6A, right panel). While many aggregates could also be detected, it did not appear to stain as many aggregates as EM48. However, anti-Htt 81–90 was capable of detecting more diffuse Htt. Furthermore, 81–90 was also able to stain more nuclear Htt, diffuse and aggregate. To study aggregate composition, different antibodies spanning the length of the N586 polypeptide including an N586 neoepitope antibody were used (Fig. 6B). Immunofluorescent labeling of slices obtained from mice aged 1 year showed that the aggregates are made up of N-terminal fragments as well as the complete N586 82Q protein (Fig. 6B). While N-terminal Htt antibodies were capable of detecting a dense population of Htt inclusion bodies, formic acid treatment allowed the more C-terminal antibody, 2166, and the neoepitope antibody (HD55) to detect aggregates not seen without its addition.
Figure 6.

Htt aggregates are composed of both N-terminal fragments and N586–82Q. A, Frozen/free-floating sections (30 mm) from 6-month-old N586–82Q mice were immunostained with EM48 (left panel) and anti-Htt 81–90 (right panel), followed by DAB and lightly counterstained with hematoxylin. Note that htt staining is absent from age-matched control. A high density of htt aggregates may be found throughout the cortex, striatum, and hippocampus. Representative images were taken from the cortex. The higher magnification (lower panel) shows EM48 to detect a large population of aggregates in the cytoplasm while anti-Htt 81–90 was capable of detecting more diffuse Htt, which appeared more nuclear. B, Free-floating sections from male mice, line 52 aged 1 year, were probed with the indicated antibodies. N-terminal Htt antibodies (1–82 and 81–90) were capable of detecting a multitude of Htt inclusion bodies. The more C-terminal anti-Htt antibody, 2166 (181–810), did not detect as many aggregates as either N-terminal antibodies but did appear to have more reactivity after the slices had been treated with formic acid (FA). Similarly, the N586 neo-epitope antibody, HD55, was also capable of detecting aggregates, and this reactivity was increased following FA treatment.
Htt aggregates are composed largely of the complete N586 82Q polypeptide
To perform a more detailed study of Htt aggregate composition, formic acid extractions were performed on the insoluble fraction prepared from mice aged 4 months (Fig. 7A,B). The insoluble fraction isolated from whole-brain homogenates and solubilized using formic acid revealed the N586 82Q protein to be the major component of Htt aggregates at this time point (Fig. 7A). Anti-Htt 2166 was only capable of detecting the N586–82Q protein. While both anti-Htt antibodies 3B5H10 (which selectively detects polyglutamines with β-hairpin structure) and MW1 (raised against the polyglutamine) were capable of detecting the presence of N-terminal Htt fragments, the N586–82Q was clearly the dominant species present (Fig. 7A). We also performed formic acid extractions of the insoluble fractions isolated after a nuclear/cytoplasmic separation (Fig. 7B). All anti-Htt antibodies used showed the N586–82Q protein to be found only in the cytoplasm. N-terminal Htt antibodies 3B5H10 and MW1 were capable of detecting N-terminal fragments in both the cytoplasmic and nuclear fractions (Fig. 7B).
Figure 7.

Htt aggregates are composed of both N-terminal fragments and N586–82Q with N586–82Q most abundant. A, Insoluble material from whole-brain homogenates from mice aged 4 months was treated with formic acid. Equal amounts of protein were loaded on a 4–12% Bis-Tris gel and immunoblots were probed with the indicated antibodies. Anti-Htt 2166 detects only N586–82Q. Immunoblots probed using either 3B5H10 and anti-polyQ antibody MW1 can detect both N586–82Q and N-terminal Htt fragments. Both antibodies indicate that N586–82Q is the major component of Htt aggregates. B, Insoluble material prepared from the nuclear and cytoplasmic fractionation was also subjected to formic acid treatment and immunoblotted using the same antibodies. All three antibodies used show N586–82Q to be the major component of cytoplasmic aggregates. Both 3B5H10 and MW1 show nuclear aggregates to be composed of only N-terminal Htt fragments. Asterisk indicates nonspecific band.
N586–82Q mice express higher Htt protein levels than N171–82Q mice and accumulate more N-terminal fragments than YAC128 mice
As mentioned earlier, full-length HD mouse models tend to have milder and more slowly progressing phenotypes than the fragment models. N586–82Q mice express an intermediate-sized fragment and have a HD-like phenotype that progresses slower than the shorter fragment models but faster than the full-length models. To determine whether the phenotype is related to fragment size, rather than large differences in the level of Htt protein expressed, we compared the Htt protein expression levels between the N586–82Q and N171–82Q mice, as well as between N586–82Q and YAC128 mice (Fig. 8A,B). Htt expression in both N586–82Q and N171–82Q mice is driven by the prion promoter, while expression in the YAC128 mice is under control of the human Htt promoter. To avoid having to interpret the amount of protein incorporated into inclusions, mice aged 1 month were chosen for comparative studies, since they have predominantly soluble Htt protein. The N586–82Q mice express considerably more Htt protein than N171–82Q mice (Fig. 8A). While the 1C2 antibody revealed comparable expression levels between N586–82Q and YAC128 (Fig. 8B, left panel), the 1–82 antibody showed the N586–82Q protein levels to be slightly higher (Fig. 8B, right panel).
Figure 8.

N586–82Q express substantially higher protein levels than N171–82Q and accumulate more of the “cp-1-like” fragment than YAC128. A, B, Immunoblots of mouse brain cortical homogenates aged 1 month showing the expression levels of N586–82Q relative to N171–82Q and full-length Htt in YAC128. A, Immunoreactivity using 81–90 demonstrated that the N586–82Q mice express much higher protein levels than the N171–82Q mice. Immunoblots using 1C2 and 1–82 revealed the same pattern of expression (data not shown). B, Immunoreactivity using the anti-polyglutamine; 1C2 revealed a similar expression level between N586–82Q and YAC128 mouse models. Immunoreactivity using anti-Htt 1–82 showed that protein expression levels were slightly higher in the N586–82Q mice. C, Immunoblots of brain homogenates prepared from cortices of both N586–82Q and YAC128 mice aged 4 months. Immunoreactivity using anti-Htt 81–90 revealed a greater accumulation of the fastest-migrating fragment, named here “cp-1-like” fragment in the N586–82Q mice compared to YAC128 mice. D, The ratio of fastest-migrating N-terminal fragment was obtained by comparing the amount of fragment generated from N586–82Q and full-length Htt in the respective mouse models. N586–82Q mice accumulated more of the “cp-1-like” fragment.
Since the phenotype of N586–82Q mice develops faster than in full-length models, other relevant pathogenic events may occur earlier in these mice. Since proteolysis into small N-terminal fragments appears to be a pathogenic event, we sought to determine whether this event occurred earlier in N586–82Q mice than in YAC128. Considering that a large amount of the fastest-migrating fragment or “cp-1-like fragment” is generated in these mice (Fig. 4B), we decided to compare the ratio of the fastest-migrating fragment to the corresponding transgene in both N586–82Q and YAC128 mice (Fig. 8C,D). Mice aged 4 months were chosen for these studies since at this age both HD models begin to develop behavioral deficits. Like the N586–82Q mice, YAC128 mice also develop a proteolytic band ladder at this age, with the fastest-migrating fragment being similar in size to that from N586–82Q, taking the extra polyglutamine length into account. N586–82Q mice appear to accumulate more of the “cp-1-like” fragment than YAC128 mice at 4 months (Fig. 8C,D).
N586–82Q mice experience earlier brain atrophy than full-length models and have an intermediate lifespan relative to other HD mouse models
We next compared the extent of whole-brain atrophy measured via MRI between the N586–82Q model and HD full-length mouse models for which some data already exists. Since the N586–82Q mice did not appear to experience selective brain atrophy, we used whole-brain atrophy as a measure. YAC128 mice experienced a 2% loss in total brain volume at 8 months, but this did not reach significance (Lerch et al., 2008). A significant measure of brain atrophy could only be detected at 18 months in the BACHD mice (Fig. 9A), i.e., 3.5% loss in whole-brain volume. In contrast to the full-length models, the N586–82Q mice suffered a 16% loss in whole-brain volume at 9 months of age (Fig. 9A). The N586–82Q fragment induces earlier whole-brain atrophy than both BACHD and YAC128 mouse models. The N586–82Q fragment is intermediate in size relative to existing mouse models, and its expression in mice results in premature death, i.e., within 1 year. The lifespan of the N586–82Q mice is intermediate relative to full-length and other fragment models (Fig. 9B).
Figure 9.

MRI studies reveal N586–82Q mice experience a greater loss in whole-brain volume earlier than full-length models. N586–82Q mice also die earlier than other full-length models. A, BACHD mice experience a 3.5% loss in brain volume at 18 months (n = 8). No significant change was seen before 18 months. YAC128 mice experience a 2% loss in total brain volume at 9 months, but this loss was not significant (NS). N586–82Q mice experience a 13.4% loss in whole-brain volume at 9 months of age. B, Summary of the survival of the various mouse models compared to N586–82Q. N586–82Q mice have an intermediate life span relative to full-length and other fragment models. Wavy line indicates no premature death.
Discussion
In this study, we have generated a novel transgenic mouse model of Huntington's disease using the putative caspase 6-derived Htt fragment “N586” with an expansion length of 82 glutamines. Similar to our previous N171–82Q model, the N586–82Q model has a robust and progressive behavioral phenotype, with early brain atrophy and early mortality. There is accumulation of Htt aggregates, mostly consisting of the N586 polypeptide. In addition, we see striking evidence for time-dependent proteolysis of the N586 polypeptide into smaller soluble N-terminal fragments, which are highly enriched in the nucleus (Fig. 10).
Figure 10.

Summary of N586–82Q proteolysis and aggregation pathway. The N586–82Q protein is subject to both proteolysis and aggregation inside the cytoplasm. Aggregates are abundantly cytoplasmic and are made up mostly of the N586–82Q protein. The N-terminal Htt fragments cleaved from N586–82Q in the cytoplasm can either remain soluble or form aggregates in the cytoplasm. Most of the N-terminal Htt fragments translocate to the nucleus, where they can also form aggregates.
Initial characterization of the N586 mouse model phenotype suggests that it has an intermediate phenotype relative to the previous fragment models and full-length models. The phenotype is quite similar to that of both the N171–82Q and R6/2 models: there is progressive weight loss and an end stage that includes rigidity, hypoactivity, and poor grooming. A recent study showed that expression of mutant Htt in the hypothalamus causes metabolic abnormalities and induces obesity in mice. This effect was independent of fragment size (Hult et al., 2011). Therefore, if N586–82Q were to be expressed only in the hypothalamus, a similar outcome might be expected. Like the N-terminal fragments expressed in the N171–82Q and R6/2 mouse models, N586–82Q also induces premature death. We have not yet characterized the behavioral time course of this model in detail, but the studies done so far indicate that initial hyperactivity progresses to hypoactivity at later stages. This is somewhat reminiscent of human HD, in that hyperkinetic movement disorder tends to predominate early in the course, but hypokinetic movement supervenes later in the course. In addition to motor disturbances, we show abnormalities of cognitive and emotional behavior. This is also comparable to human HD, which has motor, cognitive, and emotional components.
The N586–82Q fragment is intermediate in size compared to full-length Htt and the fragments used to create either the N171–82Q or R6/2 mice. The N586–82Q fragment appears to induce a phenotype that progresses faster than full-length models, but slower than models made with shorter fragments. The N586–82Q mice express much greater amounts of protein than the N171–82Q mice. Since the expression of both proteins N586 and N171 is under control of the same promoter and they have the same polyglutamine length, it appears that it is not the amount of protein expressed that controls the severity of the ensuing phenotype, but rather the fragment size.
The comparison of Htt protein levels between the YAC128 and N586–82Q mice is slightly more complex. Htt expression in the YAC128 mice is under the control of human Htt promoter and the polyglutamine tract is considerably longer. Anti-Htt 1–82 revealed a somewhat higher expression pattern in the N586–82Q. The 1C2 antibody reacts more strongly with longer repeat lengths, and shows very similar reactivity to Htt in the two models. Based on these findings, the accelerated phenotype of the N586–82Q mice compared to full-length models may not be due only to higher protein expression but rather due to the expression of a shorter polyglutamine-containing polypeptide. Although it is reasonable to assume that the different promoters driving Htt expression in these mice might introduce variations, our data suggest that the N586–82Q fragment being an intermediate size induces an intermediate phenotype.
Brain MRI studies show substantial brain atrophy in this model, which can be described as degenerative rather than developmental, since younger mice have regional normal brain volumes. Atrophy is relatively widespread, which is comparable to previously described fragment models such as the R6/2 and the N171–82Q model. In human HD, there is widespread brain atrophy at late stages, with brains of late-stage HD patients showing overall atrophy comparable to those of late-stage Alzheimer's patients, and more widespread atrophy in patients with long repeat expansions. In contrast, full-length models may have more regionally selective atrophy.
A striking feature of our model is the evidence for further proteolytic cleavage of the N586 polypeptide into smaller fragments. The fastest-migrating fragment is the most abundant, and appears to accumulate over time. While we have not determined the exact cleavage sites, the epitope mapping indicates that the predominant fragment is similar to what we have described in cell culture studies as “cp-1” (Ratovitski et al., 2007, 2009). A recent study (Landles et al., 2010) of proteolytic cleavage in the 140Q knock-in mouse model shows cleavage of Htt into a number of fragments. One of these fragments was proposed on the basis of antibody reactivity to be exon 1. The approximate migration of the fragment in our model is comparable to both the exon 1 and cp-1 fragments. Since N586–82Q predominated in the cytoplasmic fraction, where low amounts of soluble N-terminal fragments were found, we hypothesize that N586–82Q is cleaved in the cytoplasm, and that the fragments generated migrate to the nucleus. It is striking that the nuclear fraction consists almost entirely of N-terminal fragments rather than the N586 polypeptide itself, suggesting that the N586 polypeptide, if formed from full-length Htt in the disease process, may be a transient intermediate.
A previous study found that caspase 6 cleavage of full-length Htt could take place inside the nucleus. However, overexpression of N586 tends to result in cytoplasmic localization. In our mouse model, N586–82Q is overexpressed, and is largely located in the cytoplasm. It is possible that the N586–82Q polypeptide enters the nucleus first and is then degraded into smaller N-terminal fragments. However, this may be less likely, given that N586–82Q was found only in the cytoplasm even at a younger age. The cell biology of Htt nuclear import and export is still not completely understood (Trushina et al., 2003; Xia et al., 2003; Cornett et al., 2005; Havel et al., 2009), but since many studies have indicated that nuclear N-terminal Htt fragments are more toxic than those in the cytoplasm, we hypothesize that their accumulation in this model is important for toxicity.
The appearance of the shortest fragments in the N586–82Q mice appears to correlate with the development of the behavioral phenotype. This is consistent with the idea that the small cp-1 like fragment has pathogenic relevance. Interestingly, the YAC128 model does not accumulate as much of this fragment as the N586–82Q model. Since we believe the cp-1 fragment is a toxic fragment, this might help explain the rate of disease progression in the two models—the N586–82Q mice accumulate more of the cp-1 like fragment and therefore develop a phenotype sooner than the YAC128.
In parallel with our project, Tebbenkamp et al. (2011) developed a mouse model expressing N586–82Q under the control of the prion promoter, as in our model, but also expressing eGFP under the control of the keratin 14 promoter (K14-eGFP). The single line of mice reported showed profound ataxia, attributed to cerebellar granule cell degeneration observed in that line. This feature was not present in our N586–82Q model. Furthermore, the authors did not observe the same proteolysis pattern found in our mice. The cytoplasmic aggregates in the mice of Tebbenkamp et al. (2011) are apparently composed largely of small fragments and not the N586–82Q polypeptide itself. In contrast, the Htt aggregates in the cytoplasm of our model are made up mostly by the N586–82Q polypeptide. Tebbenkamp et al. (2011) conclude that the ataxia phenotype in their model is due to cerebellar granule cell degeneration, possibly because “enhancer elements in the K14 promoter affect the temporal or spatial pattern of htt N586–82Q expression in some manner that modifies disease phenotype.” Such marked cerebellar granule cell degeneration is not a feature of human HD. Therefore, we believe the N586–82Q model reported here to be more relevant for HD pathogenesis.
In conclusion, we have generated a new HD mouse model that demonstrates that the putative caspase 6-derived Htt polypeptide of 586 aa is a toxic fragment (Fig. 10). This model has some favorable features for future studies. It expresses a postulated physiologically relevant fragment. This fragment is considerably longer than those in previous fragment models, and thus will be more suitable for studying posttranslational modifications. There are many known posttranslational modification sites in this region, including a number of residues in the first 17 aa (Gu et al., 2009; Tam et al., 2009), the akt phosphorylation site (S421) (Humbert et al., 2002), the acetylation site (K444) (Jeong et al., 2009), and the lipid modification site (C214) (Yanai et al., 2006). In addition, there are likely to be other sites as well (our unpublished data). We show striking evidence that further proteolytic cleavage of Htt into short soluble nuclear fragments may contribute to pathogenesis. Identification of the exact sites of cleavage may provide important insight into HD biology. Behavioral abnormalities in this model begin by ∼4 months of age, suggesting that it may be suitable for studies of the “presymptomatic” or “prodromal” period (Aylward et al., 2011; Ross and Tabrizi, 2011; Tabrizi et al., 2011). The model has a robust and progressive behavioral and neuropathological phenotype, with death at ∼1 year, making it suitable for preclinical therapeutic studies.
Footnotes
This work was supported by NINDS Grant 16375, Huntington's Disease Society of America (HDSA), Cure Huntington's Disease Initiative (CHDI), the Intramural Research Program of the NIH, Center for Cancer Research, and National Cancer Institute (for D.S. and L.T.). We thank Hilda Brown for the generation of the N586–82Q plasmid. We also thank the Behavioral Core at Johns Hopkins and its co-coordinator, Jennifer Yochum for facilities and services.
References
- Aylward EH, Nopoulos PC, Ross CA, Langbehn DR, Pierson RK, Mills JA, Johnson HJ, Magnotta VA, Juhl AR, Paulsen JS. Longitudinal change in regional brain volumes in prodromal Huntington disease. J Neurol Neurosurg Psychiatry. 2011;82:405–410. doi: 10.1136/jnnp.2010.208264. [DOI] [PMC free article] [PubMed] [Google Scholar]
- Cornett J, Cao F, Wang CE, Ross CA, Bates GP, Li SH, Li XJ. Polyglutamine expansion of huntingtin impairs its nuclear export. Nat Genet. 2005;37:198–204. doi: 10.1038/ng1503. [DOI] [PubMed] [Google Scholar]
- Crook ZR, Housman D. Huntington's disease: can mice lead the way to treatment? Neuron. 2011;69:423–435. doi: 10.1016/j.neuron.2010.12.035. [DOI] [PMC free article] [PubMed] [Google Scholar]
- DiFiglia M, Sapp E, Chase KO, Davies SW, Bates GP, Vonsattel JP, Aronin N. Aggregation of huntingtin in neuronal intranuclear inclusions and dystrophic neurites in brain. Science. 1997;277:1990–1993. doi: 10.1126/science.277.5334.1990. [DOI] [PubMed] [Google Scholar]
- Graham RK, Deng Y, Slow EJ, Haigh B, Bissada N, Lu G, Pearson J, Shehadeh J, Bertram L, Murphy Z, Warby SC, Doty CN, Roy S, Wellington CL, Leavitt BR, Raymond LA, Nicholson DW, Hayden MR. Cleavage at the caspase-6 site is required for neuronal dysfunction and degeneration due to mutant huntingtin. Cell. 2006;125:1179–1191. doi: 10.1016/j.cell.2006.04.026. [DOI] [PubMed] [Google Scholar]
- Gray M, Shirasaki DI, Cepeda C, André VM, Wilburn B, Lu XH, Tao J, Yamazaki I, Li SH, Sun YE, Li XJ, Levine MS, Yang XW. Full-length human mutant huntingtin with a stable polyglutamine repeat can elicit progressive and selective neuropathogenesis in BACHD mice. J Neurosci. 2008;28:6182–6195. doi: 10.1523/JNEUROSCI.0857-08.2008. [DOI] [PMC free article] [PubMed] [Google Scholar]
- Gu X, Greiner ER, Mishra R, Kodali R, Osmand A, Finkbeiner S, Steffan JS, Thompson LM, Wetzel R, Yang XW. Serines 13 and 16 are critical determinants of full-length human mutant huntingtin induced disease pathogenesis in HD mice. Neuron. 2009;64:828–840. doi: 10.1016/j.neuron.2009.11.020. [DOI] [PMC free article] [PubMed] [Google Scholar]
- Gutekunst CA, Li SH, Yi H, Mulroy JS, Kuemmerle S, Jones R, Rye D, Ferrante RJ, Hersch SM, Li XJ. Nuclear and neuropil aggregates in Huntington's disease: relationship to neuropathology. J Neurosci. 1999;19:2522–2534. doi: 10.1523/JNEUROSCI.19-07-02522.1999. [DOI] [PMC free article] [PubMed] [Google Scholar]
- Havel LS, Li S, Li XJ. Nuclear accumulation of polyglutamine disease proteins and neuropathology. Mol Brain. 2009;2:21. doi: 10.1186/1756-6606-2-21. [DOI] [PMC free article] [PubMed] [Google Scholar]
- Heng MY, Detloff PJ, Albin RL. Rodent genetic models of Huntington disease. Neurobiol Dis. 2008;32:1–9. doi: 10.1016/j.nbd.2008.06.005. [DOI] [PubMed] [Google Scholar]
- Hodgson JG, Agopyan N, Gutekunst CA, Leavitt BR, LePiane F, Singaraja R, Smith DJ, Bissada N, McCutcheon K, Nasir J, Jamot L, Li XJ, Stevens ME, Rosemond E, Roder JC, Phillips AG, Rubin EM, Hersch SM, Hayden MR. A YAC mouse model for Huntington's disease with full-length mutant huntingtin, cytoplasmic toxicity, and selective striatal neurodegeneration. Neuron. 1999;23:181–192. doi: 10.1016/s0896-6273(00)80764-3. [DOI] [PubMed] [Google Scholar]
- Hult S, Soylu R, Björklund T, Belgardt BF, Mauer J, Brüning JC, Kirik D, Petersén Å. Mutant huntingtin causes metabolic imbalance by disruption of hypothalamic neurocircuits. Cell Metab. 2011;13:428–439. doi: 10.1016/j.cmet.2011.02.013. [DOI] [PubMed] [Google Scholar]
- Humbert S, Bryson EA, Cordelières FP, Connors NC, Datta SR, Finkbeiner S, Greenberg ME, Saudou F. The IGF-1/Akt pathway is neuroprotective in Huntington's disease and involves Huntingtin phosphorylation by Akt. Dev Cell. 2002;2:831–837. doi: 10.1016/s1534-5807(02)00188-0. [DOI] [PubMed] [Google Scholar]
- Jeong H, Then F, Melia TJ, Jr, Mazzulli JR, Cui L, Savas JN, Voisine C, Paganetti P, Tanese N, Hart AC, Yamamoto A, Krainc D. Acetylation targets mutant huntingtin to autophagosomes for degradation. Cell. 2009;137:60–72. doi: 10.1016/j.cell.2009.03.018. [DOI] [PMC free article] [PubMed] [Google Scholar]
- Landles C, Sathasivam K, Weiss A, Woodman B, Moffitt H, Finkbeiner S, Sun B, Gafni J, Ellerby LM, Trottier Y, Richards WG, Osmand A, Paganetti P, Bates GP. Proteolysis of mutant huntingtin produces an exon 1 fragment that accumulates as an aggregated protein in neuronal nuclei in Huntington disease. J Biol Chem. 2010;285:8808–8823. doi: 10.1074/jbc.M109.075028. [DOI] [PMC free article] [PubMed] [Google Scholar]
- Lerch JP, Carroll JB, Spring S, Bertram LN, Schwab C, Hayden MR, Henkelman RM. Automated deformation analysis in the YAC128 Huntington disease mouse model. Neuroimage. 2008;39:32–39. doi: 10.1016/j.neuroimage.2007.08.033. [DOI] [PubMed] [Google Scholar]
- Li SH, Li XJ. Huntingtin and its role in neuronal degeneration. Neuroscientist. 2004;10:467–475. doi: 10.1177/1073858404266777. [DOI] [PubMed] [Google Scholar]
- Lunkes A, Lindenberg KS, Ben-Haïem L, Weber C, Devys D, Landwehrmeyer GB, Mandel JL, Trottier Y. Proteases acting on mutant huntingtin generate cleaved products that differentially build up cytoplasmic and nuclear inclusions. Mol Cell. 2002;10:259–269. doi: 10.1016/s1097-2765(02)00602-0. [DOI] [PubMed] [Google Scholar]
- Mangiarini L, Sathasivam K, Seller M, Cozens B, Harper A, Hetherington C, Lawton M, Trottier Y, Lehrach H, Davies SW, Bates GP. Exon 1 of the HD gene with an expanded CAG repeat is sufficient to cause a progressive neurological phenotype in transgenic mice. Cell. 1996;87:493–506. doi: 10.1016/s0092-8674(00)81369-0. [DOI] [PubMed] [Google Scholar]
- Menalled LB, Chesselet MF. Mouse models of Huntington's disease. Trends Pharmacol Sci. 2002;23:32–39. doi: 10.1016/s0165-6147(00)01884-8. [DOI] [PubMed] [Google Scholar]
- Menalled LB, Sison JD, Wu Y, Olivieri M, Li XJ, Li H, Zeitlin S, Chesselet MF. Early motor dysfunction and striosomal distribution of huntingtin microaggregates in Huntington's disease knock-in mice. J Neurosci. 2002;22:8266–8276. doi: 10.1523/JNEUROSCI.22-18-08266.2002. [DOI] [PMC free article] [PubMed] [Google Scholar]
- Paxinos G, Franklin KBG. The mouse brain in stereotaxic coordinates. Ed 2. San Diego: Academic; 2004. [Google Scholar]
- Peters MF, Ross CA. Isolation of a 40-kDa Huntingtin-associated protein. J Biol Chem. 2001;276:3188–3194. doi: 10.1074/jbc.M008099200. [DOI] [PubMed] [Google Scholar]
- Peters MF, Nucifora FC, Jr, Kushi J, Seaman HC, Cooper JK, Herring WJ, Dawson VL, Dawson TM, Ross CA. Nuclear targeting of mutant Huntingtin increases toxicity. Mol Cell Neurosci. 1999;14:121–128. doi: 10.1006/mcne.1999.0773. [DOI] [PubMed] [Google Scholar]
- Ratovitski T, Nakamura M, D'Ambola J, Chighladze E, Liang Y, Wang W, Graham R, Hayden MR, Borchelt DR, Hirschhorn RR, Ross CA. N-terminal proteolysis of full-length mutant huntingtin in an inducible PC12 cell model of Huntington's disease. Cell Cycle. 2007;6:2970–2981. doi: 10.4161/cc.6.23.4992. [DOI] [PubMed] [Google Scholar]
- Ratovitski T, Gucek M, Jiang H, Chighladze E, Waldron E, D'Ambola J, Hou Z, Liang Y, Poirier MA, Hirschhorn RR, Graham R, Hayden MR, Cole RN, Ross CA. Mutant Huntingtin N-terminal fragments of specific size mediate aggregation and toxicity in neuronal cells. J Biol Chem. 2009;284:10855–10867. doi: 10.1074/jbc.M804813200. [DOI] [PMC free article] [PubMed] [Google Scholar]
- Ross CA, Tabrizi SJ. Huntington's disease: from molecular pathogenesis to clinical treatment. Lancet Neurol. 2011;10:83–98. doi: 10.1016/S1474-4422(10)70245-3. [DOI] [PubMed] [Google Scholar]
- Saudou F, Finkbeiner S, Devys D, Greenberg ME. Huntingtin acts in the nucleus to induce apoptosis but death does not correlate with the formation of intranuclear inclusions. Cell. 1998;95:55–66. doi: 10.1016/s0092-8674(00)81782-1. [DOI] [PubMed] [Google Scholar]
- Schilling G, Becher MW, Sharp AH, Jinnah HA, Duan K, Kotzuk JA, Slunt HH, Ratovitski T, Cooper JK, Jenkins NA, Copeland NG, Price DL, Ross CA, Borchelt DR. Intranuclear inclusions and neuritic aggregates in transgenic mice expressing a mutant N-terminal fragment of huntingtin. Hum Mol Genet. 1999;8:397–407. doi: 10.1093/hmg/8.3.397. [DOI] [PubMed] [Google Scholar]
- Schilling G, Klevytska A, Tebbenkamp AT, Juenemann K, Cooper J, Gonzales V, Slunt H, Poirer M, Ross CA, Borchelt DR. Characterization of huntingtin pathologic fragments in human Huntington disease, transgenic mice, and cell models. J Neuropathol Exp Neurol. 2007;66:313–320. doi: 10.1097/nen.0b013e318040b2c8. [DOI] [PubMed] [Google Scholar]
- Sharp AH, Loev SJ, Schilling G, Li SH, Li XJ, Bao J, Wagster MV, Kotzuk JA, Steiner JP, Lo A, Hedreen J, Sisodia S, Snyder SH, Dawson TM, Ryugo DK, Ross CA. Widespread expression of Huntington's disease gene (IT15) protein product. Neuron. 1995;14:1065–1074. doi: 10.1016/0896-6273(95)90345-3. [DOI] [PubMed] [Google Scholar]
- Shelbourne PF, Killeen N, Hevner RF, Johnston HM, Tecott L, Lewandoski M, Ennis M, Ramirez L, Li Z, Iannicola C, Littman DR, Myers RM. A Huntington's disease CAG expansion at the murine Hdh locus is unstable and associated with behavioural abnormalities in mice. Hum Mol Genet. 1999;8:763–774. doi: 10.1093/hmg/8.5.763. [DOI] [PubMed] [Google Scholar]
- Slow EJ, van Raamsdonk J, Rogers D, Coleman SH, Graham RK, Deng Y, Oh R, Bissada N, Hossain SM, Yang YZ, Li XJ, Simpson EM, Gutekunst CA, Leavitt BR, Hayden MR. Selective striatal neuronal loss in a YAC128 mouse model of Huntington disease. Hum Mol Genet. 2003;12:1555–1567. doi: 10.1093/hmg/ddg169. [DOI] [PubMed] [Google Scholar]
- Tabrizi SJ, Scahill RI, Durr A, Roos RA, Leavitt BR, Jones R, Landwehrmeyer GB, Fox NC, Johnson H, Hicks SL, Kennard C, Craufurd D, Frost C, Langbehn DR, Reilmann R, Stout JC. Biological and clinical changes in premanifest and early stage Huntington's disease in the TRACK-HD study: the 12-month longitudinal analysis. Lancet Neurol. 2011;10:31–42. doi: 10.1016/S1474-4422(10)70276-3. [DOI] [PubMed] [Google Scholar]
- Tam S, Spiess C, Auyeung W, Joachimiak L, Chen B, Poirier MA, Frydman J. The chaperonin TRiC blocks a huntingtin sequence element that promotes the conformational switch to aggregation. Nat Struct Mol Biol. 2009;16:1279–1285. doi: 10.1038/nsmb.1700. [DOI] [PMC free article] [PubMed] [Google Scholar]
- Tebbenkamp AT, Green C, Xu G, Denovan-Wright EM, Rising AC, Fromholt SE, Brown HH, Swing D, Mandel RJ, Tessarollo L, Borchelt DR. Transgenic mice expressing caspase-6-derived N-terminal fragments of mutant huntingtin develop neurologic abnormalities with predominant cytoplasmic inclusion pathology composed largely of a smaller proteolytic derivative. Hum Mol Genet. 2011;20:2770–2782. doi: 10.1093/hmg/ddr176. [DOI] [PMC free article] [PubMed] [Google Scholar]
- Trushina E, Heldebrant MP, Perez-Terzic CM, Bortolon R, Kovtun IV, Badger JD, 2nd, Terzic A, Estévez A, Windebank AJ, Dyer RB, Yao J, McMurray CT. Microtubule destabilization and nuclear entry are sequential steps leading to toxicity in Huntington's disease. Proc Natl Acad Sci U S A. 2003;100:12171–12176. doi: 10.1073/pnas.2034961100. [DOI] [PMC free article] [PubMed] [Google Scholar]
- Van Raamsdonk JM, Pearson J, Rogers DA, Bissada N, Vogl AW, Hayden MR, Leavitt BR. Loss of wild-type huntingtin influences motor dysfunction and survival in the YAC128 mouse model of Huntington disease. Hum Mol Genet. 2005;14:1379–1392. doi: 10.1093/hmg/ddi147. [DOI] [PubMed] [Google Scholar]
- Walker FO. Huntington's disease. Lancet. 2007;369:218–228. doi: 10.1016/S0140-6736(07)60111-1. [DOI] [PubMed] [Google Scholar]
- Wellington CL, Ellerby LM, Gutekunst CA, Rogers D, Warby S, Graham RK, Loubser O, van Raamsdonk J, Singaraja R, Yang YZ, Gafni J, Bredesen D, Hersch SM, Leavitt BR, Roy S, Nicholson DW, Hayden MR. Caspase cleavage of mutant huntingtin precedes neurodegeneration in Huntington's disease. J Neurosci. 2002;22:7862–7872. doi: 10.1523/JNEUROSCI.22-18-07862.2002. [DOI] [PMC free article] [PubMed] [Google Scholar]
- Wheeler VC, White JK, Gutekunst CA, Vrbanac V, Weaver M, Li XJ, Li SH, Yi H, Vonsattel JP, Gusella JF, Hersch S, Auerbach W, Joyner AL, MacDonald ME. Long glutamine tracts cause nuclear localization of a novel form of huntingtin in medium spiny striatal neurons in HdhQ92 and HdhQ111 knock-in mice. Hum Mol Genet. 2000;9:503–513. doi: 10.1093/hmg/9.4.503. [DOI] [PubMed] [Google Scholar]
- Xia J, Lee DH, Taylor J, Vandelft M, Truant R. Huntingtin contains a highly conserved nuclear export signal. Hum Mol Genet. 2003;12:1393–1403. doi: 10.1093/hmg/ddg156. [DOI] [PubMed] [Google Scholar]
- Yanai A, Huang K, Kang R, Singaraja RR, Arstikaitis P, Gan L, Orban PC, Mullard A, Cowan CM, Raymond LA, Drisdel RC, Green WN, Ravikumar B, Rubinsztein DC, El-Husseini A, Hayden MR. Palmitoylation of huntingtin by HIP14 is essential for its trafficking and function. Nat Neurosci. 2006;9:824–831. doi: 10.1038/nn1702. [DOI] [PMC free article] [PubMed] [Google Scholar]
- Zhang J, Peng Q, Li Q, Jahanshad N, Hou Z, Jiang M, Masuda N, Langbehn DR, Miller MI, Mori S, Ross CA, Duan W. Longitudinal characterization of brain atrophy of a Huntington's disease mouse model by automated morphological analyses of magnetic resonance images. Neuroimage. 2010;49:2340–2351. doi: 10.1016/j.neuroimage.2009.10.027. [DOI] [PMC free article] [PubMed] [Google Scholar]