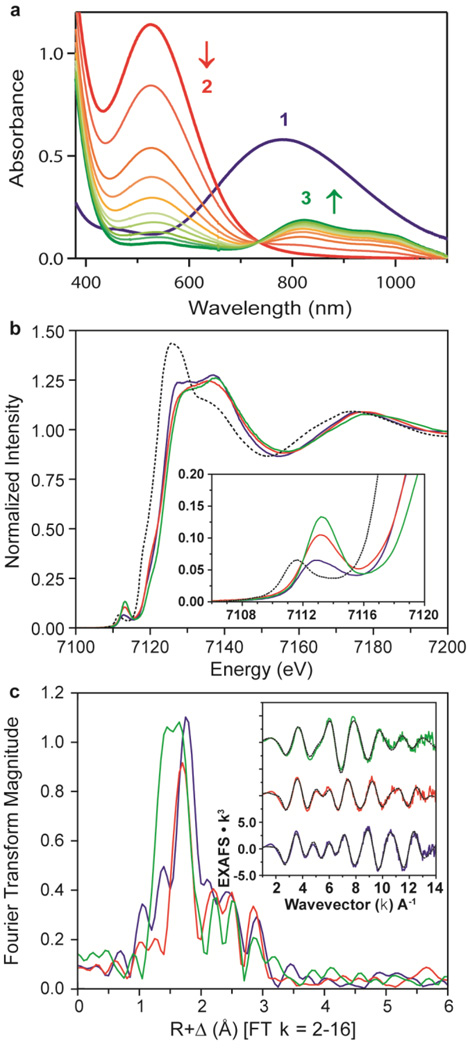
Figure 2. Ultraviolet–visible spectra and XAS data of 1, 2 and 3.
In a–c, data for 1, 2 and 3 are shown respectively in blue, red and green. a, Ultraviolet–visible spectra of 1, 2 and 3; arrows indicate spectral changes for the conversion of 2 to 3 in the reaction of 1 (1 mM) and 3 equiv. HClO4 in acetone/CF3CH2OH (3:1) at −40 °C. b, Main panel, Fe K-edge XAS data; inset, expanded pre-edge region. Dotted black line shows starting material, high-spin [Fe(II)(TMC)]2+, for reference. c, Main panel, Fourier transform of EXAFS data (k = 2-16); inset, EXAFS data (solid lines) with final fits (dashed lines). These data show striking differences across the series, most of which are the result of changes to the first coordination sphere.

