

Abstract
Rex1 (zfp42) was identified by our laboratory because of its reduced expression in F9 teratocarcinoma stem cells after retinoic acid (RA) treatment. The Rex1 (Zfp42) gene is currently widely used as a marker of embryonic stem cells. We compared the transcriptional regulation of the human Rex1 gene in NTera-2 (NT-2) human teratocarcinoma, normal human prostate epithelial cells (PrEC), and prostate cancer cells (PC-3) by promoter/luciferase analyses. Oct4, Sox2, Nanog, and Dax1 transcripts are expressed at higher levels in NT-2 and PrEC cells than in PC-3 cells. Co-transfection analyses showed that YY1 and Rex1 are positive regulators of hRex1 transcription in NT-2 and PrEC cells, whereas Nanog is not. Serial deletion constructs of the hRex1 promoter were created and analyzed, by which we identified a potential negative regulatory site that is located between -1kb to -0.4 kb of the hRex1 promoter. We also delineated regions of the hRex1 promoter between -0.4 kb and the TSS that, when mutated, reduced transcriptional activation; these are putative Rex1 binding sites. Mutation of a putative Rex1 binding site in electrophoretic mobility shift assays (EMSA) resulted in reduced protein binding. Taken together, our results indicate that hRex1 binds to the hRex1 promoter region at -298 bp and positively regulates hRex1 transcription, but that this regulation is lost in PC-3 human prostate cancer cells. This lack of positive transcriptional regulation by the hRex1 protein may be responsible for the lack of Rex1 expression in PC-3 prostate cancer cells.
Keywords: stem cells, Rex1 (zfp42), differentiation, transcription, carcinoma, retinoic acid, retinoid, teratocarcinoma, epigenetics
INTRODUCTION
Two characteristics that distinguish embryonic stem (ES) cells from somatic cells are self-renewal and pluripotency. Self-renewal is defined as the ability of ES cells to replenish themselves, whereas pluripotency means that ES cells can differentiate into cells of various lineages (Smith, 2001). The characteristic of ES cell pluripotency, in particular, has attracted a great deal of attention in the field of regenerative medicine, since differentiated cells arising from ES cells may help with the problem of the lack of enough donor organs for transplantation. The directed differentiation of human ES cells into many different cell types (for rev. (Donovan and Gearhart, 2001; Loebel et al., 2003; Pera et al., 2000)) is a potential solution for this problem.
The molecular mechanisms underlying the maintenance of ES cell self-renewal have been studied extensively for the past decade. These studies have been divided into two main areas: one area focuses on the complex mechanisms of transcriptional regulation of the essential transcription factor network required for stem cell self-renewal, and the other area concentrates on the roles of various epigenetic modifications in this process (Boyer et al., 2006; Kashyap et al., 2009; Lee et al., 2007; Lee et al., 2006; Pan et al., 2007). Transcription factors, such as Pou5f1a (Oct4), Sox2, and Nanog, have been shown to be indispensable for self-renewal, and the loss of any one of these transcription factors results in ES cell differentiation (Chambers et al., 2003; Loh et al., 2006; Masui et al., 2007; Nichols et al., 1998; Takahashi et al., 2007; Wang et al., 2006; Yu et al., 2007). Recently, global promoter analyses, mainly by ChIP (chromatin immunoprecipitation) on chip, have shown that the sequences of the target gene promoter regions of these three transcription factors have some similarities, indicating very intricate transcriptional regulation and feedback mechanisms (Boyer et al., 2005; Kim et al., 2008; Pan et al., 2006). Certain transcription factors regulate their own expression by binding to their promoter regions, indicating another level of gene expression regulation (Boyer et al., 2005; Kim et al., 2008; Pan et al., 2006).
The Rex1 (zfp42) gene, which encodes a protein that is a member of the zinc finger protein family including YY1 (Kim et al., 2007), was identified by our laboratory. Rex1 is widely used as one of seven markers of human and murine ES cells (30). Furthermore, Rex1 has been shown to be one of only three markers that can distinguish between the fully reprogrammed state of induced pluripotent stem cells (true iPS cells) and partially reprogrammed cells (Chan et al., 2009). Rex1 mRNA level decreases upon treatment of murine F9 teratocarcinoma stem cells with retinoic acid (RA), an active form of vitamin A (Ben-Shushan et al., 1998; Hosler et al., 1989; Hosler et al., 1993). We showed that, during embryogenesis, high Rex1 mRNA expression is limited to preimplantation embryos and the trophoblast (Rogers et al., 1991). Using RT-PCR analysis, we demonstrated that Rex1 mRNA is detected primarily in embryonic stem cells, embryonal carcinoma cells, and in many normal epithelial cells, such as cultured normal human epithelial keratinocytes (HEKA), normal human bronchial epithelial cells, and normal prostate epithelial cells (Mongan and Gudas, 2007; Mongan et al., 2006; Rogers et al., 1991). In addition, Rex1 is expressed in adult CD34+ hematopoietic progenitor cells (Goolsby et al., 2003). The biological functions of Rex1 are not fully understood (Scotland et al., 2009; Xu et al., 2008).
Rex1 transcriptional regulation has been investigated in our laboratory primarily in the murine ES cell system. An Oct4 binding site was identified in the murine Rex1 promoter region and mutation of this binding site reduced murine Rex1 promoter activity, which indicates that the Oct4 protein is a positive regulator of murine Rex1 mRNA expression (Ben-Shushan et al., 1998; Hosler et al., 1993; Rosfjord and Rizzino, 1994). Rex1 was identified as a target gene of both Oct4 and Nanog by chromatin immunoprecipitation (ChIP) analysis (Boyer et al., 2005; Loh et al., 2006) which supports the hypothesis that Rex1 is a member of the transcriptional network in ES cells (Kim et al., 2008; Wang et al., 2006). More recently, Shi et al demonstrated that Nanog and Sox2 are positive regulators of the murine Rex1 gene in mouse ES cells (32). Mutations in the binding sites of these transcription factors in the Rex1 promoter decreased mouse Rex1 promoter activity (Shi et al., 2006).
The transcriptional regulation of the human Rex1 gene has not been studied. To gain insight into the expression of the human Rex1 gene we performed RT-PCR analysis and found that hRex1 mRNA expression was significantly reduced or lost in most human cancer cell lines, including the prostate cancer lines PC-3 and LNCaP and renal cancer specimen (Mongan et al., 2006). Mongan et al. (Mongan et al., 2006) also demonstrated that the Rex1 gene was expressed in most cultured normal human epithelial cells, suggesting that the loss of Rex1 gene expression was either a cause or the result of the neoplastic transformation of the cells (Raman et al., 2006). However, the mechanism by which human Rex1 expression is reduced in many types of human cancers has not been elucidated.
We investigated the transcriptional regulation of the human Rex1 gene in normal human prostate epithelial cells and in the prostate cancer cell line PC-3. We hypothesized that transcriptional dysregulation is partly responsible for the reduced expression of human Rex1 mRNA in human prostate cancer cells. To test this hypothesis, we identified and characterized several transcriptional regulatory regions in the human Rex1 promoter.
MATERIALS AND METHODS
Materials
Unless stated, all materials were purchased from Sigma Aldrich (St. Louis, MO, USA).
Cell culture
The human NTera-2 cell line, NTera-2 cl. D1 (NT-2), the prostate cancer cell line PC-3, and normal prostate epithelial cells (PrEC, Lonza, Basel, Switzerland) were grown in monolayer and maintained as follows: NT-2 cells were cultured in Dulbecco’s modified Eagle’s medium supplemented with 10 % fetal calf serum (Invitrogen, Carlsbad, CA, USA) in a 5 % CO2 incubator at 37°C. PC-3 cells were cultured in RPMI1640 medium supplemented with 10 % fetal calf serum in a 10 % CO2 incubator at 37°C. PrEC were grown in PREBM media supplemented with growth factors provided by the manufacturer (Lonza, Basel, Switzerland). In addition, PrEC were trypsinized using the kit provided by the manufacturer (Lonza, Basel, Switzerland). Cells were cultured for the indicated times and then total RNA was isolated.
Construction and Cloning of Plasmids
The human Rex1 (hRex1) promoter region 1.6 kb upstream from the transcription start site was amplified. Genomic DNA extracted from the normal human mammary epithelial cells was used as a template with the hRex1F1 forward primer, 5’-ACT GGT ACC TCG GAT TTC AAA TGG AGA GGT CCT GC-3’ and the hRex1R2 reverse primer, 5’-AAT CTG GCT AGC AGT GGA AAC GTG GAC TGC CCT GCG-3’. PCR was performed using Pfx (Invitrogen, Carlsbad, CA, USA) polymerase to amplify the 1.6 kb fragment. The fragment then was digested with restriction enzymes Kpn I and Nhe I and inserted into the pGL3-Basic vector (Promega, Madison, WI, USA). This construct was named pGL3-hRex1-1.6. Serial deletion constructs of 1.4 kb, 1.0 kb and 0.4 kb were created by PCR using pGL3-hRex1-1.6 as a template and different 5’ forward primers (5’-ACT GGT ACC TGT AAT CCC AGC TAC TGG GGA GGC-3’, 5’-ACT GGT ACC AAT AGT GAG CGT TGA CTG ACC GC-3’ and 5’-ACT GGT ACC TTA CAC CCA CGC GTA TTT GTT CAA-3’, respectively) and hRex1R2 as a reverse primer. Two additional constructs were created from these serial deletion constructs. pGL3-hRex1-0.4 was digested with Apa I and Kpn I and a 185 bp fragment was removed. The remainder was treated with Klenow enzyme to produce blunt ends and then was self-ligated to create pGL3-hRex1-0.21. pGL3-hRex1-0.13 was created by PCR using pGL3-hRex1-0.21 as a template. The structures of these serial deletion constructs are shown (Fig. 2A).
Fig. 2.

(A) Maps of Promoter Deletion Constructs of the Human Rex1 Promoter. Genomic DNA was isolated from human mammary epithelial cells (HMEC) and used as a template to amplify the human Rex1 promoter region of 1.6 kb.A1.6 kb PCR product was cloned into the pGL3-Basic vector and named pGL3-hRex1-1.6 kb. The other five serial deletion constructs, hRex1-1.4 kb, hRex1-1.0 kb, hRex1-0.4 kb, hRex1-0.2 kb and hRex1-0.13 kb, were generated from hRex1-1.6 kb by performing PCR. The sequence of each construct was confirmed by DNA sequencing. (B) Control Level of hRex1 Promoter Activity. The luciferase activity of the hRex1-1.6 promoter construct was measured to compare the levels of the hRex1 promoter activity among three cell types. The hRex1-1.6 promoter construct was transfected into each cell line along with the Renilla luciferase (pTK-RL) as an internal control. After 24 hours, media were changed and cells were incubated for an additional 48 hr. Cells were harvested and extracts were used for the dual luciferase assay. The luciferase activities were normalized to that in NT-2 cells. (C) hRex1 Promoter Activity Analysis of Serial hRex1 Promoter Deletion Constructs. Six hRex1 promoter constructs were transfected into each cell line along with the Renilla luciferase (pTK-RL) as an internal control. The luciferase activities of the deletion constructs were normalized to the hRex1-1.6 control group and presented as a relative level of luciferase activity. Transfections were repeated at least three times starting with fresh cells and the data are presented as the mean WS.E.M. (MUp < 0.05, one way Anova, comparison among groups to hRex1-1.6).
The hRex1 ΔATTA promoter mutant construct was created by the following protocol. The hRex1-1.6 kb fragment was amplified by PCR and digested with Cla I to generate 580 bp of 5’ end product. This 580 bp product was blunt-ended by Klenow treatment, followed by Kpn I digestion and in parallel, pGL3-hRex1-0.4 kb was digested with Mlu I and blunt-ended by Klenow treatment. The product then was digested with Kpn I and ligated with the 580 bp 5’ end product from the hRex1-1.6 kb construct.
The ΔATTA 0.2 construct was made by the following protocol. The pGL3-Basic and the pGL3-hRex1-1.0 kb fragment were digested with Kpn I and Mlu I. The 0.6 kb fragment produced from Kpn I/Mlu 1 digested pGL3-hRex1-1 kb was then ligated with Kpn I/Mlu I digested pGL3-Basic, creating ΔATTA 0.6. Then, ΔATTA 0.6 was digested with Mlu I, followed by Klenow treatment. The pGL3-hRex1-0.4 kb construct was digested with Sma I and the 0.2 kb Sma I digested fragment was isolated and ligated to the Mlu I/Klenow treated ΔATTA 0.6 fragment to generate the ΔATTA 0.2 construct (Fig. 3A).
Fig. 3.

(A) Maps of Mutant Constructs of The Human Rex1 Promoter. Mutant constructs were generated using deletion constructs as templates; DATTA was created by removing the -1.0 kb to _0.4 kb region of the hRex1-1.6 kb construct and DATTA 0.2 was created by deletion of the _0.4 kb to -0.2 kb of the hRex1-1.0 construct. Site-directed mutagenesis was performed to replace the putative Tcf1A/IRF1,2 and Cdx/Nanog binding sites to generate the Mut1 and Mut2 constructs. DTcfCdx1 was created by a deletion covering both binding sites. The sequence of each construct was confirmed by sequencing. (B) Promoter Activity Analysis of hRex1 Mutant Constructs. Human Rex1 promoter mutants were cloned into the pGL3-Basic vector. These constructs were transfected into each cell line with a Renilla luciferase (pTK-RL) as an internal control. Twenty four hr after transfection, media were changed and fresh media added. Cell extracts were harvested after 48 hours for the dual luciferase assays. The luciferase levels were normalized to the hRex1-1.6 sample and presented as the relative level of luciferase activity. Transfections were performed at least three times, starting with cells in culture, and the data are presented as mean WS.E.M. (MUp < 0.05, one way Anova, comparison among groups against hRex1-1.6). [Color figure can be viewed in the online issue, which is available at www.interscience.wiley.com.]
Full length cDNAs encoding human Rex1 (Accession No. NP777560), Nanog (Accession No. NM024865), and YY1 (Accession No. NP003394.1) were subcloned into the pSG5 expression vector (Stratagene, La Jolla, CA, USA), and protein expression from these vectors was confirmed by Western blotting. These constructs were then used for various co-transfection studies. The DNA sequences of the products were confirmed by sequencing.
Site-directed mutagenesis
Mutations in the hRex1 promoter constructs were created by site-directed mutagenesis using Phusion DNA polymerase following the manufacturer’s protocol (Finnzymes, Espoo, Finland). pGL3-hRex1-1.4 mut1 and mut2 were created by site-directed mutagenesis, changing a putative Tcf1A/IRF1,2 site (AAAGTGA → CCCTCCG) and a Cdx2/Nanog site (CATTAAT → TCGCCGC), using the pGL3-hRex1-1.4 construct as a starting template. pGL-hRex1-1.4 ΔTcfCdx1 is a deletion of both binding sites created by PCR using pGL3-hRex1.4 as a template, and 5’-GACTGTAGCCAATAGTGAGCGTTGACTGACCATTAAAAAAGAAAACAAACAC TGGGGGTGTTTGAAAC-3’ forward and 5’-GTTTCAAACACCCCCAGTGTTTGTTTTCTT TTTTAATGGTCAGTCAACGCTCACTATTGGCTACAGTC-3’ reverse primers (Fig. 3A).
The pGL3-hRex1-0.4 mut 1 to mut 5 constructs were created using pGL3-hRex1-0.4 as a starting template (Fig. 5A). rVista/TESS/Matinspector programs (http://rvista.dcode.org, http://www.cbil.upenn.edu/cgi-bin/tess/tess, http://www.genomatix.de/products/MatInspector) were used to analyze transcription factor binding sites and the binding sequences for each transcription factor were obtained from the literature ((Kaplan et al., 2005; Kim et al., 2007; Loh et al., 2006; Mitsui et al., 2003; Shrivastava and Calame, 1994; Yant et al., 1995; Zhang et al., 2006) and [Zhang et al, unpublished]). The hRex1-0.4 mut 1 construct was made by changing a Nanog binding site at -389 bp from ATTAC to ACCAC. The hRex1-0.4 mut 2 construct was produced by changing a potential Rex1/YY1 binding site at -362 bp from GACATTTA to GATGGTTA. The hRex1-0.4 mut 3 and mut 4 constructs were created by changing potential Rex1 binding sites at -333 bp from ACGCC to ACGAA (mut 3) and at -298 bp from TGGCGG to TAGCAG (mut 4). The hRex1-0.4 mut 5 construct was created by switching a Nanog binding site at -48 bp from ATTAG to AGGAG. The detailed sequences of the primers are listed (Table 1). All plasmid DNAs were isolated using an Endo-free Maxi Prep kit (QIAGEN, Valencia, CA, USA).
Fig. 5.
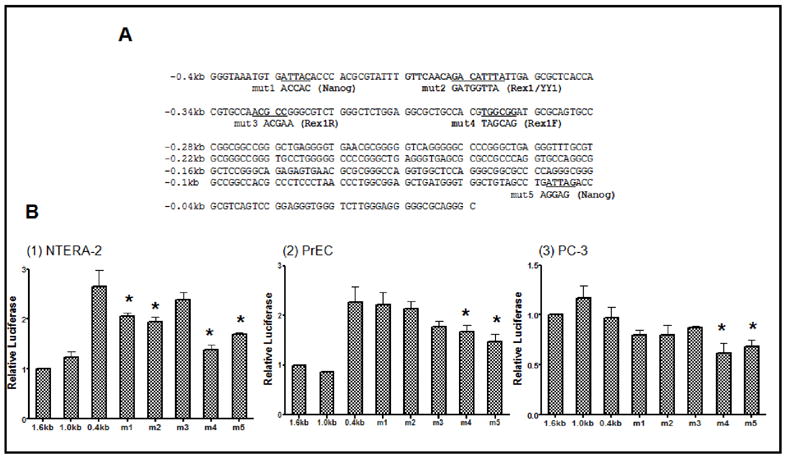
(A) Sequences of The Human Rex1-0.4 kb Construct and Generation of Mutant Constructs. Five different hRex1-0.4 kb mutant constructs were created by site-directed mutagenesis using the pGL3-hRex1-0.4 kb as a template. Mut1 was created by mutation of a potential Nanog binding site (Mitsui et al., 2003; Loh et al., 2006) locating on -390 to -380, and mut2 for potential Rex1/YY1 binding site located between −370 to -355 (Shrivastava and Calame, 1994; Yant et al., 1995; Kim et al., 2007), [Zheng, unpublished] mut3 for a reverse Rex1 binding site located between −340 to -325 (Zhang et al., 2006), mut4 for a forward Rex1 binding site on located between −300 to -290 and mut5 for a Nanog binding site (Mitsui et al., 2003; Loh et al., 2006) located between −50 to -40 of hRex1 promoter region. All five mutant constructs were sequenced to confirm the base changes. (B) Promoter Activity Analysis of hRex1 0.4 kb Mutant Constructs The human Rex1 0.4 kb promoter mutants were cloned into the pGL3-Basic vector. These constructs were transfected into each cell line along with the Renilla luciferase (pTK-RL) as an internal control. Twenty four hr after transfection, media was changed and fresh media added. Cell extracts were harvested after 48 hours for dual luciferase assays. The luciferase levels were normalized to hRex1-1.6 and presented as a relative level of luciferase activity. Transfections were performed at least three times and the data are presented as the mean WS.E.M. (MUp < 0.05, one way Anova, samples compared to hRex1-1.6).
Table 1.
Primers Sequences Used for Reverse Transcription Polymerase Chain Reaction
| Common Name | Sequence* | Product size (bp) | GeneBank accession no. |
|---|---|---|---|
| Oct3/4 F | 5’-AGT GAG CAA CCT GGA GA-3’ | 450 | NM002701 |
| Oct3/4 R | 5’-CAA AAA CCC TGG CAC AAA CT-3’ | ||
| Sox2 F | 5’-CAT CAC CCA CAG CAA ATG AC-3’ | 306 | NM003106 |
| Sox2 R | 5’-TTT TTC GTC GCT TGG AGA CT-3’ | ||
| Nanog F | 5’-TCT TCC TTC CTC CAT GGA TCT-3’ | 486 | NM024865 |
| Nanog R | 5’-AGG ACT GGA TGT TCT GGG TCT-3’ | ||
| Foxd3 F | 5’-GTC GTT CAG CAT CGA GAA CA-3’ | 442 | NM012183 |
| Foxd3 R | 5’-AAA TTG GGG AGA GGC AGA GT-3’ | ||
| YY1 F | 5’-AGA TCA TTG GAG AGA ACT CAC CTC-3’ | 658 | NP003394.1 |
| YY1 R | 5’-ACA TGT CCC TTA GGT GTG TAG GAT-3’ | ||
| Dax1 F | 5’-GAG TCT GAA CAT CAG TAC CAA GGA-3’ | 366 | NM_000475 |
| Dax1 R | 5’-GCT CTT TAT TCT TCC CTC ATG GTG-3’ | ||
| Klf4 F | 5’-AGA TGT CTA AGG AGC TGG TTG AGT-3’ | 334 | NM_012310 |
| Klf4 R | 5’-GTA CGC TCT GTG GAT TCC TTT AGT-3’ | ||
| cMyc F | 5’-GGG GCT TTA TCT AAC TCG CTG TAG-3’ | 472 | NC_000008 |
| cMyc R | 5’-AGT CGT AGT CGA GGT CAT AGT TCC-3’ | ||
| Nac1 F | 5’-CTT ATC AAC CAG ATT GGG AAC C-3’ | 304 | NM_052876 |
| Nac1 R | 5’-GTT TCA CTG ATG AAG GTG GTG TAG-3’ | ||
| Rex1 E1F | 5’-GTT TGG GAG GAG GTG GCA TTG G-3’ | NP777560 | |
| Rex1E2F | 5’-GCT GAC CAC CAG CAC ACT AGG C-3’ | ||
| Rex1E3F | 5’-GAA GAG GCC TTC ACT CTA GTA GTG-3’ | ||
| Rex1E4R | 5’-CTT CCA GGA TGG GTT GAG AA-3’ | ||
| Gapdh F | 5’-AGCCACATCGCTCAGACAC-3’ | 472 | NM_002046 |
| Gapdh R | 5’-GAGGCATTGCTGATGATCTTG-3’ |
All of these primers are for human genes and most of them (except Sox2 and Foxd3 those consist of only one exon) were designed to span an intron so that they will not detect any genomic DNA that could contaminate the RNA preparations.
Transient transfections and Luciferase assays
Transient transfections were performed following the manufacturer’s protocol (Roche, Basel, Switzerland). Briefly, 3-5 × 10⁵ cells were plated on 60 mm plates the day before transfection. On the day of the transfection 9 μl of Fugene (Roche, Basel, Switzerland) was added in 191 μl of media and incubated for 5 min at room temperature. Then, 3 μg of DNA (firefly luciferase construct: Renilla luciferase=20:1) was added and the mixture was incubated for 20 min at room temperature to form DNA-lipid complexes. Firefly luciferase constructs containing the various hRex1 promoter fragments were transfected, and the Renilla luciferase (pTK-RL) construct was also transfected to normalize the transfection efficiencies. Then the complexes were added to the cells and the cells were incubated for 24 hrs. Culture media was removed, and fresh culture medium was added. The cells were cultured for an additional 48 hrs. Cells were washed twice with cold PBS (pH 7.4) and cell lysates were prepared by adding 500 μl 1× passive lysis buffer (Promega, Madison, WI, USA). Lysates were subjected to a freezing and thawing cycle and the protein supernatant was collected for the dual luciferase assays. Cell extract (20-40 μl) was used for each assay in duplicate. Protein concentration was measured by using the DC protein assay kit (Bio-Rad, Hercules, CA) so that the same amount of protein in each sample was assayed. At least three independent transfections were performed, starting with fresh cell cultures, for each data point. For transcription factor co-transfection analysis, a full length cDNA for each transcription factor, subcloned into the pSG5 expression vector (Stratagene, La Jolla, CA), was transfected with one of three hRex1 promoter constructs, with the ratio between the hRex1 promoter construct and the expression vector driving transcription factor expression at 1:5. As a control, a hRex1 promoter construct was co-transfected with the pSG5 parent vector and again, a Renilla luciferase construct was co-transfected to normalize for differences in the transfection efficiencies.
Statistical analyses
At least three independent experiments were performed for each result and statistical analyses were carried out as follows. One-way Anova was applied to analyze the data using SPSS software (Chicago, IL, USA), and a p value of less than 0.05 was considered as statistically significant.
Reverse transcription polymerase chain reaction (RT-PCR)
NT-2, PC-3, and PrEC cells were plated on 100 mm plates and cells were treated with RA at a final concentration of 1μM for 48 hours. Cells were washed twice with cold PBS (pH 7.4). Trizol reagent (1ml) was added to each plate and the cells were harvested. Total RNA was isolated following the manufacturer’s protocol (Invitrogen, Carlsbad, CA, USA). A total of 2 μg of RNA was reverse transcribed to cDNA by Superscript II reverse transcriptase (Invitrogen, Carlsbad, CA, USA). RNA was incubated at 42°C for 50 min and then incubated at 70°C for 20 min to terminate the reaction. Then, 2 μl of 1:5 diluted cDNA was used to perform PCR. The annealing temperature varied from 58°C to 60°C, depending on the primers used. The primers are listed (Table 2).
Table 2.
Primers Sequences Used for Site-Directed Mutagenesis
| Name | Sequences |
|---|---|
| NYR-A mut1F | 5’-TCT CTA TCG ATA GGT ACC CCA CAC CCA CGC GT-3’ |
| NYR-A mut1R | 3’-ACG GTC TTG TAA AGA GAT AGC TAT CCA TGG-5’ |
| NYR-A mut2F | 5’-ACG CGT ATT TGT TCA ACA GAT GGT TAT TGA GCG C-3’ |
| NYR-A mut2R | 3’-TGG AAT GTG GGT GC GCA TAA ACA AGT TGT CT-5’ |
| Rex1B mut1F | 5’-GCT CAC CAC GTG CCA ACG AAG GGC GTC TGG G-3’ |
| Rex1B mut1R | 3’-TAA ATA ACT CGC GAG TGG TGC ACG GTT GC-5’ |
| Rex1B mut2F | 5’-CTG GAG GCG CTG CCA CGT AGC AGA TGC GCA GTG-3’ |
| Rex1B mut2R | 3’-CGC AGA CCC GAG ACC TCC GCG ACG GTG CA-5’ |
| NYR-B mut1F | 5’-GAT GGG TGG CTG TAG CCT GAG GAG ACC GCG TCA G-3’ |
| NYR-B mut1R | 3’-ACC GCC TCG ACT ACC CAC CGA CAT CGG ACT-5’ |
Electrophoretic Mobility Shift Assays (EMSAs)/Gel Shift Assays
Nuclear extracts of NT-2, PC-3 and PrEC cells were prepared by modifying the previous protocol slightly (Thompson and Gudas, 2002). Cells were plated on 150 mm plates until confluent, then washed twice with cold PBS (pH 7.4), and harvested by centrifuging at 2,000 rpm for 5 min at 4°C. Cell pellets were resuspended in 5 volumes of buffer A (10 mM HEPES-KOH, pH 7.9, 10 mM KCl, 1.5 mM MgCl2, 0.5 mM DTT, 0.2 mM PMSF, 1X protease inhibitor cocktail (Roche, Basel, Switzerland)) and incubated on ice for 30 min. Cells were then vortexed vigorously for 20 sec to break the cell membranes and centrifuged at 14,000 rpm for 5 min to obtain a pellet. These nuclear pellets were resuspended in an equal volume of buffer B (20 mM HEPES-KOH, pH 7.9, 420 mM NaCl, 1.5 mM MgCl2, 0.2 mM EDTA, 25 % glycerol, 0.5 mM DTT, 0.2 mM PMSF, 1X protease inhibitor cocktail (Roche, Basel, Switzerland)) and incubated on ice for 30 min to break the nuclear membrane. Nuclear extracts were prepared by centrifugation at 12,000 rpm for 5 min at 4°C, and the supernatant was saved. Protein concentrations were measured with the DC protein assay kit (cat# 500-0114, Bio-Rad, Hercules, CA, USA).
Oligonucleotides for putative transcription binding sites (Fig. 6A) were annealed and labeled with [α-32P]-dCTP using Klenow polymerase. Each probe (50,000 cpm) was incubated with 5 μg of nuclear extract in binding buffer for 20 min at room temperature (50 mM HEPES, pH 7.9, 300 mM KCl, 5 mM MgCl2, 2.5 mM EDTA, 5 mM DTT, 50 % glycerol) using 1 μg of poly dI-dC as non-specific DNA. For the competition assays nuclear extracts were incubated with 100 × unlabeled competitor without a labeled probe for 20 min on ice prior to following the protocol described above. The complexes were then run on a 5 % polyacrylamide gel in 0.5X TBE buffer (44.5mM Tris, 44.5 mM Boric acid, 1mM EDTA). The signals were detected and quantitated by phosphorimager exposure. The primer sequences used for the gel shift assays are shown (Table 3).
Fig. 6.

(A) Location and Sequences of Binding Probes hRex1-0.4 kb to 0.0 kb. The sequences of two binding probes are underlined and the specific binding sites are indicated by the boxes. (B) Electrophoretic Mobility Shift Assays. Putative Nanog, Rex1, or YY1 binding sites, (Nanog/YY1/Rex1A) or Rex1 binding site (Rex1B) are found between -0.4 kb to -0 kb in the hRex1 promoter region. The binding sites were labeled by -[32P]-dCTP.5mg of nuclear extract of each cell line was incubated with the radio-labeled probe and the reactions were separated on 5% acrylamide gel in 0.5X TBE buffer. For the competition assays, 100X unlabeled oligonucleotide was incubated before adding the labeled probeonice. These experiments were performed at least three times and the data were reproducible. One representative experiment is shown. (1), (2). 1, 4, 7: free probe, 2, 5, 8: probe R nuclear extract, 3, 6, 9: probe R nuclear extract R100X wt unlabeled competitor, (3). 1, 6, 11: freeprobe, 2, 7, 12: probe R nuclear extract, 3, 8, 13: probe R nuclear extract R100X wt unlabeled competitor, 4, 9, 14: probe R nuclear extract R100X mut1 unlabeled competitor, 5, 10, 15: probe R nuclear extract R100X mut2 unlabeled competitor
Table 3.
Oligonucleotide Sequences Used for EMSA Assays
| Name | Sequences |
|---|---|
| NYR-A F | 5’- AGG GTA AAT GTG ATT ACA CCC ACG CGT ATT TGT TCA ACA GAC ATT TAT TGA G- 3’ |
| NYR-A R | 5’- AGG GCT CAA TAA ATG TCT GTT GAA CAA ATA CGC GTG GGT GTA ATC ACA TTT A- 3’ |
| NYR-A mut1F | 5’-AGG GTA AAT GTG ACC ACA CCC ACG CGT ATT TGT TCA ACA GAC ATT TAT TGA G- 3’ |
| NYR-A mut1R | 5’- AGG GCT CAA TAA ATG TCT GTT GAA CAA ATA CGC GTG GGT GTG GTC ACA TTT A- 3’ |
| NYR-A mut2F | 5’- AGG GTA AAT GTG ATT ACA CCC ACG CGT ATT TGT TCA ACA GAT GGT TAT TGA G- 3’ |
| NYR-A mut2R | 5’- AGG GCT CAA TAA CCA TCT GTT GAA CAA ATA CGC GTG GGT GTA ATC ACA TTT A- 3’ |
| Rex1B F | 5’- CGG ACG TGC CAA CGC CGG GCG TCT GGG CTC TGG AGG CGC TGC CAC GTG GCG GAT GCG CAG- 3’ |
| Rex1B R | 5’- AGG GCT GCG CAT CCG CCA CGT GGC AGC GCC TCC AGA GCC CAG ACG CCC GGC GTT GGC A- 3’ |
| Rex1B mut1F | 5’-CGG ACG TGC CAA CGA AGG GCG TCT GGG CTC TGG AGG CGC TGC CAC GTG GCG GAT GCG CAG- 3’ |
| Rex1B mut1R | 5’-AGG GCT GCG CAT CCG CCA CGT GGC AGC GCC TCC AGA GCC CAG ACG CCC TTC GTT GGC A- 3’ |
| Rex1B mut2F | 5’- CGG ACG TGC CAA CGC CGG GCG TCT GGG CTC TGG AGG CGC TGC CAC GTA GCA GAT GCG CAG- 3’ |
| Rex1B mut2R | 5’- AGG GCT GCG CAT CTG CTA CGT GGC AGC GCC TCC AGA GCC CAG ACG CCC GGC GTT GGC A- 3’ |
RESULTS
Transcript Levels of Stem Cell Marker Genes in NTera-2 (NT-2), PrEC and PC-3 cells
We first examined the transcripts for some of the stem cell markers in cultured normal human prostate epithelial cells and in prostate cancer cells. In addition, we tested NT-2, a human teratocarcinoma cell line that has some characteristics similar to those of human embryonic stem cells. To determine if there were differences in stem cell marker gene expression in NT-2, PrEC, and PC-3 cells, we analyzed the mRNA levels of various genes by reverse-transcription (RT)-PCR (Fig. 1). Oct4, Sox2, Nanog, and Foxd3 were included in our characterization of stem cell markers for pluripotency (Boyer et al., 2005; Loh et al., 2006). The genes encoding Dax1, Klf4, c-Myc and Nac1, recently found to be important as interacting partners of stem cell markers (Takahashi et al., 2007; Wang et al., 2006) were also tested. We also included the YY1 gene in our studies since portions of the amino acid sequence of YY1 protein display high similarity to that of Rex1, especially within the C-terminal zinc-finger domains (Mongan et al., 2006).
Fig. 1.
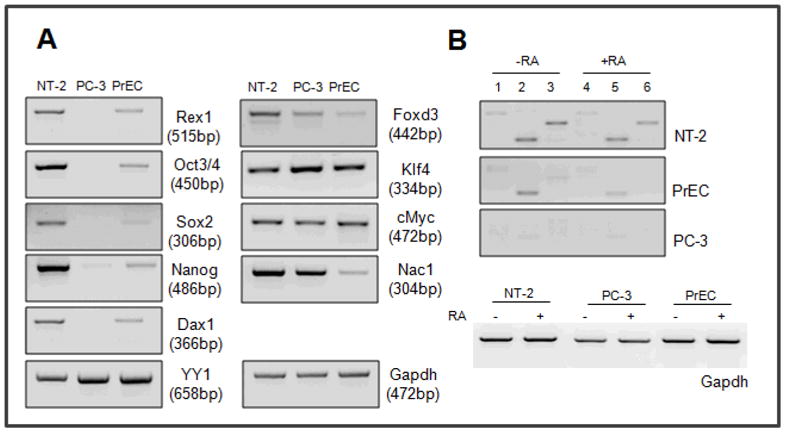
Analysis of Stem Cell Marker Gene Expression. Reverse transcription–PCR(RT-PCR). Total RNA was isolated from NT-2, PC-3 and PrEC cells and 2mg of RNA was used to make cDNA by reverse transcription. cDNA was diluted 1:5 and 2ml of the cDNA was used to perform PCR. 35 reaction cycles were used, except for GAPDH (30 cycles), and the PCR products were sequenced for confirmation of gene identity (Rex1 was amplified using E2F and E4R primers). Primers used are in Table 2. Each primer set is designed so that the set spans at least two different exons. (A) Various stem cell marker genes, (B) Rex1 transcripts (1, 4: E1F and E4R, size of product, 650 bp; 2, 5: E2F and E4R, size of product, 515 bp; and 3, 6: E3F and E4R primer, size of product, 396 bp). These experiments were performed at least three times, starting with cell culture, with very similar results. The products were sequenced to verify their identities.
The NT-2 cells expressed transcripts for all of the genes tested. Overall, the expression levels of these genes were higher in NT-2 cells than in PrEC and PC-3 cells. All ten genes were also expressed in PrEC cells (Fig.1). However, Rex1, Oct3/4, Sox2, Foxd3, Nanog, and Nac1 mRNA levels in PrEC cells were much lower than those in NT-2 cells. Transcripts for most of the stem cell markers, including Oct3/4, Sox2, Rex1 and Dax1, were not detected in the PC-3 prostate carcinoma cells, while the transcript levels of Foxd3 and Nanog were much lower in PC-3 cells than those in NT-2 (two and ten fold, respectively) and PrEC cells (similar and five fold lower, respectively) (Fig. 1a). YY1, Klf4 and c-Myc transcripts did not show significant differences in expression levels among the three cell lines.
We then investigated the effect of the drug all-trans retinoic acid (RA) on hRex1 transcription (Fig. 1B). Three different forward primers, one for each exon E1, E2, and E3, with the same reverse primer in exon 4 (E4) of the hRex1 gene were used to determine if all exons were expressed in the different cell types. In the NT-2 cells, using the E1E4, E2E4, and E3E4 primer pairs, transcripts were detected in the control samples and transcript levels were reduced upon 48 hr of RA treatment. In PrEC cells, transcripts were detected with the E1E4 and E3E4 primer pairs and again, the transcript levels were reduced by RA treatment. In PC-3 cells, no Rex1 transcripts were detected. We conclude that both NT-2 and PrEC cells express Rex1 mRNA, confirming our earlier data (Mongan et al., 2006), and that expression of Rex1 mRNA is reduced upon RA treatment.
Comparison of hRex1 Promoter Activities in a Series of Human Rex1 Promoter Fragments of Different Lengths
To understand the transcriptional regulation of Rex1 in various types of cells, we measured hRex1 promoter activity in a series of promoter constructs that contain different deletions (Fig. 2A). First, 1.6 kb 5’ region upstream of the hRex1 transcription start site was amplified by PCR using genomic DNA isolated from human mammary epithelial cell as the template. Serial deletion constructs were created as described in the methods. The hRex1 promoter activity of each promoter construct was normalized to that of the hRex1-1.6 construct in each cell line.
First, we assessed whether there were differences in hRex1 promoter activity among the three different cell types. The promoter activity of the hRex1-1.6 construct was analyzed by transient transfection/luciferase reporter assays in different cell lines and was normalized to that in NT-2 cells (Fig. 2B). In both NT-2 and PC-3 cells, hRex1-1.6 showed similar levels of promoter activity. However, the hRex1 promoter activity, as measured by the level of luciferase activity in PrEC cells, was about 40% of that in NT-2 cells (p=0.059). These data demonstrate that the basal levels of hRex1 promoter activity differ among the three cell types.
To identify important regulatory regions in the hRex1 promoter, we then determined the levels of hRex1 promoter activity in the serial hRex1 promoter deletion constructs in each cell line. In NT-2 cells the promoter activities of the hRex1-1.4 and hRex1-1.0 constructs were similar to that of the hRex1-1.6 construct (Fig. 2C-1). However, the promoter activities of the hRex1-0.4 (p<0.05), hRex1-0.21 (p<0.05), and hRex1-0.13 (p<0.05) constructs were 1.4-1.8 fold higher than those of the hRex1-1.6, hRex1-1.4, and hRex1-1.0 constructs (Fig. 2C-1).
A similar pattern was observed in PrEC cells. In the PrEC cells, hRex1 promoter activity of the hRex1-0.4 (p=0.002) and hRex1-0.21 (p=0.010) constructs was two fold higher than that observed from the hRex1-1.6, hRex1-1.4, and hRex1-1.0 constructs (Fig.2C-2). Although there was higher promoter activity in the hRex1-0.13 construct compared to the hRex1-1.6 construct, it was not statistically significant (p=0.563).
In PC-3 cells, the six hRex1 promoter constructs of different lengths showed similar activities. The hRex1-0.4 construct did not show the same increase in hRex1 promoter activity that we observed in NT-2 and PrEC cells (Fig. 2C-3).
In summary, the results of these transient transfection experiments with the hRex1 promoter constructs containing the serial deletions indicate that a potential negative regulatory DNA element is present between -1 kb and -0.4 kb within the hRex1 promoter and that this is active in NT-2 and PrEC cells. However, this negative regulatory effect was not seen in the PC-3 prostate cancer cells.
Identification of Negative Regulatory elements between -1.0 kb and -0.4 kb in the hRex1 Promoter Region
Transient transfection assays with the serially deleted hRex1 promoter constructs indicate the presence of a potential negative regulatory region between -1 kb and -0.4 kb in the hRex1 promoter (Fig. 2C). To characterize this region further we created five additional hRex1 promoter mutants (Fig. 3A). The ΔATTA is a deletion construct that lacks the -1 kb to -0.4 kb region within the hRex1-1.6 kb construct, and the ΔATTA 0.2 is another deletion construct in which the region between -0.4 kb and -0.2 kb was removed from the hRex1-1.0 kb construct.
We tested Tcf1A/IRF1,2 (-933 to -927 bp) and Cdx2/Nanog (-899 to -893 bp) as potential negative regulators that might bind within -1kb to -0.4 kb of the hRex1 promoter region. Binding sites for these two transcription factors in this region are conserved among species (Tcf1A/IRF1,2 in human and mouse, Cdx2/Nanog among human, mouse, and rat, by genome alignment (http://ecrbrowser.dcode.org), followed by searching conserved transcription factor binding sites using Transfac professional V10.2 provided in this website). Mutations in each binding site (mut1 for the Tcf1A/IRF1,2 binding site; mut2 for the Cdx2/Nanog binding site), as well as a deletion construct (ΔTcfCdx2) in which both binding sites are deleted were created by site-directed mutagenesis using hRex1-1.4 kb as a template. These five mutant constructs were analyzed by transient transfection assays to determine if mutations in these binding sites would affect hRex1 promoter activity. Since these five mutant promoter constructs were created from different hRex1 promoter constructs (ΔATTA from hRex1-1.6, ΔATTA0.2 from hRex1-1.0, and mut1, mut2, and ΔTcfCdx from hRex1-1.4), we analyzed the promoter activities of the mutant constructs by assuming that the promoter activities of the hRex1-1.6, hRex1-1.4 and hRex1-1.0 constructs were similar, based on previous data (Fig. 2C). Thus, the activities of the mutant promoter constructs were normalized to that of hRex1-1.6.
In NT-2 cells, the ΔATTA mutant construct showed approximately a two fold increase in promoter activity when compared to that of the hRex1-1.6 construct, and it is comparable to the activity of the hRex1-0.4 construct (p=0.001, Fig. 3B-1). The deletion construct ΔATTA0.2 also showed increased promoter activity compared to the hRex1-1.6 construct (p=0.015). However, the constructs with mutations in the putative Tcf1A/IRF1,2 and Cdx2/Nanog binding sites did not show increased hRex1 promoter activity (Fig. 3B-1).
In PrEC cells a similar pattern of regulation was observed. The ΔATTA (p <0.05) and ΔATTA 0.2 (p=0.002) mutant constructs showed about a three fold increase in promoter activity compared to that of the hRex1-1.6 construct. The ΔTcfCdx mutant showed about a two fold increase in hRex1 promoter activity compared to that of the hRex1-1.6 construct (p=0.046, Fig. 3B-2).
In PC-3 cells none of the mutant constructs changed the hRex1 promoter activity. The luciferase activity of the ΔATTA construct in PC-3 cells was not changed (p=0.242) when compared to that of the hRex1-1.6 construct. The luciferase activities of the other three mutant constructs, mut1, mut2, and ΔTcfCdx, showed no statistically significant changes (Fig. 3B-3).
These experiments characterized the locations of potential negative regulatory sites between -1 kb and -0.4 kb in the hRex1 promoter region. Based on these results, we conclude that Tcf1A/IRF1, 2 and Cdx2/Nanog do not function as the negative regulatory proteins that bind to this region of the hRex1 promoter.
Regulation of hRex1 Promoter Activity by Various Transcription Factors
Based on our computerized transcription factor binding site analysis we identified several potential binding sites for YY1, Rex1, and Nanog in the hRex1 promoter. The structures of these transcription factors are shown in Fig. 4a. Although mutation of a putative Nanog binding site located between -899 and -893 did not alter the hRex1 promoter activity (Fig. 3B), additional Nanog binding sites in the 1.6 kb human Rex1 promoter were identified and we wanted to determine if Nanog protein binds to the hRex1 promoter. To determine if YY1, Rex1, and/or Nanog has any effect on the transcription of the human Rex1 gene, each of the hRex1-1.6, hRex1-1.0, and hRex1-0.4 promoter constructs was co-transfected with a vector that overexpresses either YY1, Rex1 or Nanog cDNA. The promoter activity of each construct was analyzed by a dual-luciferase system as described in Methods.
Fig. 4.

(A) Structures of Rex1, YY1 and, Nanog Proteins. Rex1 and YY1 are members of the zinc finger motif transcription factor family (Kim et al., 2007). Four repeated C2H2-type zinc finger motifs are located in the C-terminal halves of the Rex1 and YY1 proteins. The DNA sequences show approximately 70% sequence homology in their C-terminal zinc-finger motif regions (Mongan et al., 2006). Nanog is a member of the homeodomain transcription factor family and the homeobox is located in the proximal N-terminal portion of the protein (Mitsui et al., 2003). (B) Cotransfection Analysis of the hRex1 Promoter. The cDNAs for human Rex1, YY1 and Nanog were cloned into the pSG5 vector and used for cotransfections with the hRex1-1.6, hRex1-1.0 and hRex1-0.4 promoter constructs, with the Renilla Luciferase (pTK-RL) co-transfected as an internal control. The ratio between the promoter fragment and a transcription factor construct was 1:5. The total amount of DNA was equalized in all samples by addition of pSG5 vector DNA. The luciferase levels were normalized to each promoter construct without the pSG5-cDNA constructs and presented as a relative level of luciferase. Transfections were performed a minimum of three times, and the data are presented as the mean WS.E.M. (MUp < 0.05, one way Anova
In NT-2 cells, cotransfection of hRex1 cDNA increased the promoter activities of all three constructs, hRex1-1.6 (p=0.029), hRex1-1.0, and hRex1-0.4, by about 1.5 to 1.8 fold compared to that in the absence of cDNA cotransfection (Fig. 4B-1). YY1 cotransfection increased the promoter activities in all three promoter constructs (p=0.002, 0.010, 0.012, respectively), and YY1 had more profound effects than Rex1 cotransfection (Fig. 4B-1). However, Nanog cDNA cotransfection did not affect the promoter activity of any of the hRex1 promoter constructs (Fig. 4B-1).
In PrEC cells, both the Rex1 and YY1 cDNAs, when cotransfected with the Rex1 promoter constructs, also increased the Rex1 promoter activity (Fig. 4B-2). Cotransfection of Rex1 cDNA had a much greater effect on the hRex1 promoter activity in PrEC cells than in NT-2 cells. The increase of the promoter activity was about 5 fold for all three hRex1 promoter constructs (p=0.013, 0.004, 0.009, respectively). Activation of the hRex1 promoter after YY1 cotransfection was about 2-4 fold higher (Fig. 4B-2). Again, Nanog cDNA cotransfection did not increase the Rex1 promoter activity (Fig. 4B-2).
In PC-3 cells neither Rex1 nor YY1 cotransfection affected the hRex1 promoter activity (Fig. 4B-3). However, cotransfection of Nanog cDNA increased the Rex1 promoter activity in PC-3 cells by 1.5 to 2 fold for all three hRex1 promoter constructs (the p value was 0.001 for hRex1-1.6, 0.002 for the hRex1-1.0 cotransfection, Fig. 4B-3).
In summary, these data indicate that Rex1 and YY1 are potential positive transcriptional regulatory proteins for hRex1 in both NT-2 and PrEC cells. Rex1 and YY1 were not active in this assay in PC-3 prostate cancer cells.
Potential Positive Regulatory Regions located between -0.4 kb and 0 kb of the hRex1 Promoter
Our co-transfection data (Fig. 4B) demonstrated positive regulation of hRex1 promoter activity by Rex1, Nanog, and YY1. Thus, we searched for binding sites for these three transcription factors between -0.4 kb and the transcription start site. We also created five mutant constructs using the hRex1-0.4 kb as a template by site-directed mutagenesis (Fig. 5A). hRex1-0.4 mut1 and hRex1-0.4 mut5 were created by mutation of the Nanog binding sites (Loh et al., 2006; Mitsui et al., 2003) located at -389 bp and -48 bp, respectively (detailed sequences are in the Methods); hRex1-0.4 mut3 and hRex1-0.4 mut4 were created by mutation of potential Rex1 binding sites (Kaplan et al., 2005; Zhang et al., 2006) located at -333 bp, and -289 bp, respectively. The hRex1-0.4 mut2 construct contains a mutation in a potential Rex1 and/or YY1 binding site ((Kim et al., 2007; Shrivastava and Calame, 1994; Yant et al., 1995) and [Zhang et al, unpublished]). The promoter activities of the hRex1-0.4 kb promoter construct and the five hRex1-0.4 mutant promoter constructs were normalized to that of the wt hRex1-1.6 construct.
In NT-2 cells the hRex1-0.4 mut1, hRex1-0.4 mut2, hRex1-0.4 mut4, and hRex1-0.4 mut5 showed a 20-50 % decrease in hRex1 promoter activity as compared to the activity of the wt hRex1-0.4 construct (p=0.011, 0.003, <0.05, <0.05, respectively, Fig.5B-1). The promoter activity of the hRex1-0.4 mut4 construct, which possesses a putative mutated Rex1 binding site, was significantly decreased compared to the activity of the wt hRex1-0.4 construct (Fig. 5B-1).
In PrECs only the hRex1-0.4 mut4 (p=0.023) and the hRex1-0.4 mut5 (p=0.004) constructs showed a significant decrease in the promoter activity (Fig. 5B-2).
Similarly, In PC-3 cells, only the hRex1-0.4 mut4 and the hRex1-0.4 mut5 constructs showed reductions in promoter activities. The two mutant constructs ((p=0.012, 0.034, respectively) had about 30% of the promoter activity as compared to the activity of the wt hRex1-0.4 construct (Fig. 5B-3).
These data suggest that Rex1 and Nanog are potential positive regulatory proteins that bind to the region between -0.4 kb and 0 kb of the hRex1 promoter. The Rex1 binding sites between -333 bp and -289 bp are important, especially in NT- 2 cells.
Identification of Potential Rex1 Binding Sites in the Human Rex1 Promoter Region Between -0.4 kb to 0 kb
To delineate the potential positive transcription factors that regulate human Rex1 transcription and their binding sites in the human Rex1 promoter region between -0.4 kb and 0 kb, we performed Electrophoretic Mobility Shift assays (EMSA) using nuclear extracts from NT-2, PrEC, and PC-3 cells. We generated five different binding probes that cover the entire region from - 0.4 kb to the transcription start site (Fig. 6A). The Nanog/YY1/Rex1A binding probe, located between -400 bp to -350 bp, contains a putative Nanog binding site at −390 bp (ATTACA) and a Rex1/YY1 binding site between -370 to -356 bp (GACATTTA). This oligonucleotide bound proteins in all three cell lines (Fig. 6B). The Rex1B binding probe, positioned between -340 and -285 bp (this probe has reverse (ACGCC) and forward (TGGCGG) Rex1 binding sites (Kaplan et al., 2005; Zhang et al., 2006)) also bound proteins in all three cell lines (Fig. 6B).
The Nanog/YY1/Rex1A binding probe showed distinct binding patterns in the three cell lines (Fig. 6B-1). One band was seen in NT-2 cells (Fig. 6B-1, arrow in lane 2) and this band was reduced after competition with unlabeled Nanog/YY1/Rex1A oligonucleotide (Fig. 6B-1, lane 3). In PC-3 cells two bands were detected (Fig. 6B-1, two arrows in lane 5). Both bands exhibited reduced intensity when unlabeled Nanog/YY1/Rex1A oligonucletoide was used as a competitor (Fig. 6B-1, lane 6). In PrEC cells two bands were observed (Fig. 6B-1, two arrows in lane 8). Again, both bands were reduced in intensity by competition with unlabeled Nanog/YY1/Rex1A oligonucletoide (Fig. 6B-1, lane 9).
The Rex1B probe bound proteins in all three cell lines (Fig. 6B-2, arrows in lanes 2, 5, 8) and the bands showed a reduction in intensity after competition with unlabeled oligonucleotide (Fig. 6B-2, lanes 3, 6, 9). We then generated two mutant Rex1B probes. Mut1 was created by changing a reverse Rex1 binding site at -333 bp from ACGCC to ACGAA and Mut2 was created by changing a forward Rex1 binding site at -298 bp from TGGCGG to TAGCAG. These mutant Rex1B oligonucleotides were then used in binding competition assays. As shown in Fig. 6B-3, the lower band remained in all three cell lines after competition with unlabeled Rex1B mut2 (Fig. 6B-3, wide arrows, lanes 5, 10, 15). However, both bands disappeared after competition with unlabeled Rex1B mut1 probe (Fig.6B-3, lane 4, 9, 14). These data indicate that the lower protein band (Fig. 6B-3, wide arrows, lane 5, 10, 15) shows protein bound specifically to the putative Rex1 sequence TGGCGG located at -298 bp.
In summary, we have identified a potential Rex1 binding site located at -298 bp of the hRex1 promoter region, and mutation of this site (hRex1-0.4 mut4 construct) decreased the promoter activity compared to that of the wt hRex1-0.4 kb promoter construct (Fig. 5B). This indicates that the hRex1 protein is a potential positive regulator of hRex1 transcription.
DISCUSSION
Previous research has identified the Rex1 gene as a stem cell marker and Rex1 mRNA is expressed in normal human epithelial cells. However, Rexl mRNA level is reduced in some types of human cancer cells (Mongan et al., 2006). In this study we analyzed the transcriptional regulation of the human Rex1 gene to assess the potential role of transcriptional dysregulation in the loss of Rex1 mRNA expression in human prostate cancer.
Stem Cell Marker Network
Over the last several years, Rex1 has been studied to understand its role as a stem cell marker in this network (Kim et al., 2008; Loh et al., 2006; Masui et al., 2007; Wang et al., 2006). Based on ChIP assays (Wang et al., 2006), Wang et al found that Rex1 is one of the interacting partners of Nanog and Oct4 in mouse J1 ES cells. They also showed that Rex1 formed complexes with itself and YY1, another zinc-finger protein. Kim et al expanded this network by bioChIP-chip assay, using both biotin tagged Nanog or Myc and a native Nanog or Myc antibody as baits. After comparing the targets from each experiment, Kim et al found nine core-transcriptional factors, including Rex1, in mouse J1 ES cells (Kim et al., 2008). They showed that the Rex1 gene is a target of Nanog, Oct4, Dax1, NacI, and Klf4. Rex1 may play an important role in protein metabolism and modification rather than in developmental processes (18). Other interesting features of the stem cell marker network are the co-occupancy of substantial numbers of target promoters, the feedforward mechanism, and the autoregulatory mechanisms (Boyer et al., 2005; Kim et al., 2008). Boyer et al (Kim et al., 2008) demonstrated that 50% of the target promoters occupied by Oct4 were also occupied by Sox2, and over 90% of these promoters were also occupied by Nanog. As an example of the feedforward mechanism, the Oct4/Sox2 complex positively regulates Nanog transcription. Kim et al confirmed autoregulatory regulation of Oct4, Sox2, Dax1, Klf4, and Nanog, but not Rex1 (Kim et al., 2008). Based on published data, we conclude that the stem cell marker network is complex and tightly regulated.
Transcriptional Regulation of Mouse Rex1
Our laboratory previously cloned the 4.5 kb upstream region of the mouse Rex1 gene, with the 3’ end of the murine Rex1 promoter construct at +23 bp. By performing Rex1 promoter/CAT assays and promoter mutation analyses, we found an octamer binding motif, ATTTGCAT, located within the region between -234 bp and -204 bp. Mutation at this site resulted in a reduction of mRex1 promoter activity, suggesting that an octamer element is required for mRex1 transcriptional activation (Hosler et al., 1993). We also showed that Oct3/4 or Oct6 cotransfection repressed mRex1 promoter activity in F9 cells and that this repression was mediated through the same octamer binding site, since when this site was mutated mRex1 promoter activity was not reduced (Ben-Shushan et al., 1998). In another study, Shi et al cloned 1529 bp of mRex1 promoter region and created four serial deletion constructs. These five constructs were cotransfected with a Nanog cDNA construct and the promoter activities were measured by luciferase assays. Shi et al found that Nanog cotransfection increased mRex1 promoter activity in P19 cells and that the Nanog binding site was located between -286 bp and -187 bp in the mRex1 promoter region. Moreover, they also showed that cotranfection of either Oct3/4 or Sox2 with a 500 bp mRex1 promoter construct increased mRex1 promoter activities in 293T cells, as well as in P19 cells (Shi et al., 2006). These studies indicated that Oct3/4, Sox2, and Nanog are potential positive regulatory proteins for mRex1 transcription (Kim et al., 2008; Loh et al., 2006; Masui et al., 2007; Wang et al., 2006). Recent studies by Sun et al showed that expression of Dax1, an orphan nuclear receptor (liver receptor homolog 1,LRH1, or Nr5a2), in mouse ES cells decreases the Rex1 promoter activity, indicating Dax1 as a negative regulatory protein for mRex1 transcription (Sun et al., 2009).
Positive Regulation of Human Rex1 (hRex1) Transcription
We focused primarily on a region in the hRex1 promoter between -0.4 kb and -0.2 kb. Since the 0.4 kb hRex1 construct showed increased hRex1 promoter activity compared to the longer promoter regions (1.6 kb, 1.4 kb, 1.0 kb) tested (Fig. 2), this small region was of a particular interest for delineating the hRex1 cis-regulatory elements. We did not identify any putative Oct3/4 binding sites in this region, though we did identify two Nanog binding sites, as well as potential Rex1 and YY1 binding sites.
Nanog is a homeobox protein that has been reported to bind the promoters of several stem cell marker genes, including the mouse Rex1 promoter (Boyer et al., 2005; Shi et al., 2006). Since Nanog was shown to regulate mouse Rex1 transcription (Shi et al., 2006), we tested whether Nanog also plays a role in human Rex1 transcription.
YY1 is a member of the Kruppel type zinc finger protein family that functions as both an activator and a repressor depending on the sequence context (Shi et al., 1997). The consensus sequence NNCCATNN or CGCCATnTT has been reported for YY1 (Kim et al., 2008; Shrivastava and Calame, 1994; Yant et al., 1995).
We showed that YY1 and Rex1 function as positive regulators of hRex1 transcription (Fig. 4B). However, cotransfection of Nanog did not alter the hRex1 promoter activities in NT-2 and PrEC cells (Fig. 4B-1, 2). Our data for the Nanog cotransfection are different from the previous research by Shi et al in which Nanog cotransfection resulted in increased murine Rex1 promoter activity in P19 cells (Shi et al., 2006). This difference may result from species differences. We analyzed the human Rex1 promoter, whereas Shi et al (Shi et al., 2006) examined the mouse Rex1 promoter and the Nanog binding site they analyzed is not conserved in the hRex1 promoter. Moreover, P19 cells, unlike ES cells and F9 cells, do not express endogenous Rex1 mRNA (Rogers et al., 1991). We also showed that Oct4 functions as a positive regulatory protein in RA treated P19 cells, but as negative regulator in F9 cells (Ben-Shushan et al., 1998). The different responses shown by Rex1, YY1, and Nanog cotransfection among the different human cell types we tested (Fig. 4B) most likely reflect additional different transcription factors present in the different cell types tested.
Differences in Human Rex1 Transcription Between Normal Prostate and Prostate Cancer
We showed that hRex1 transcription regulation by Rex1, YY1, and Nanog does not occur in human PC-3 prostate cancer cells (Fig. 4B). Cotransfection of Rex1 and YY1 positively regulated Rex1 transcription in NT-2 cells and PrEC cells, but not in PC-3. The reason for this result may be the lack of expression of other key transcription factors in PC-3 cells, such as those shown by RT-PCR in Fig. 1.
Acknowledgments
We thank the Gudas laboratory members, Dr. Kun Cai, and Dr. Yong Zhuang for scientific discussions, and Dr. Nigel Mongan for providing materials. We also thank Christopher Kelly for editorial assistance. This research was supported in part by a Department of Defense (DOD) prostate cancer fellowship to Mi-Young Lee (W81XWH-06-1-0109), a R25 fellowship to Ailan Lu (CA105012), and a grant to LJG (NIH R01 CA097543).
Abbreviations
- ChIP
chromatin immunoprecipitation
- EMSA
electrophoretic mobility shift assay
- ES
embryonic stem
- HEKA
human epithelial kerationcytes
- NT-2
NTera-2 cl. D1
- PrEC
prostate epithelial cells
- iPS
induced pluripotent stem cells
- RA
all-trans retinoic acid
- TSS
transcription start site
References
- Ben-Shushan E, Thompson JR, Gudas LJ, Bergman Y. Rex-1, a gene encoding a transcription factor expressed in the early embryo, is regulated via Oct-3/4 and Oct-6 binding to an octamer site and a novel protein, Rox-1, binding to an adjacent site. Mol Cell Biol. 1998;18(4):1866–1878. doi: 10.1128/mcb.18.4.1866. [DOI] [PMC free article] [PubMed] [Google Scholar]
- Boyer LA, Lee TI, Cole MF, Johnstone SE, Levine SS, Zucker JP, Guenther MG, Kumar RM, Murray HL, Jenner RG, Gifford DK, Melton DA, Jaenisch R, Young RA. Core transcriptional regulatory circuitry in human embryonic stem cells. Cell. 2005;122(6):947–956. doi: 10.1016/j.cell.2005.08.020. [DOI] [PMC free article] [PubMed] [Google Scholar]
- Boyer LA, Plath K, Zeitlinger J, Brambrink T, Medeiros LA, Lee TI, Levine SS, Wernig M, Tajonar A, Ray MK, Bell GW, Otte AP, Vidal M, Gifford DK, Young RA, Jaenisch R. Polycomb complexes repress developmental regulators in murine embryonic stem cells. Nature. 2006;441(7091):349–353. doi: 10.1038/nature04733. [DOI] [PubMed] [Google Scholar]
- Chambers I, Colby D, Robertson M, Nichols J, Lee S, Tweedie S, Smith A. Functional expression cloning of Nanog, a pluripotency sustaining factor in embryonic stem cells. Cell. 2003;113(5):643–655. doi: 10.1016/s0092-8674(03)00392-1. [DOI] [PubMed] [Google Scholar]
- Chan EM, Ratanasirintrawoot S, Park IH, Manos PD, Loh YH, Huo H, Miller JD, Hartung O, Rho J, Ince TA, Daley GQ, Schlaeger TM. Live cell imaging distinguishes bona fide human iPS cells from partially reprogrammed cells. Nat Biotechnol. 2009 doi: 10.1038/nbt.1580. [DOI] [PubMed] [Google Scholar]
- Donovan PJ, Gearhart J. The end of the beginning for pluripotent stem cells. Nature. 2001;414(6859):92–97. doi: 10.1038/35102154. [DOI] [PubMed] [Google Scholar]
- Goolsby J, Marty MC, Heletz D, Chiappelli J, Tashko G, Yarnell D, Fishman PS, Dhib-Jalbut S, Bever CT, Jr, Pessac B, Trisler D. Hematopoietic progenitors express neural genes. Proc Natl Acad Sci U S A. 2003;100(25):14926–14931. doi: 10.1073/pnas.2434383100. [DOI] [PMC free article] [PubMed] [Google Scholar]
- Hosler BA, LaRosa GJ, Grippo JF, Gudas LJ. Expression of REX-1, a gene containing zinc finger motifs, is rapidly reduced by retinoic acid in F9 teratocarcinoma cells. Mol Cell Biol. 1989;9(12):5623–5629. doi: 10.1128/mcb.9.12.5623. [DOI] [PMC free article] [PubMed] [Google Scholar]
- Hosler BA, Rogers MB, Kozak CA, Gudas LJ. An octamer motif contributes to the expression of the retinoic acid-regulated zinc finger gene Rex-1 (Zfp-42) in F9 teratocarcinoma cells. Mol Cell Biol. 1993;13(5):2919–2928. doi: 10.1128/mcb.13.5.2919. [DOI] [PMC free article] [PubMed] [Google Scholar]
- Kaplan T, Friedman N, Margalit H. Ab initio prediction of transcription factor targets using structural knowledge. PLoS Comput Biol. 2005;1(1):e1. doi: 10.1371/journal.pcbi.0010001. [DOI] [PMC free article] [PubMed] [Google Scholar]
- Kashyap V, Rezende NC, Scotland KB, Shaffer SM, Persson JL, Gudas LJ, Mongan NP. Regulation of stem cell pluripotency and differentiation involves a mutual regulatory circuit of the NANOG, OCT4, and SOX2 pluripotency transcription factors with polycomb repressive complexes and stem cell microRNAs. Stem Cells Dev. 2009;18(7):1093–1108. doi: 10.1089/scd.2009.0113. [DOI] [PMC free article] [PubMed] [Google Scholar]
- Kim J, Chu J, Shen X, Wang J, Orkin SH. An extended transcriptional network for pluripotency of embryonic stem cells. Cell. 2008;132(6):1049–1061. doi: 10.1016/j.cell.2008.02.039. [DOI] [PMC free article] [PubMed] [Google Scholar]
- Kim JD, Faulk C, Kim J. Retroposition and evolution of the DNA-binding motifs of YY1, YY2 and REX1. Nucleic Acids Res. 2007;35(10):3442–3452. doi: 10.1093/nar/gkm235. [DOI] [PMC free article] [PubMed] [Google Scholar]
- Lee ER, Murdoch FE, Fritsch MK. High histone acetylation and decreased polycomb repressive complex 2 member levels regulate gene specific transcriptional changes during early embryonic stem cell differentiation induced by retinoic acid. Stem Cells. 2007;25(9):2191–2199. doi: 10.1634/stemcells.2007-0203. [DOI] [PubMed] [Google Scholar]
- Lee TI, Jenner RG, Boyer LA, Guenther MG, Levine SS, Kumar RM, Chevalier B, Johnstone SE, Cole MF, Isono K, Koseki H, Fuchikami T, Abe K, Murray HL, Zucker JP, Yuan B, Bell GW, Herbolsheimer E, Hannett NM, Sun K, Odom DT, Otte AP, Volkert TL, Bartel DP, Melton DA, Gifford DK, Jaenisch R, Young RA. Control of developmental regulators by Polycomb in human embryonic stem cells. Cell. 2006;125(2):301–313. doi: 10.1016/j.cell.2006.02.043. [DOI] [PMC free article] [PubMed] [Google Scholar]
- Loebel DA, Watson CM, De Young RA, Tam PP. Lineage choice and differentiation in mouse embryos and embryonic stem cells. Dev Biol. 2003;264(1):1–14. doi: 10.1016/s0012-1606(03)00390-7. [DOI] [PubMed] [Google Scholar]
- Loh YH, Wu Q, Chew JL, Vega VB, Zhang W, Chen X, Bourque G, George J, Leong B, Liu J, Wong KY, Sung KW, Lee CW, Zhao XD, Chiu KP, Lipovich L, Kuznetsov VA, Robson P, Stanton LW, Wei CL, Ruan Y, Lim B, Ng HH. The Oct4 and Nanog transcription network regulates pluripotency in mouse embryonic stem cells. Nat Genet. 2006;38(4):431–440. doi: 10.1038/ng1760. [DOI] [PubMed] [Google Scholar]
- Masui S, Nakatake Y, Toyooka Y, Shimosato D, Yagi R, Takahashi K, Okochi H, Okuda A, Matoba R, Sharov AA, Ko MS, Niwa H. Pluripotency governed by Sox2 via regulation of Oct3/4 expression in mouse embryonic stem cells. Nat Cell Biol. 2007;9(6):625–635. doi: 10.1038/ncb1589. [DOI] [PubMed] [Google Scholar]
- Mitsui K, Tokuzawa Y, Itoh H, Segawa K, Murakami M, Takahashi K, Maruyama M, Maeda M, Yamanaka S. The homeoprotein Nanog is required for maintenance of pluripotency in mouse epiblast and ES cells. Cell. 2003;113(5):631–642. doi: 10.1016/s0092-8674(03)00393-3. [DOI] [PubMed] [Google Scholar]
- Mongan NP, Gudas LJ. Diverse actions of retinoid receptors in cancer prevention and treatment. Differentiation. 2007;75(9):853–870. doi: 10.1111/j.1432-0436.2007.00206.x. [DOI] [PubMed] [Google Scholar]
- Mongan NP, Martin KM, Gudas LJ. The putative human stem cell marker, Rex-1 (Zfp42): structural classification and expression in normal human epithelial and carcinoma cell cultures. Mol Carcinog. 2006;45(12):887–900. doi: 10.1002/mc.20186. [DOI] [PubMed] [Google Scholar]
- Nichols J, Zevnik B, Anastassiadis K, Niwa H, Klewe-Nebenius D, Chambers I, Scholer H, Smith A. Formation of pluripotent stem cells in the mammalian embryo depends on the POU transcription factor Oct4. Cell. 1998;95(3):379–391. doi: 10.1016/s0092-8674(00)81769-9. [DOI] [PubMed] [Google Scholar]
- Pan G, Li J, Zhou Y, Zheng H, Pei D. A negative feedback loop of transcription factors that controls stem cell pluripotency and self-renewal. FASEB J. 2006;20(10):1730–1732. doi: 10.1096/fj.05-5543fje. [DOI] [PubMed] [Google Scholar]
- Pan G, Tian S, Nie J, Yang C, Ruotti V, Wei H, Jonsdottir GA, Stewart R, Thomson JA. Whole-genome analysis of histone H3 lysine 4 and lysine 27 methylation in human embryonic stem cells. Cell Stem Cell. 2007;1(3):299–312. doi: 10.1016/j.stem.2007.08.003. [DOI] [PubMed] [Google Scholar]
- Pera MF, Reubinoff B, Trounson A. Human embryonic stem cells. J Cell Sci. 2000;113(Pt 1):5–10. doi: 10.1242/jcs.113.1.5. [DOI] [PubMed] [Google Scholar]
- Raman JD, Mongan NP, Liu L, Tickoo SK, Nanus DM, Scherr DS, Gudas LJ. Decreased expression of the human stem cell marker, Rex-1 (zfp-42), in renal cell carcinoma. Carcinogenesis. 2006;27(3):499–507. doi: 10.1093/carcin/bgi299. [DOI] [PubMed] [Google Scholar]
- Rogers MB, Hosler BA, Gudas LJ. Specific expression of a retinoic acid-regulated, zinc-finger gene, Rex-1, in preimplantation embryos, trophoblast and spermatocytes. Development. 1991;113(3):815–824. doi: 10.1242/dev.113.3.815. [DOI] [PubMed] [Google Scholar]
- Rosfjord E, Rizzino A. The octamer motif present in the Rex-1 promoter binds Oct-1 and Oct-3 expressed by EC cells and ES cells. Biochem Biophys Res Commun. 1994;203(3):1795–1802. doi: 10.1006/bbrc.1994.2395. [DOI] [PubMed] [Google Scholar]
- Scotland KB, Chen S, Sylvester R, Gudas LJ. Analysis of Rex1 (zfp42) function in embryonic stem cell differentiation. Dev Dyn. 2009;238(8):1863–1877. doi: 10.1002/dvdy.22037. [DOI] [PMC free article] [PubMed] [Google Scholar]
- Shi W, Wang H, Pan G, Geng Y, Guo Y, Pei D. Regulation of the pluripotency marker Rex-1 by Nanog and Sox2. J Biol Chem. 2006;281(33):23319–23325. doi: 10.1074/jbc.M601811200. [DOI] [PubMed] [Google Scholar]
- Shi Y, Lee JS, Galvin KM. Everything you have ever wanted to know about Yin Yang 1. Biochim Biophys Acta. 1997;1332(2):F49–66. doi: 10.1016/s0304-419x(96)00044-3. [DOI] [PubMed] [Google Scholar]
- Shrivastava A, Calame K. An analysis of genes regulated by the multi-functional transcriptional regulator Yin Yang-1. Nucleic Acids Res. 1994;22(24):5151–5155. doi: 10.1093/nar/22.24.5151. [DOI] [PMC free article] [PubMed] [Google Scholar]
- Smith AG. Embryo-derived stem cells: of mice and men. Annu Rev Cell Dev Biol. 2001;17:435–462. doi: 10.1146/annurev.cellbio.17.1.435. [DOI] [PubMed] [Google Scholar]
- Sun C, Nakatake Y, Akagi T, Ura H, Matsuda T, Nishiyama A, Koide H, Ko MS, Niwa H, Yokota T. Dax1 binds to Oct3/4 and inhibits its transcriptional activity in embryonic stem cells. Mol Cell Biol. 2009;29(16):4574–4583. doi: 10.1128/MCB.01863-08. [DOI] [PMC free article] [PubMed] [Google Scholar]
- Takahashi K, Tanabe K, Ohnuki M, Narita M, Ichisaka T, Tomoda K, Yamanaka S. Induction of pluripotent stem cells from adult human fibroblasts by defined factors. Cell. 2007;131(5):861–872. doi: 10.1016/j.cell.2007.11.019. [DOI] [PubMed] [Google Scholar]
- Thompson JR, Gudas LJ. Retinoic acid induces parietal endoderm but not primitive endoderm and visceral endoderm differentiation in F9 teratocarcinoma stem cells with a targeted deletion of the Rex-1 (Zfp-42) gene. Mol Cell Endocrinol. 2002;195(1-2):119–133. doi: 10.1016/s0303-7207(02)00180-6. [DOI] [PubMed] [Google Scholar]
- Wang J, Rao S, Chu J, Shen X, Levasseur DN, Theunissen TW, Orkin SH. A protein interaction network for pluripotency of embryonic stem cells. Nature. 2006;444(7117):364–368. doi: 10.1038/nature05284. [DOI] [PubMed] [Google Scholar]
- Xu J, Sylvester R, Tighe AP, Chen S, Gudas LJ. Transcriptional activation of the suppressor of cytokine signaling-3 (SOCS-3) gene via STAT3 is increased in F9 REX1 (ZFP-42) knockout teratocarcinoma stem cells relative to wild-type cells. J Mol Biol. 2008;377(1):28–46. doi: 10.1016/j.jmb.2007.12.038. [DOI] [PMC free article] [PubMed] [Google Scholar]
- Yant SR, Zhu W, Millinoff D, Slightom JL, Goodman M, Gumucio DL. High affinity YY1 binding motifs: identification of two core types (ACAT and CCAT) and distribution of potential binding sites within the human beta globin cluster. Nucleic Acids Res. 1995;23(21):4353–4362. doi: 10.1093/nar/23.21.4353. [DOI] [PMC free article] [PubMed] [Google Scholar]
- Yu J, Vodyanik MA, Smuga-Otto K, Antosiewicz-Bourget J, Frane JL, Tian S, Nie J, Jonsdottir GA, Ruotti V, Stewart R, Slukvin, Thomson JA. Induced pluripotent stem cell lines derived from human somatic cells. Science. 2007;318(5858):1917–1920. doi: 10.1126/science.1151526. [DOI] [PubMed] [Google Scholar]
- Zhang JZ, Gao W, Yang HB, Zhang B, Zhu ZY, Xue YF. Screening for genes essential for mouse embryonic stem cell self-renewal using a subtractive RNA interference library. Stem Cells. 2006;24(12):2661–2668. doi: 10.1634/stemcells.2006-0017. [DOI] [PubMed] [Google Scholar]