Abstract
The yeast Saccharomyces cerevisiae is able to overcome cell dehydration; cell metabolic activity is arrested during this period but restarts after rehydration. The yeast genes encoding hydrophilin proteins were characterised to determine their roles in the dehydration-resistant phenotype, and STF2p was found to be a hydrophilin that is essential for survival after the desiccation-rehydration process. Deletion of STF2 promotes the production of reactive oxygen species and apoptotic cell death during stress conditions, whereas the overexpression of STF2, whose gene product localises to the cytoplasm, results in a reduction in ROS production upon oxidative stress as the result of the antioxidant capacity of the STF2p protein.
Introduction
The kingdoms of bacteria, fungi and plants contain anhydrobiotic organisms that can survive during water-deficient periods [1]. During dehydration, the metabolic processes of these organisms are in a suspended state. However, during desiccation stress, genes are expressed that promote cellular tolerance to dehydration through protective functions in the cytoplasm, an alteration in the cellular water potential to promote water uptake, the control of ion accumulation, and the further regulation of gene expression [2]. Some of the proteins termed hydrophilins participate in the cellular tolerance to this stress condition and are biochemically characterised by a Gly content greater than 6%, a hydrophilicity index of >1.0, and a secondary structure of 50–80% coils. The genome of Saccharomyces cerevisiae contains genes (GON7, GRE1, HSP12, NOP6, RPL42A, STF2, SIP18, TIF11, WWM1, YBR016w, YJL144w, and YNL190w) that code for proteins with the characteristics of hydrophilins. The fact that the transcripts of all of these genes accumulate in response to osmotic stress suggests that the expression of hydrophilins represents a widespread adaptation to water deficit [3]. The properties of hydrophilins include their roles as antioxidants and as membrane and protein stabilisers during water stress, either by direct interaction or by acting as molecular shields [4]. Although the functional role of most S. cerevisiae hydrophilins remains speculative, there is evidence supporting their participation in the acclimation or adaptive response to stress [5]. The ectopic expression of some hydrophilins in yeast confers tolerance to water-deficit conditions [6], [7], [8], and the presence of these proteins has been associated with chilling tolerance [9].
In this study, we evaluated the role of the aforementioned S. cerevisiae hydrophilins in dehydration stress. Five strains overexpressing SIP18, STF2, GRE1, YJL144w or NOP6 were identified as dehydration tolerant. For STF2, we found that the cell viability after desiccation and rehydration process was due to the antioxidant capacity of this protein, which reduced the number of apoptotic cells during stress conditions by minimising the accumulation of ROS in the cells.
Results
Hydrophilins from S. cerevisiae enhance dry stress tolerance
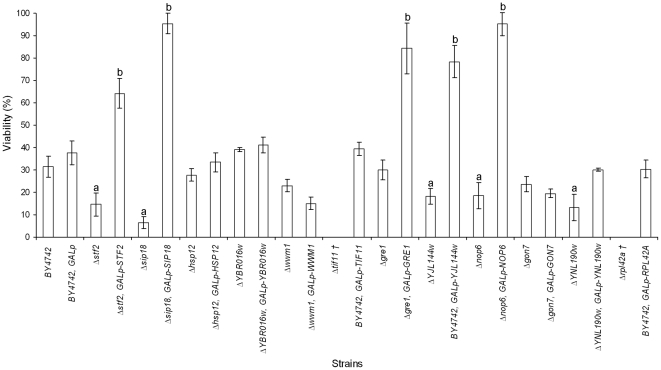
Among the 12 proteins of the hydrophilin group found in S. cerevisiae, TIF11p and RPL42Ap are encoded by essential genes. Therefore, the desiccation tolerance capacity of a set of 10 viable mutant haploid strains (BY4742) for the genes encoding these hydrophilins was assessed using a colony-counting assay. The mean CFU (colony-forming units) ml−1 value for survival after rehydration was calculated after taking into account the viability before drying. Only the Δstf2, Δsip18, ΔYJL144w, Δnop6 and Δynl190w strains (BY4742 background) exhibited statistically significant lower values of viability after stress induction, 14%, 6%, 18%, 18% and 13%, respectively, from the BY4742 strain (Fig. 1). The viability of the Δhsp12, ΔYBR016w, Δwwm1, Δgre1 and Δgon7 strains did not exhibit statistically significant differences from the reference strain (at ∼35%). We next characterised the effects of increasing the STF2p, SIP18p, HSP12p, YBR016wp, WWM1p, TIF11p, GRE1p, YJL144wp, NOP6p, GON7p, YNL190wp and RPL42ap expression levels in stationary-state cells using a plasmid that allows expression of these genes under the control of the GAL1 promoter (pGAL1) in the corresponding yeast gene-deletion strain (except for the two essential genes, TIF11 and RPL42, which were over-expressed in the BY4742 strain). After rehydration, the following strains exhibited approximately 50% higher viability than the BY4742, GALp strain: Δstf2, GALp-STF2; Δsip18, GALp-SIP18; Δgre1, GALp-GRE1; ΔYJL144w, GALp-YJL144w; and Δnop6, GALp-NOP6 (Fig. 1). Furthermore, the other transformant strains showed cell viability values similar to that of the reference strain harbouring the empty vector (i.e., BY4742, GALp). These results allowed us to conclude that the STF2, GRE1, NOP6, YNL190w, SIP18 and YJL144w genes -the last two having been the subject of a previous study [10]- are essential to overcome the simple stress of the desiccation-rehydration process. Moreover, the increased levels of STF2, SIP18, GRE1, YJL144w and NOP6 gene products before stress induction might enhance the dehydration stress tolerance.
Figure 1. Effect of over-expressing hydrophilin genes on the yeast viability after the drying and rehydration process.
The scale of viability (%) indicates the percentage of experimental values for the different strains. Values shown are the means of at least n = 3 independent samples ± the standard deviation. a,bSignificant differences (p≤0.05) with respect to the BY4742 and to the BY4742, GALp strain, respectively.
Overexpression of STF2 prevents cellular ROS accumulation
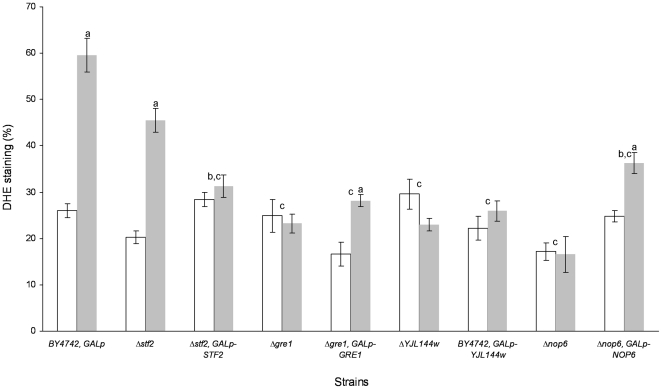
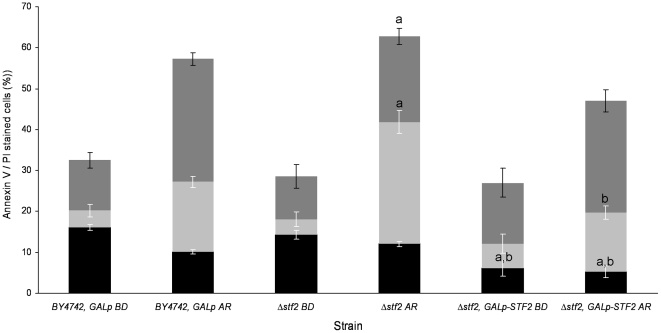
Based on the reported antioxidant role of hydrophilins in different organisms, as reviewed by [4], we wanted to ascertain, in stationary-state cells, whether the higher viability rate of the STF2p, GRE1p, YJL144wp and NOP6p over-expressing strains relative to the wild type after the de- and rehydration process could be due to differences in ROS accumulation [11]. Yeast cells in the stationary phase and after rehydration were incubated in the presence of dihydroethidium (DHE) to quantify the ROS-accumulating cells (Fig. 2). Before dehydration, approximately 29% of the cells of each evaluated strain showed fluorescence after DHE incubation. After rehydration, the cultures of BY4742, GALp and Δstf2 strains contained up to 35% more cells that exhibited intense intracellular DHE staining. During stress induction, the Δstf2, GALp-STF2 cells (30%) showed a statistically significant reduction in ROS accumulation in comparison to the Δstf2 cells (45%). However, the Δgre1, GALp-GRE1; ΔYJL144w, GALp-YJL144w; and Δnop6, GALp-NOP6 cells did not show statistically significant reduction in fluorescence in comparison to Δgre1, ΔYJL144w and Δnop6 cells. Notably, around 32% of Δgre1; Δgre1, GALp-GRE1; ΔYJL144w; ΔYJL144w, GALp-YJL144w; Δnop6; and Δnop6, GALp-NOP6 cells showed 50% lower ROS levels during stress induction than By4742, GALp cells. Considering the cell viability results for the over-expressing strains (Fig. 1) and their ROS reduction values in comparison to the corresponding knock-out strain (Fig. 2), we suggest that only STF2p overexpression correlates with the increase in the desiccation survival rate and the reduction in ROS levels after stress induction. Therefore, we explored whether the changes in the cell viability observed in the Δstf2, GALp-STF2 strain with elevated dehydration tolerance correlated with other apoptotic processes, such as phosphatidylserine externalisation (Annexin V/PI staining) and DNA strand breaks (TUNEL assay) (Fig. 3). Using flow cytometry, we were able to quantify apoptotic (Annexin V+/PI−), secondary necrotic (Annexin V+/PI+), and true necrotic (Annexin V−/PI+) cells. After stress induction, the Δstf2 strain showed amounts of apoptotic (∼12%, as BY4742, GALp strain) and secondary necrotic (∼29%) fluorescent cells significantly higher than Δstf2, GALp-STF2 cells, ∼5% and ∼15% respectively, whereas the reference strain and the dehydration-tolerant clone had similar percentages of Annexin V/PI and PI cells, ∼15% and ∼29%, respectively. Additionally, before dehydration, the percentages of Annexin V, Annexin V/PI and PI cells for the BY4742, GALp; and Δstf2 strains did not exhibit significant differences, with staining levels of ∼15% for Annexin V, ∼5% for Annexin V/PI and ∼11% for PI, respectively for both strains, whereas the Δstf2, GALp-STF2 strain showed similar percentages Annexin V/PI and PI cells but only 5% for Annexin V cells. These results suggest that the over-expression of STF2p minimised the number of apoptotic cells during stress induction as a putative consequence of the reduction of ROS accumulation in the cells. By the contrary, cell death of Δgre1, ΔYJL144w and Δnop6 strains might be linked to some molecular pathway in a ROS accumulation-independent way.
Figure 2. Yeast cells accumulate ROS during stress induction.
Quantification of the ROS accumulation using DHE staining before cell dehydration (BD, white bars) and after the rehydration process (AR, grey bars). Values are the means of at least n = 3 determinations ± the SD. aSignificant differences (p≤0.05) during stress induction with respect to the BD step. bSignificant differences (p≤0.05) during stress induction of overexpressing strain with respect to the knock-out strain. cSignificant differences (p≤0.05) during stress induction with respect to the BY4742, GALp strain. In each experiment 500 cells were evaluated.
Figure 3. Apoptotic hallmarks in the STF2p-over-expressing strain.
Stained cells:  , necrotic;
  , secondary necrotic; and ▪, apoptotic cells. The scale of Annexin V/PI-stained cells (%) indicates the percentage of experimental values for the different strains BD and AR. The represented values are the means of n = 3 determinations ± the SD. a,bSignificant differences (p≤0.05) with respect to BY4742, GALp and Δstf2 strains, respectively. In each experiment, 1×10⁵ cells were evaluated.
GFP-STF2 fusion protein accumulates in the cytoplasm
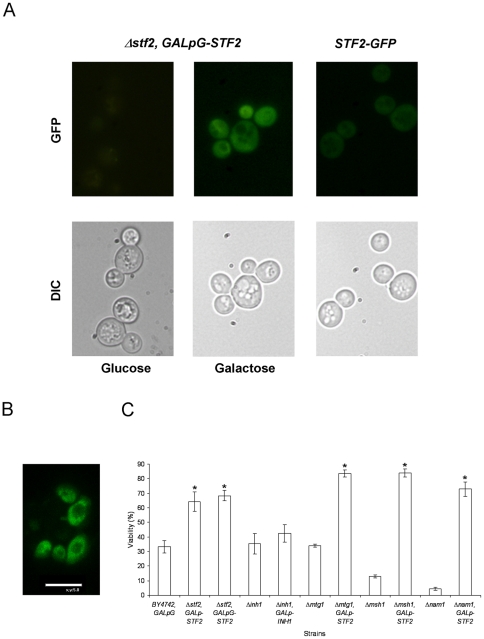
With the aim of investigating the localisation of STF2p, a strain carrying a fusion of STF2p and green fluorescent protein (GFP) integrated in the STF2 locus (GFP-STF2) was analysed by microscopy after 2 days of growth (STF2 is mainly expressed during the stationary phase [12]. After 48 h of growth, a culture of the Δstf2 strain with the plasmid expressing GFP-STF2 under GALp (Δstf2, GALpG-STF2) was divided, and the stationary-state cells were observed after a 4 h supplementation with 2% galactose or 2% glucose. The fusion protein was expressed at a very low level in the presence of glucose, resulting in the diffuse labelling of the cells, mainly due to the low activity of GALp even after glucose starvation. However, the Δstf2, GALpG-STF2 cells supplemented with galactose exhibited a high fluorescent signal, with most cells exhibiting green fluorescence in the cytoplasm (Fig. 4A). In order to better note the localization of the full protein in the cytoplasm, cells of the over-expressing GFP-STF2p fusion strain were observed after 4 h of galactose induction, using a confocal microscope. Labelling of the cell surface, nucleus or vacuolar system was not observed in any case (Fig. 4B). Additionally, cells of both the Δstf2, GALpG-STF2 and Δstf2, GALp-STF2 strains (Fig. 4C) showed the same increase in viability after rehydration in comparison with the reference strains harbouring the empty vectors (Figs. 1 and 4C). Therefore, the GFP tag did not result in any phenotypic defect in the viability of the BY4742 strain after the dehydration and rehydration process.
Figure 4. STF2-SIP18 fusion localises to the cytoplasm.
A) Each column shows images of the same field, with the fluorescence of the green fluorescent protein (GFP) in the top row and the differential interference contrast (DIC) images of the cultured yeast cells in the bottom row. The Δstf2 cells transformed with the vector expressing GFP-STF2 under the control of the GAL promoter were photographed after 4 h of galactose or glucose supplementation. Cells expressing the GFP-STF2 fusion protein under the STF2 promoter were photographed after 24 h in the stationary phase. B) Analysis of cells expressing GFP-STF2p using the confocal microscope. Image generated by the average of a pile of five optical sections. C) The scale of viability (%) indicates the percentage of the experimental values for the different strains after the dehydration and rehydration process relative to the highest value for the fresh cultures before the induction of the stress. Values are the means of n = 3 determinations ± the SD. *Significant differences (p≤0.01) of overexpressing strains with respect to the BY4742, GALpG strain.
Respiration deficiency in the GALp-STF2 strain does not promote dehydration tolerance
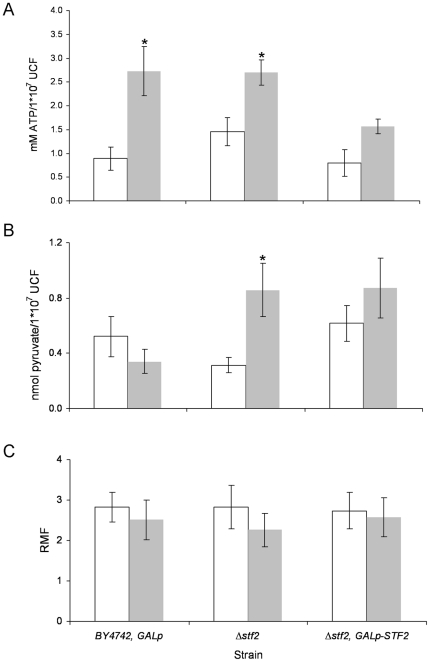
Mitochondria are both the source of and the site for the detoxification of ROS in yeast. A physiological stimulus for ATP synthesis can become a pathological stimulus for ROS generation [13]. The STF2p protein may act as stabilising factor that enhances the inhibitory action of the Inh1p protein in the F1F0-ATP synthase; homodimers of the Inh1p protein bind directly to the F1-sector, allowing the maintenance of intracellular ATP levels [14]. Therefore, we evaluated whether changes in the regulation of ATP hydrolysis correlated with the enhancement of the cell dehydration tolerance. Both the Δinh1 and Δinh1, Galp-INH1 strains did not show improved survival relative to the reference strain (at ∼35%) (Fig. 4C). The increase in the cellular ATP level reduces the flux through the glycolytic pathway, thus inducing a reduction in pyruvate accumulation [15]. Figure 5 shows the evaluation of the cellular pyruvate and ATP concentrations for the Δstf2 and Δstf2, GALp-STF2 strains before cell dehydration (BD) and after the rehydration process (AR). The cells of the BY4742, GALp and Δstf2 strains showed similar patterns of ATP content BD and AR, increasing 4 fold and 2 fold, respectively. In the Δstf2, GALp-STF2 cells AR, less than 90% of the ATP level of the reference strain was observed (Fig. 5A). The mutated strains did not exhibit statistically significant changes in their pyruvate concentrations relative to the reference strain BD and AR (Fig. 5B). With regard to BD and AR, a minor discrepancy was observed between the mitochondrial mass and ΔΨm in the cells of the BY4742, GALp; Δstf2 and Δstf2, GALp-STF2 strains, but no significant change in their RMFs was observed (Fig. 5C), suggesting that variations in the mitochondrial function did not play a significant role in the cellular ATP content during the dehydration process. Therefore, we evaluated three petite mutant strains (Δmtg1, Δmsh1, and Δnam1) overexpressing the STF2 gene to exclude the possibility that the increase in cell dehydration tolerance was a consequence of lack of synchronicity between ATP and pyruvate metabolism (Fig. 4C). Stationary cells from the Δmtg1, GALp-STF2; Δmsh1, GALp-STF2; and Δnam1, GALp-STF2 strains after galactose induction showed survival rates (∼75%) similar to that of the Δstf2, GALp-STF2 strain (Fig. 1).
Figure 5. Quantification of ATP (A), pyruvate (B), and the relative mitochondrial function (C) BD (white bars), AR (grey bars) and relative mitochondrial function (RMF).
Value shown are the means of at least n = 3 independent samples ± the SD. *Significant differences (p≤0.05) with respect to the BD step.
Cells over-expressing STF2p show a reduction in DHE fluorescence after H2O2 stress
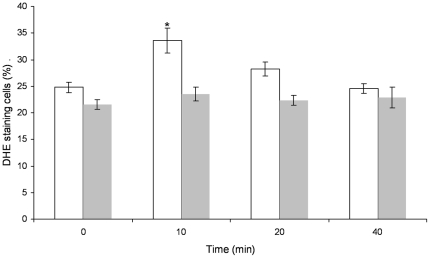
Stationary-state cells of the BY4742, GALp and Δstf2, GALp-STF2 strains were induced for 4 h with 2% galactose and exposed to 4 mM H2O2 (Fig. 6). The STF2p-over-expressing strain showed a reduction in the number of DHE-positive cells. As shown in Figure 6, after 10 min of H2O2 treatment, the percentage of cells accumulating ROS was ∼10% less of the value for the reference strain, supporting the hypothesis that STF2p acts as an antioxidant. However, after 20 min and 40 min of H2O2 stress, the number of DHE-positive cells did not exhibit significant differences, suggesting that STF2p does not have a strong positive effect on H2O2 clearance.
Figure 6. Levels of DHE accumulation after oxidative stress induced by H2O2.
BY4742 (white bars) and Δstf2, pGAL-STF2 (grey bars) cells were exposed to 4 mM H2O2, and at the indicated times, aliquots were collected to determine the number of DHE-positive cells. The represented data are the means of n = 6 determinations ± the SD. *Significant differences (p≤0.05) for each time with respect to the Δstf2, pGAL-STF2 strain.
Discussion
It has been reported previously that some highly hydrophilic proteins are commonly induced during water-deficit conditions [3]. Among the 12 S. cerevisiae hydrophilin proteins, we found that only STF2p, SIP18p, GRE1p, YJL144wp and NOP6p are necessary for the cells to overcome dehydration stress; only STF2p (involved in the regulation of the mitochondrial F1F0-ATP synthase) and NOP6p (an rRNA-binding protein required for 40S ribosomal subunit biogenesis) have known functions in yeast [16], [17]. The overexpression of the above proteins significantly enhanced cell viability under stress conditions. Therefore, considering the cell viability results and the apparently uncoupled cellular roles of the yeast STF2p, SIP18p, GRE1p, YJL144w, and NOP6p hydrophilins, we suggest that the roles as putative intracellular cell protectors might not be their only activity, as was shown for the group 3 late embryogenesis abundant (LEA) proteins, which prevent both protein aggregation and membrane fusion [18]. In this present study, we characterised the role of STF2p in dehydration stress and examined the possible physiological relationship between the overexpression of STF2p and the enhancement of viability after the induction of stress. The prevention of ROS accumulation in cells of the Δstf2, GALp-STF2 strain, during both the desiccation-rehydration process and H2O2 oxidative stress, indicates that STF2p is a protein with antioxidant capabilities, as has been reported for some plant LEA proteins [5]. Thus, the overexpression of STF2 prevents ROS accumulation and, consequently, cell apoptosis [19], [20]. The strains with highly significant viability rates, the GRE1p-, YJL144wp- and NOP6p-overexpressing strains, yielded viability and ROS results that were contrary to those for the Δstf2, GALp-STF2 strain. Perhaps, as was suggested for the LEA proteins, GRE1p, YJL144wp and NOP6p behave as molecular shields that prevent protein aggregation by steric or electrostatic repulsion, analogous to the polymer stabilisation of colloidal suspensions [21]; however, no direct evidence of functional mechanisms were described. It is well documented that mitochondrial function is necessary to maintain low intracellular ROS levels under both saline and osmotic stress conditions [22]. In addition, a physiological stimulus for ROS generation can become a stimulus for ATP synthesis in growing cells [13]. Most of the mechanisms of cellular tolerance to harsh conditions are driven via plasma membrane ATPase and vacuolar ATPase functions, processes that require large amounts of ATP to overcome acidic or osmotic stress; thus, a low ATP concentration could compromise cell viability during stress conditions [23], [24]. However, the accumulation of ATP reduces S. cerevisiae glycolytic activity, preventing pyruvate formation [15]. During the drying and rehydration process, the Δstf2, GALp-STF2 strain showed lower levels of accumulated ATP than the Δstf2 strain, and both strains had similar pyruvate concentrations after the stress induction, supporting the idea that the different viability values were not a consequence of achieving critical values for ATP and pyruvate. STF2p is a modulator of the INH1p regulatory peptide, which acts on the F1F0-ATP synthase complex [25], and the deletion or altered expression of the INH1 gene could decrease the ATP supply or enhance cell growth and pyruvate production, respectively [26]. Considering the lack of correlation between the ATP and pyruvate concentrations in the STF2 strains during the dehydration-rehydration process and the similar viabilities of the Δinh1, GALp-INH1 and Δinh1 strains, we conclude than the -lack of synchronicity between the glycolytic pathway and ATP synthesis did not have a major role in the improved survival rate of the stf2, GALp-STF2 strain. Moreover, the overexpression of the STF2 gene in the petite and non-petite strains resulted in similar viability rates. This result provides evidence that STF2p may allow the cell to survive by stabilising other cellular proteins rather than by interacting with apoptotic proteins, such as NUC1, shuttling from the mitochondria to the nucleus or by a reconfiguration of metabolism via the mitochondrial retrograde signal that is involved in nutrient sensing and cell aging [27], [28].
The present work provides evidence that STF2p allows yeast cells to survive during dehydration stress by contributing to the cellular antioxidant capacity that prevents ROS accumulation rather than by the inhibition of apoptotic proteins. Further studies will be necessary to establish the functional mechanisms of yeast hydrophilins which provide dehydration stress tolerance to the cells.
With recent advances in tissue engineering, cell transplantation and genetic technology, the successful long-term storage of living cells is of critical importance. Studies in yeast may provide a better understanding of desiccation-tolerance genetics for potential applications in biomedicine, plant biotechnology, and beverage and bio-ethanol technology.
Materials and Methods
Strains and plasmids
Table 1 summarises the yeast strains and plasmids used in this study. The single null mutant strains and the reference strain, all in the BY4742 genetic background, were purchased from EUROSCARF (Frankfurt, Germany). The yeast strain expressing the GFP-STF2 chromosomal fusion was purchased from Invitrogen. Recombinant DNA techniques were performed according to standard protocols [29]. The synthetic genes (GON7, GRE1, HSP12, INH1, NOP6, RPL42A, SIP18, STF2, WWM1, YBR016w, YJL144w, and YNL190w) were obtained by PCR and cloned into the pGREG505 yeast expression vector (under the control of the GAL1 promoter) digested with SalI. The plasmids were then used to transform a yeast strain in which the corresponding gene had been deleted. The pGREG575 vector was used to express GFP-tagged proteins. Transformants were selected by plating on synthetic glucose media lacking leucine. Leu+ transformants were selected and re-streaked to obtain single colonies, which were confirmed by PCR using the primer pair GALFw and CYCRv (Table 2) and by testing for the loss of the LEU marker. The PCR fragments were obtained using BY4742 genomic DNA as a template together with the primer pairs shown in Table 2. The amplification reactions contained single-strength PCR buffer (Roche, Mannheim, Germany), 1.25 mM dNTPs, 1.0 mM MgCl2, 0.3 µM of each primer, 2 ng µl−1 template DNA and 3.5 U DNA polymerase (Roche) in a total volume of 100 µl. All of the reactions were carried out using a PCR Express thermal cycler for 15 cycles, as follows: denaturation, 2 min at 94°C; primer annealing, 30 s at 55°C; and primer extension, 1 min at 68°C.
Table 1. Plasmids and yeast strains used in this study.
| Strains | Relevant characteristics | References |
| BY4742 | MATα, his3Δ1, leu2Δ0, lys2Δ0, ura3Δ0 | [33] |
| STF2-GFP | MATα, his3Δ1, leu2Δ0, lys2Δ0, ura3Δ0, STF2-GFP-KanMX | Invitrogene |
| Δstf2 | BY4742, stf2::kanMX4 | EUROSCARF |
| Δsip18 | BY4742, sip18::kanMX4 | EUROSCARF |
| Δhsp12 | BY4742, hsp12::kanMX4 | EUROSCARF |
| ΔYBR016w | BY4742, YBR016w::kanMX4 | EUROSCARF |
| Δwwm1 | BY4742, wwm1::kanMX4 | EUROSCARF |
| Δgre1 | BY4742, gre1::kanMX4 | EUROSCARF |
| ΔYJL144w | BY4742, YJL144w::kanMX4 | EUROSCARF |
| Δnop6 | BY4742, nop6::kanMX4 | EUROSCARF |
| Δgon7 | BY4742, gon7::kanMX4 | EUROSCARF |
| ΔYNL190w | BY4742, YNL190w::kanMX4 | EUROSCARF |
| Δinh1 | BY4742, inh1::kanMX4 | EUROSCARF |
| BY4742, GALp | BY4742+pGREG505Δh | This work |
| BY4742, GALpG | BY4742+pGREG575Δh | This work |
| Δstf2, GALp-STF2 | Δstf2+pGREG505st | This work |
| Δstf2, GALpG-STF2 | Δstf2+pGREG575gst | This work |
| Δsip18, GALp-SIP18 | Δsip18+pGREG505si | This work |
| Δhsp12, GALp-HSP12 | Δhsp12+pGREG505hs | This work |
| ΔYBR016w, GALp-YBR016w | Δrif2+pGREG505yb | This work |
| Δwwm1, GALp-WWM1 | Δwwm1+pGREG505ww | This work |
| BY4742, GALp-TIF11 | BY4742+pGREG505tf | This work |
| Δgre1, GALp-GRE1 | Δgre1+pGREG505gr | This work |
| ΔYJL144w, GALp-YJL144w | Δgre1+pGREG505yj | This work |
| Δnop6, GALp-NOP6 | Δnop6+pGREG505np | This work |
| Δgon7, GALp-GON7 | Δgon7+pGREG505gn | This work |
| Δgon7, GALp-YNL190 | Δgon7+pGREG505yl | This work |
| BY4742, GALp-RPL42A | BY4742+pGREG505rp | This work |
| Δinh1, GALp-INH1 | Δinh1+pGREG505ih | This work |
| Plasmids | ||
| pGREG505Δh | GAL1p-SalI-CYC1t-KanMX4-LEU2-bla | [34] |
| pGREG575Δh | GAL1p-GFP-SalI-CYC1t-KanMX4-LEU2-bla | [34] |
| pGREG505st | GAL1p-STF2-CYC1t-KanMX4-LEU2-bla | This work |
| pGREG575gst | GAL1p-GFP-STF2-CYC1t-KanMX4-LEU2-bla | This work |
| pGREG505si | GAL1p-SIP18-CYC1t-KanMX4-LEU2-bla | [34] |
| pGREG505hs | GAL1p-HSP12-CYC1t-KanMX4-LEU2-bla | This work |
| pGREG505yb | GAL1p-YBR016-CYC1t-KanMX4-LEU2-bla | This work |
| pGREG505ww | GAL1p-WWM1-CYC1t-KanMX4-LEU2-bla | This work |
| pGREG505tf | GAL1p-TIF11-CYC1t-KanMX4-LEU2-bla | This work |
| pGREG505gr | GAL1p-GRE1-CYC1t-KanMX4-LEU2-bla | This work |
| pGREG505yj | GAL1p-YJL144w-CYC1t-KanMX4-LEU2-bla | This work |
| pGREG505np | GAL1p-NOP6-CYC1t-KanMX4-LEU2-bla | This work |
| pGREG505gn | GAL1p-GON7-CYC1t-KanMX4-LEU2-bla | This work |
| pGREG505yl | GAL1p-YNL190-CYC1t-KanMX4-LEU2-bla | This work |
| pGREG505rp | GAL1p-RPL42A-CYC1t-KanMX4-LEU2-bla | This work |
| pGREG505ih | GAL1p-INH1-CYC1t-KanMX4-LEU2-bla | This work |
Table 2. Primers designed for PCR.
| Primer | Oligonucleotide sequencea |
| STF2Fw | 5′-GAATTCGATATCAAGCTTATCGATACCGTCGACATGACGAGAACAAACAAG-3′ |
| STF2Rv | 5′-GCGTGACATAACTAATTACATGACTCGAGGTCGACTCATTCCTTTTGGACGT-3′ |
| HSP12Fw | 5′-GAATTCGATATCAAGCTTATCGATACCGTCGACATGTCTGACGCAGGTAG-3′ |
| HSP12Rv | 5′-GCGTGACATAACTAATTACATGACTCGAGGTCGACTTACTTCTTGGTTGGGTC-3′ |
| YBRFw | 5′-GAATTCGATATCAAGCTTATCGATACCGTCGACATGTCTGCTAACGATTAC-3′ |
| YBRRv | 5′-GCGTGACATAACTAATTACATGACTCGAGGTCGACTTAGAATAGCATATCCATG-3′ |
| WWM1Fw | 5′-GAATTCGATATCAAGCTTATCGATACCGTCGACATGGCTCAAAGTAAAAGTAAT-3′ |
| WWM1Rv | 5′-GCGTGACATAACTAATTACATGACTCGAGGTCGACCCATGGATATGCTATTCTAA-3′ |
| TIF11Fw | 5′-GAATTCGATATCAAGCTTATCGATACCGTCGACATGGGTAAGAAAAACAC-3′ |
| TIF11Rv | 5′-GCGTGACATAACTAATTACATGACTCGAGGTCGACTTAAATGTCATCAATATC-3′ |
| GRE1Fw | 5′-GAATTCGATATCAAGCTTATCGATACCGTCGACATGTCCAATCTATTAAACAAG-3′ |
| GRE1Rv | 5′-GCGTGACATAACTAATTACATGACTCGAGGTCGACCTACCAGACGCCTTG-3′ |
| YJL144wFw | 5′-GAATTCGATATCAAGCTTATCGATACCGTCGACATGTTAAGGAGGGAAACTT-3′ |
| YJL144wRv | 5′-GCGTGACATAACTAATTACATGACTCGAGGTCGACTTATCATGAACAACGGCGAG-3′ |
| NOP6Fw | 5′-GAATTCGATATCAAGCTTATCGATACCGTCGACATGGGGTCCGAGGAAG-3′ |
| NOP6Rv | 5′-GCGTGACATAACTAATTACATGACTCGAGGTCGACTCATTTAAGTAGTTTGGCT-3′ |
| GON7Fw | 5′-GAATTCGATATCAAGCTTATCGATACCGTCGACATGAAACTACCGGTAGC-3′ |
| GON7Rv | 5′-GCGTGACATAACTAATTACATGACTCGAGGTCGACTAAACAGCATCTTCGTC-3′C |
| YNL190wFw | 5′-GAATTCGATATCAAGCTTATCGATACCGTCGACATGAAGTTCTCTTCTGTTA-3′C |
| YNL190wRv | 5′-GCGTGACATAACTAATTACATGACTCGAGGTCGACTTATAATAGTAATAAGGCACC-3′ |
| RPL42Fw | 5′-GAATTCGATATCAAGCTTATCGATACCGTCGACATGGGTATGTTATAACC-3′ |
| RPL42wRv | 5′-GCGTGACATAACTAATTACATGACTCGAGGTCGACTCAGAATTGCAAAGCTTGAC-3′ |
| INH1Fw | 5′-GAATTCGATATCAAGCTTATCGATACCGTCGACATGTTACCACGTTCAGC-3′ |
| INH1Rv | 5′-GCGTGACATAACTAATTACATGACTCGAGGTCGACTTATTTGGTCATCGAGTC-3′ |
| GALFw | 5′-GAAAAAACCCCGGATTCTAG-3′ |
| CYCRv | 5′-ATAACTAATTACATGACTCGAG-3′ |
Growth conditions and desiccation-rehydration process
Yeast strains were grown in shake flasks at 150 rpm in SC medium containing 0.17% yeast nitrogen base (Difco), 2% glucose, 0.5% (NH4)2SO4, 25 mg·l−1 uracil, and 42 mg·l−1 lysine and histidine. The desiccation-rehydration process and yeast viability determinations were performed as described previously [30].
Tests for apoptotic markers
The DHE staining, Annexin V/PI co-staining and TUNEL staining were performed as described in [31]. The same samples were analysed by fluorescence microscopy. To determine the frequencies of the morphological phenotypes revealed by the TUNEL, DHE and Annexin V/PI staining, at least 106 cells from three independent experiments were evaluated using flow cytometry and FloMax software (Partec GmbH, Germany).
Microscopy
Cultures of strains harbouring the GFP-tagged genes were grown to the stationary phase in SC medium. The cells were washed with 1× PBS buffer (pH 7.4) and fixed with 70% ethanol for 10 min at R.T. Fluorescence was viewed using a Leica fluorescence microscope (DM4000B, Germany). A digital camera (Leica DFC300FX) and the Leica IM50 software were used for the image acquisition. Confocal images were obtained using a laser microscope (Nikon TE2000-E) equipped with a digital camera (Nikon DXM1200C), and overlaid images using NIS-Elements software (Nikon).
Determination of ATP and pyruvate concentrations
The cellular pyruvate concentration was determined using the Pyruvate Assay Kit (BioVision Research Products, USA), and the ATP content was assessed with the ATP Bioluminescence Assay Kit HS II (Roche Applied Science, Germany). The quantification was carried out using a POLARstar Omega microplate reader equipped with two reagent injectors (BMG LABTECH, USA).
Assessment of mitochondrial changes
The changes in mitochondrial mass and ΔΨm were assessed using JC-1 (Molecular Probes Inc.) as previously described [32]. JC-1 allows the simultaneous quantification by flow cytometry of both the mitochondrial mass (green fluorescence) and ΔΨm (red fluorescence). We defined the relative mitochondrial function (RMF) as the ratio of JC-1 red∶green, which reflects the changes in ΔΨm per unit mitochondrial mass.
Statistical analysis
The results were statistically analysed by one-way ANOVA and the Scheffé test using the SPSS 15.1 statistical software package. The statistical significance were set at P≤0.05 and P≤0.01.
Acknowledgments
The authors would like to thank the Microscope Unit at the Universitat Rovira i Virgili for their assistance with confocal microscopy.
Footnotes
Competing Interests: The authors have declared that no competing interests exist.
Funding: This study was funded by grant AGL2009-07933 from the Spanish Ministerio de Ciencia e Innovación. The funders had no role in study design, data collection and analysis, decision to publish, or preparation of the manuscript.
References
- 1.Reyes JL, Rodrigo MJ, Colmenero-Flores JM, Gil JV, Garay-Arroyo A, et al. Hydrophilins from distant organisms can protect enzymatic activities from water limitation effects in vitro. Plant Cell Environ. 2005;28:709–718. [Google Scholar]
- 2.Bray EA. Molecular responses to water deficit. Plant Physiol. 1993;103:1035–1040. doi: 10.1104/pp.103.4.1035. [DOI] [PMC free article] [PubMed] [Google Scholar]
- 3.Garay-Arroyo A, Colmenero-Flores JM, Garciarrubio A, Covarrubias AA. Highly hydrophilic proteins in prokaryotes and eukaryotes are common during conditions of water deficit. J Biol Chem. 2000;275:5668–5674. doi: 10.1074/jbc.275.8.5668. [DOI] [PubMed] [Google Scholar]
- 4.Tunnacliffe A, Wise MJ. The continuing conundrum of the LEA proteins. Naturwissenschaften. 2007;94:791–812. doi: 10.1007/s00114-007-0254-y. [DOI] [PubMed] [Google Scholar]
- 5.Battaglia M, Olvera-Carrillo Y, Garciarrubio A, Campos F, Covarrubias A. The enigmatic LEA proteins and other hydrophilins. Plant Physiol. 2008;148:6–24. doi: 10.1104/pp.108.120725. [DOI] [PMC free article] [PubMed] [Google Scholar]
- 6.Imai R, Chang L, Ohta A, Bray EA, Takagi M. A lea-class gene of tomato confers salt and freezing tolerance when expressed in Saccharomyces cerevisiae. Gene. 1996;170:243–248. doi: 10.1016/0378-1119(95)00868-3. [DOI] [PubMed] [Google Scholar]
- 7.Swire-Clark GA, Marcotte WR., Jr The wheat LEA protein functions as an osmoprotective molecule in Saccharomyces cerevisiae. Plant Mol Biol. 1999;39:117–128. doi: 10.1023/a:1006106906345. [DOI] [PubMed] [Google Scholar]
- 8.Zhang L, Ohta A, Takagi M, Imai R. Expression of plant group 2 and group 3 lea genes in Saccharomyces cerevisiae revealed functional divergence among LEA proteins. J Biochem (Tokyo) 2000;127:611–616. doi: 10.1093/oxfordjournals.jbchem.a022648. [DOI] [PubMed] [Google Scholar]
- 9.Ismail AM, Hall AE, Close TJ. Allelic variation of a dehydrin gene cosegregates with chilling tolerance during seedling emergence. Proc Natl Acad Sci USA. 1999;96:13566–13570. doi: 10.1073/pnas.96.23.13566. [DOI] [PMC free article] [PubMed] [Google Scholar]
- 10.Dang NX, Hincha DK. Identification of two hydrophilins that contribute to the desiccation and freezing tolerance of yeast (Saccharomyces cerevisiae) cells. Cryobiol. 2011;62:188–193. doi: 10.1016/j.cryobiol.2011.03.002. [DOI] [PubMed] [Google Scholar]
- 11.Szeto SS, Reinke SN, Sykes BD, Lemire BD. Ubiquinone-binding site mutations in the saccharomyces cerevisiae succinate dehydrogenase generate superoxide and lead to the accumulation of succinate. J Biol Chem. 2007;282:27518–27526. doi: 10.1074/jbc.M700601200. [DOI] [PubMed] [Google Scholar]
- 12.Gasch AP, Spellman PT, Kao CM, Carmel-Harel O, Eisen MB, et al. Genomic expression programs in the response of yeast cells to environmental changes. Mol Biol Cell. 2000;11:4241–4257. doi: 10.1091/mbc.11.12.4241. [DOI] [PMC free article] [PubMed] [Google Scholar]
- 13.Brookes PS, Yoon Y, Robotham JL, Anders MW, Sheu SS. Calcium, ATP, and ROS: A mitochondrial love-hate triangle. Am J Physiol Cell Physiol. 2004;287:C817–833. doi: 10.1152/ajpcell.00139.2004. [DOI] [PubMed] [Google Scholar]
- 14.Dienhart M, Pfeiffer K, Schagger H, Stuart RA. Formation of the yeast F1F0-ATP synthase dimeric complex does not require the ATPase inhibitor protein, Inh1. J Biol Chem. 2002;277:39289–39295. doi: 10.1074/jbc.M205720200. [DOI] [PubMed] [Google Scholar]
- 15.Larsson C, Pahlman IL, Gustafsson L. The importance of ATP as a regulator of glycolytic flux in Saccharomyces cerevisiae. Yeast. 2000;16:797–809. doi: 10.1002/1097-0061(20000630)16:9<797::AID-YEA553>3.0.CO;2-5. [DOI] [PubMed] [Google Scholar]
- 16.Lebowitz MS, Pedersen PL. Protein inhibitor of mitochondrial ATP synthase: relationship of inhibitor structure to pH-dependent regulation. Arch Biochem Biophys. 1996;330:42–54. doi: 10.1006/abbi.1996.0261. [DOI] [PubMed] [Google Scholar]
- 17.Buchhaupt M, Kötter P, Entian K-D. Mutations in the nucleolar proteins Tma23 and Nop6 suppress the malfunction of the Nep1 protein. FEMS Yeast Research. 2007;7:771–781. doi: 10.1111/j.1567-1364.2007.00230.x. [DOI] [PubMed] [Google Scholar]
- 18.Török Z, Goloubinoff P, Horváth I, Tsvetkova NM, Glatz A, et al. Proc Natl Acad Sci USA. 2001;98:3098–3103. doi: 10.1073/pnas.051619498. [DOI] [PMC free article] [PubMed] [Google Scholar]
- 19.Mazzio EA, Soliman KF. Glioma cell antioxidant capacity relative to reactive oxygen species produced by dopamine. J Appl Toxicol. 2004;24:99–106. doi: 10.1002/jat.954. [DOI] [PubMed] [Google Scholar]
- 20.Li N, Ragheb K, Lawler G, Sturgis J, Rajwa B, et al. Mitochondrial complex I inhibitor rotenone induces apoptosis through enhancing mitochondrial reactive oxygen species production. J Biol Chem. 2003;278:8516–8525. doi: 10.1074/jbc.M210432200. [DOI] [PubMed] [Google Scholar]
- 21.Chakrabortee S, Boschetti CH, Walton LJ, Sarkar S, Rubinsztein DC, et al. Hydrophilic protein associated with desiccation tolerance exhibits broad protein stabilization function. PNAS. 2007;104:18073–18078. doi: 10.1073/pnas.0706964104. [DOI] [PMC free article] [PubMed] [Google Scholar]
- 22.Koziol S, Zagulski M, Bilinski T, Bartosaz G. Antioxidants protect the yeast Saccharomyces cerevisiae against hypertonic stress. Free Radic Res. 2005;39:365–371. doi: 10.1080/10715760500045855. [DOI] [PubMed] [Google Scholar]
- 23.Martinez-Munoz GA, Kane P. Vacuolar and plasma membrane proton pumps collaborate to achieve cytosolic pH homeostasis in yeast. J Biol Chem. 2008;283:20309–20319. doi: 10.1074/jbc.M710470200. [DOI] [PMC free article] [PubMed] [Google Scholar]
- 24.Hamilton CA, Taylor GJ, Good AG. Vacuolar H+-ATPase, but not mitochondrial F1F0-ATPase, is required for NaCl tolerance in Saccharomyces cerevisiae. FEMS Microbiol Lett. 2002;208:227–232. doi: 10.1111/j.1574-6968.2002.tb11086.x. [DOI] [PubMed] [Google Scholar]
- 25.Hong S, Pedersen PL. ATP synthase of yeast: structural insight into the different inhibitory potencies of two regulatory peptides and identification of a new potential regulator. Arch Biochem Biophys. 2002;405:38–43. doi: 10.1016/s0003-9861(02)00303-x. [DOI] [PubMed] [Google Scholar]
- 26.Zhou J, Liu L, Shi Z, Du G, Chen J. ATP in current biotechnology: Regulation, applications and perspectives. Biotechnol Adv. 2009;27:94–101. doi: 10.1016/j.biotechadv.2008.10.005. [DOI] [PubMed] [Google Scholar]
- 27.Büttner S, Eisenberg T, Herker E, Carmona-Gutierrez D, Kroemer G, et al. Why yeast cells can undergo apoptosis: death in times of peace, love, and war. J Cell Biol. 2006;175:521–524. doi: 10.1083/jcb.200608098. [DOI] [PMC free article] [PubMed] [Google Scholar]
- 28.Liu Z, Butow RA. Mitochondrial retrograde signalling. Ann Rev Genet. 2006;40:159–185. doi: 10.1146/annurev.genet.40.110405.090613. [DOI] [PubMed] [Google Scholar]
- 29.Sambrook J, Russell DW. Molecular Cloning, A Laboratory Manual. New York: Cold Spring Harbor Laboratory Press; 2001. [Google Scholar]
- 30.Rodríguez-Porrata B, Lopez Martinez G, Redón M, Sancho M, Mas A, et al. Enhancing yeast cell viability after dehydration by modification of the lipid profile. W J Microbiol Biotech. 2011;27:75–83. [Google Scholar]
- 31.Buttner S, Eisenberg T, Carmona-Gutierrez D, Ruli D, Knauer H, et al. Endonuclease G regulates budding yeast life and death. Mol Cell. 2007;25:233–246. doi: 10.1016/j.molcel.2006.12.021. [DOI] [PubMed] [Google Scholar]
- 32.Pina-Vaz C, Sansonetty F, Rodrigues AG, Costa-Oliveira S, Tavares C, et al. Cytometric approach for a rapid evaluation of susceptibility of Candida strains to antifungals. Clinical Microbiology Infection. 2001;7:609–618. doi: 10.1046/j.1198-743x.2001.00307.x. [DOI] [PubMed] [Google Scholar]
- 33.Brachmann CB, Davies A, Cost GJ, Caputo E, Li J, et al. Designer deletion strains derived from Saccharomyces cerevisiae S288C: a useful set of strains and plasmids for PCR-mediated gene disruption and other applications. Yeast. 1998;14:115–132. doi: 10.1002/(SICI)1097-0061(19980130)14:2<115::AID-YEA204>3.0.CO;2-2. [DOI] [PubMed] [Google Scholar]
- 34.Jansen G, Wu C, Schade B, Thomas DY, Whiteway M. Drag & drop cloning in yeast. Gene. 2005;344:43–51. doi: 10.1016/j.gene.2004.10.016. [DOI] [PubMed] [Google Scholar]


